Role of Local Structural Variation in X-ray Photoelectron Spectrum of Silicon Oxide Interfaces
Pith reviewed 2026-06-26 20:26 UTC · model grok-4.3
The pith
Broad X-ray photoelectron lines in silicon oxide on silicon arise from a continuous statistical distribution of core-level binding energies.
A machine-rendered reading of the paper's core claim, the machinery that carries it, and where it could break.
Core claim
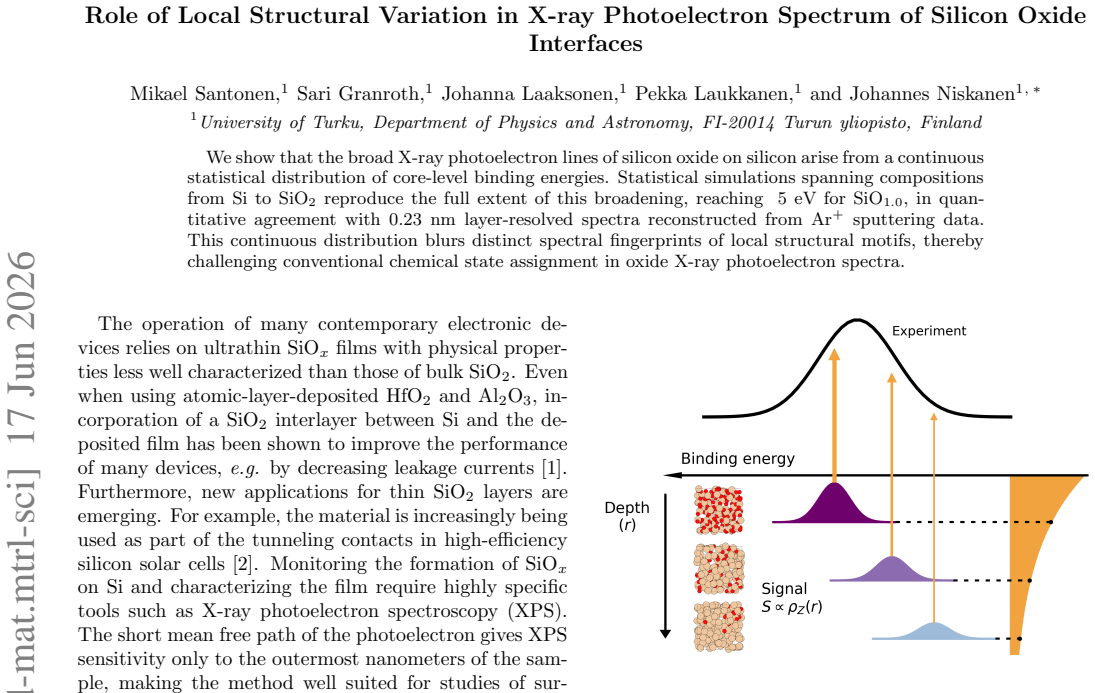
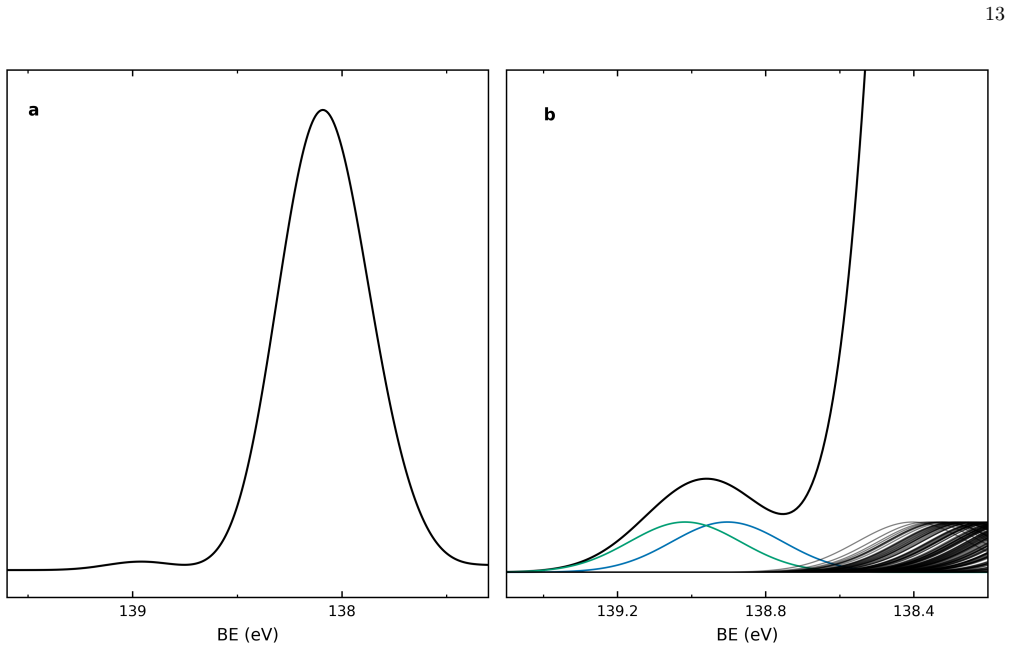
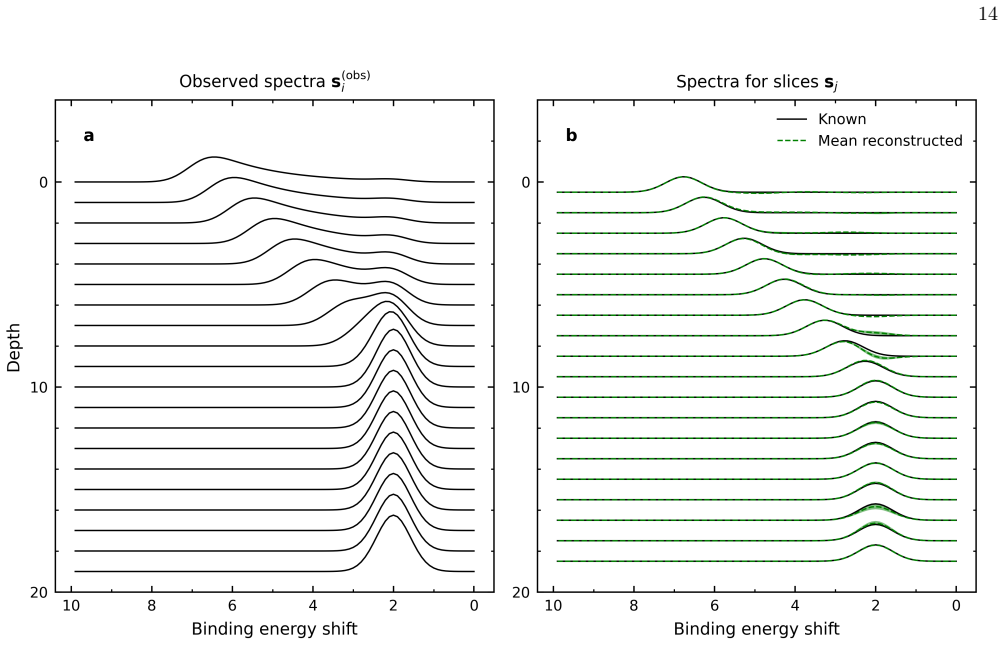
We show that the broad X-ray photoelectron lines of silicon oxide on silicon arise from a continuous statistical distribution of core-level binding energies. Statistical simulations spanning compositions from Si to SiO2 reproduce the full extent of this broadening, reaching 5 eV for SiO1.0, in quantitative agreement with 0.23 nm layer-resolved spectra reconstructed from Ar+ sputtering data. This continuous distribution blurs distinct spectral fingerprints of local structural motifs, thereby challenging conventional chemical state assignment in oxide X-ray photoelectron spectra.
What carries the argument
Continuous statistical distribution of core-level binding energies generated by local structural variations in SiOx compositions.
If this is right
- The spectral broadening reaches up to 5 eV for intermediate compositions such as SiO1.0.
- Simulations quantitatively match the layer-resolved experimental spectra from sputtering.
- Distinct local structural motifs do not produce separable spectral fingerprints due to the continuous distribution.
- Conventional chemical state assignment in oxide XPS spectra is challenged.
Where Pith is reading between the lines
- This approach could be extended to analyze interfaces in other semiconductor-oxide systems where similar broadening occurs.
- Modeling XPS spectra with continuous distributions rather than multiple discrete peaks may improve accuracy in interface analysis.
- Alternative non-destructive depth profiling methods could test whether the distribution is truly continuous without sputtering effects.
Load-bearing premise
The 0.23 nm layer-resolved spectra reconstructed from Ar+ sputtering data accurately reflect the true local structural variations without significant artifacts from the sputtering process.
What would settle it
A measurement using a method that avoids sputtering, such as angle-resolved XPS or a different profiling technique, that shows narrower lines or discrete peaks inconsistent with the simulated continuous distribution would falsify the claim.
Figures
read the original abstract
We show that the broad X-ray photoelectron lines of silicon oxide on silicon arise from a continuous statistical distribution of core-level binding energies. Statistical simulations spanning compositions from Si to SiO$_2$ reproduce the full extent of this broadening, reaching 5 eV for SiO$_{1.0}$ , in quantitative agreement with 0.23 nm layer-resolved spectra reconstructed from Ar$^+$ sputtering data. This continuous distribution blurs distinct spectral fingerprints of local structural motifs, thereby challenging conventional chemical state assignment in oxide X-ray photoelectron spectra.
Editorial analysis
A structured set of objections, weighed in public.
Referee Report
Summary. The paper claims that broad X-ray photoelectron spectroscopy (XPS) lines at silicon oxide/silicon interfaces arise from a continuous statistical distribution of core-level binding energies due to local structural variations across compositions from Si to SiO2. Statistical simulations are shown to reproduce the full observed broadening (up to 5 eV at SiO1.0) and achieve quantitative agreement with 0.23 nm layer-resolved spectra reconstructed from Ar+ sputtering experiments. This distribution is argued to blur distinct chemical-state fingerprints, challenging conventional XPS assignment of local motifs.
Significance. If the central claim is substantiated, the work would provide a mechanistic explanation for XPS line broadening at oxide interfaces and shift interpretation away from discrete chemical states toward statistical ensembles. The statistical simulation framework is a methodological strength, as it directly links local structure distributions to spectral features without heavy parameterization. However, the claimed quantitative match to experiment is the primary support, so the result's impact hinges on the fidelity of the sputtering-derived benchmark.
major comments (1)
- [comparison to sputtering data / abstract] The quantitative agreement with experiment (abstract and the section presenting the comparison to sputtering data) is load-bearing for the central claim, yet the manuscript does not adequately address known artifacts in Ar+ sputtering reconstruction of 0.23 nm layer-resolved spectra. Preferential oxygen removal, atomic mixing, and interface relaxation during sputtering can alter the very distribution of local Si environments whose binding-energy statistics the simulations are meant to reproduce; without explicit validation or mitigation (e.g., comparison to non-sputtered references or error propagation), the numerical match is not diagnostic of the pristine-interface mechanism.
minor comments (1)
- [methods] Notation for the composition variable (SiO_x) and the precise definition of the statistical ensemble (e.g., how local coordination shells are sampled) should be clarified in the methods section to allow independent reproduction.
Simulated Author's Rebuttal
We thank the referee for their thoughtful review and for identifying a key point regarding the experimental benchmark. We address the concern about sputtering artifacts below and outline revisions to improve the manuscript's clarity on this issue.
read point-by-point responses
-
Referee: The quantitative agreement with experiment (abstract and the section presenting the comparison to sputtering data) is load-bearing for the central claim, yet the manuscript does not adequately address known artifacts in Ar+ sputtering reconstruction of 0.23 nm layer-resolved spectra. Preferential oxygen removal, atomic mixing, and interface relaxation during sputtering can alter the very distribution of local Si environments whose binding-energy statistics the simulations are meant to reproduce; without explicit validation or mitigation (e.g., comparison to non-sputtered references or error propagation), the numerical match is not diagnostic of the pristine-interface mechanism.
Authors: We agree that a more explicit treatment of sputtering artifacts is warranted, as these effects (preferential sputtering, mixing, and relaxation) are well-documented in the literature and could influence the reconstructed layer-resolved spectra. The current manuscript presents the quantitative match to the published 0.23 nm data as supporting evidence for the statistical broadening mechanism but does not include a dedicated discussion of these limitations. In the revised manuscript we will add a new subsection in the comparison section that (i) summarizes the known artifacts of Ar+ sputtering on Si/SiOx interfaces, (ii) discusses how they might modify the distribution of local Si environments, and (iii) notes that the observed agreement across multiple compositions (Si to SiO2) still provides useful corroboration even if the absolute fidelity of the benchmark is reduced. We will also include a brief statement on the absence of direct non-sputtered reference spectra for this specific system and the practical difficulties of obtaining them. This revision will make the evidential basis of the claim more transparent without altering the core simulation results. revision: yes
Circularity Check
No significant circularity; simulations validated against external sputtering benchmark
full rationale
The paper's central derivation consists of statistical simulations of continuous core-level binding-energy distributions arising from local Si structural variations across compositions Si to SiO2. These simulations are shown to reproduce the observed XPS line broadening (up to 5 eV at SiO1.0) and are compared quantitatively to layer-resolved spectra obtained independently via Ar+ sputtering reconstruction. This constitutes external experimental validation rather than any reduction of the result to fitted inputs, self-definitions, or self-citation chains. No load-bearing steps match the enumerated circularity patterns.
Axiom & Free-Parameter Ledger
Reference graph
Works this paper leans on
-
[1]
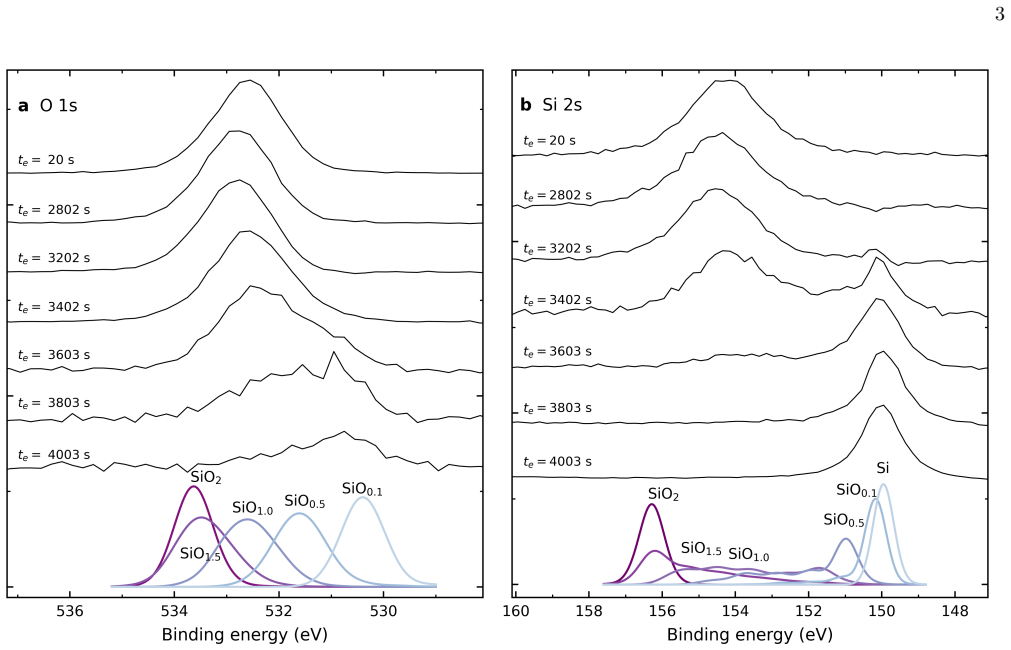
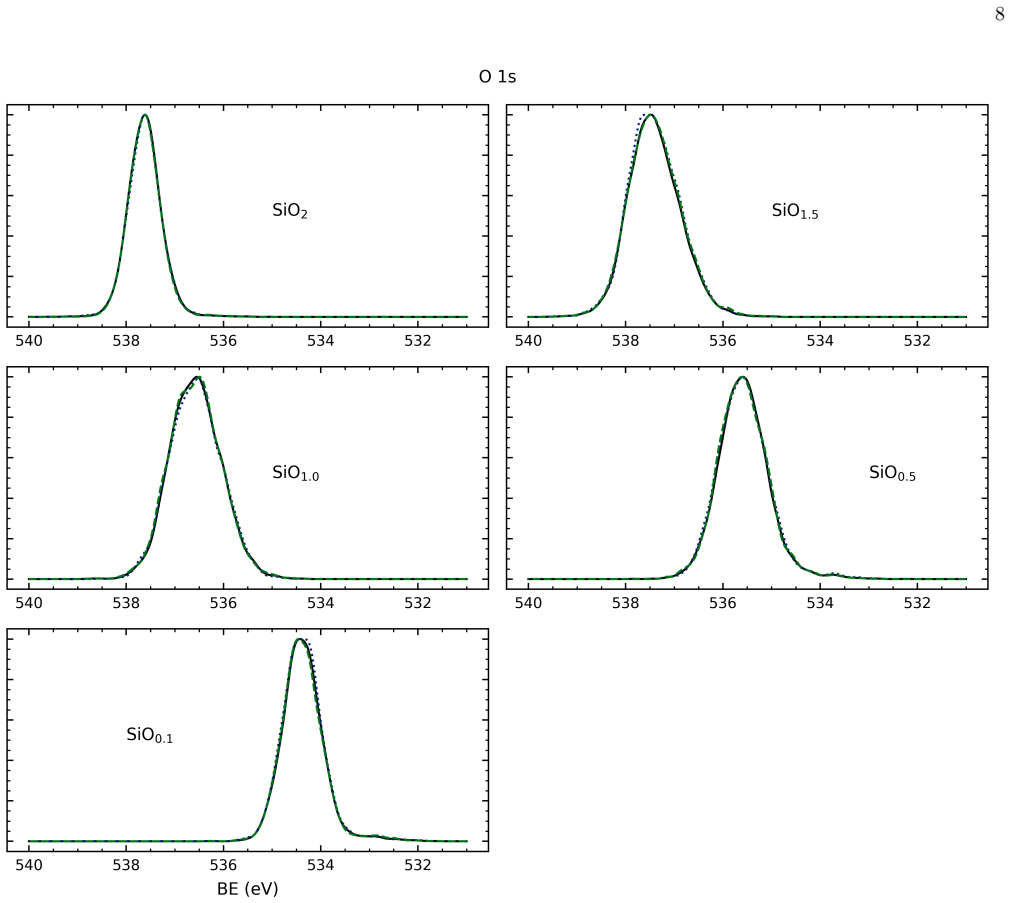
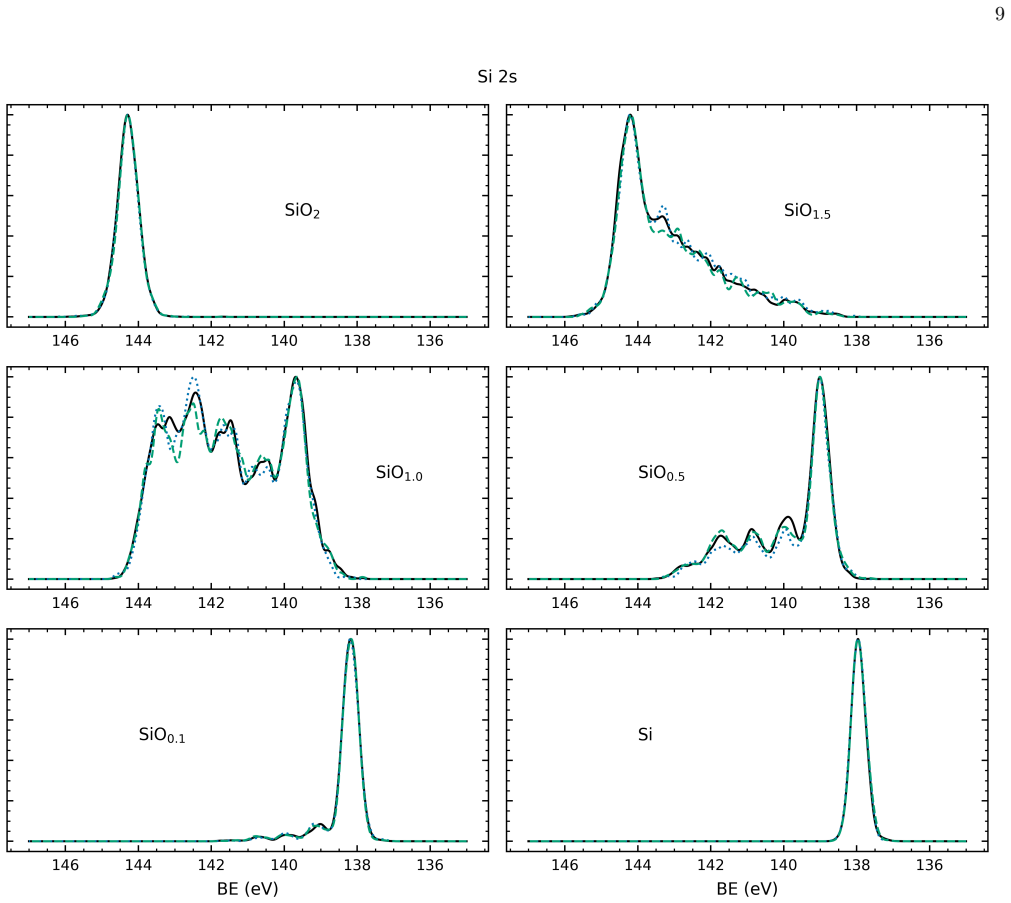
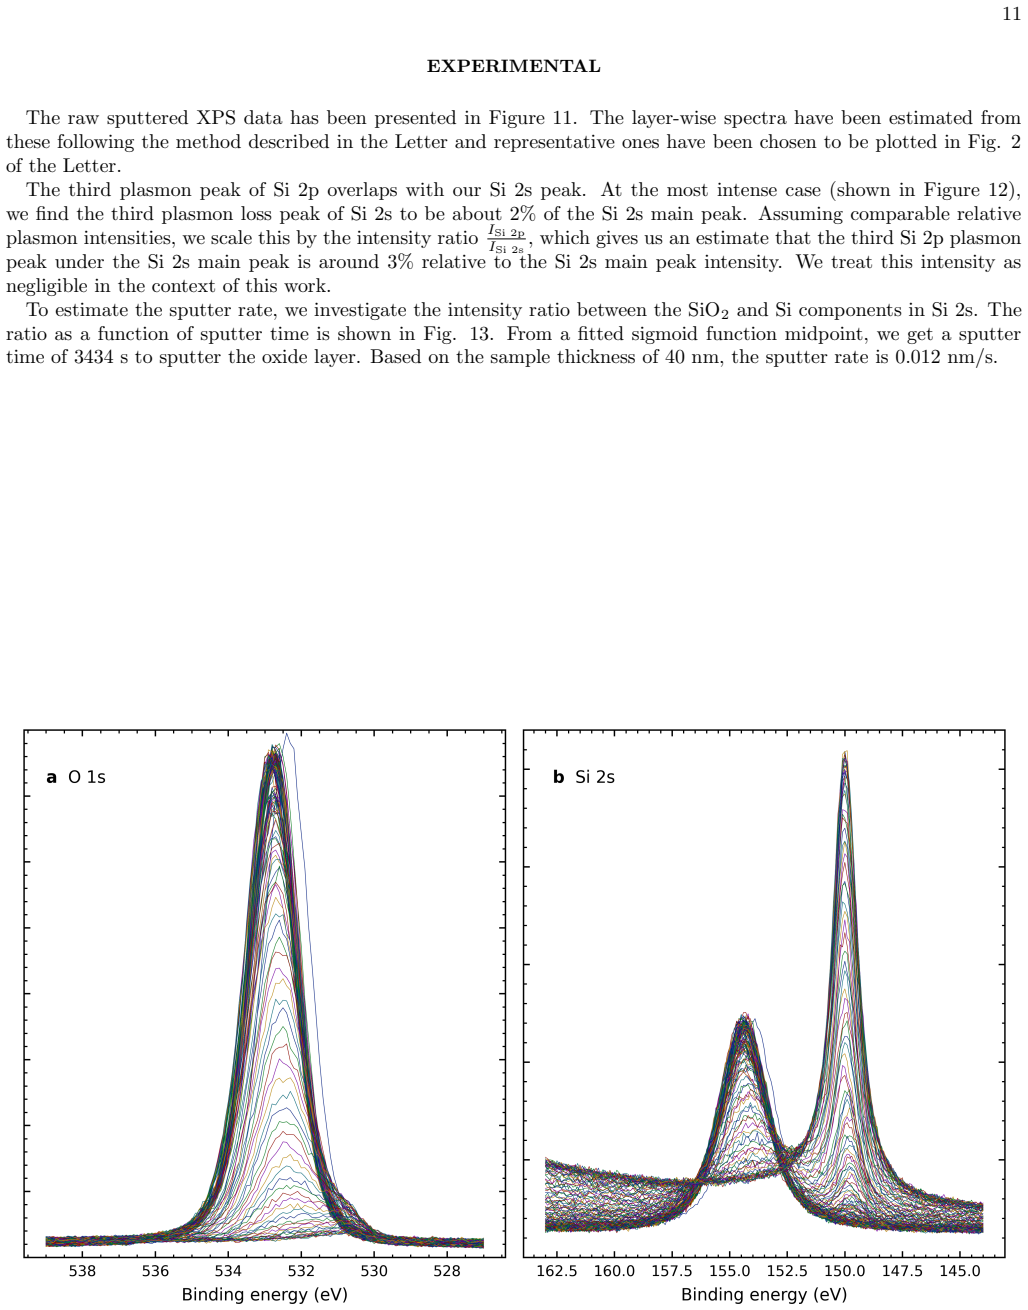
For both O 1s and Si 2s, the silicon oxide peak shifts toward lower binding energies with depth
was used for the reconstruction. For both O 1s and Si 2s, the silicon oxide peak shifts toward lower binding energies with depth. The intermediate region is char- acterized by pronounced broadening and wide spread of binding energies. As we sputter the oxide layer away, the number density of oxygen decreases and the oxygen sig- nal becomes weaker. As a re...
-
[2]
S. S. Cheema, N. Shanker, L.-C. Wang, C.-H. Hsu, S.-L. Hsu, Y.-H. Liao, M. San Jose, J. Gomez, W. Chakraborty, W. Li, J.-H. Bae, S. K. Volkman, D. Kwon, Y. Rho, G. Pinelli, R. Rastogi, D. Pipitone, C. Stull, M. Cook, B. Tyrrell, V. A. Stoica, Z. Zhang, J. W. Freeland, C. J. Tassone, A. Mehta, G. Saheli, D. Thompson, D. I. Suh, W.-T. Koo, K.-J. Nam, D. J. ...
2022
-
[3]
K¨ ohler, M
M. K¨ ohler, M. Pomaska, F. Lentz, F. Finger, U. Rau, and K. Ding, Wet-chemical preparation of silicon tunnel oxides for transparent passivated contacts in crystalline silicon solar cells, ACS Applied Materials & Interfaces 10, 14259–14263 (2018)
2018
-
[4]
J. W. Keister, J. E. Rowe, J. J. Kolodziej, H. Niimi, H.- S. Tao, T. E. Madey, and G. Lucovsky, Structure of ul- trathin SiO2/Si(111) interfaces studied by photoelectron spectroscopy, Journal of Vacuum Science & Technology A: Vacuum, Surfaces, and Films17, 1250–1257 (1999)
1999
-
[5]
E. A. Eronen, A. Vladyka, C. J. Sahle, and J. Niskanen, Structural descriptors and information extraction from X-ray emission spectra: aqueous sulfuric acid, Physical Chemistry Chemical Physics26, 22752 (2024)
2024
-
[6]
E. A. Eronen, A. Vladyka, C. J. Sahle, and J. Niska- nen, Structural Sensitivity of N 1s Excitations in N- Methylacetamide Solutions, The Journal of Physical Chemistry Letters16, 1666 (2025)
2025
-
[7]
Ottosson, K
N. Ottosson, K. J. Børve, D. Sp˚ angberg, H. Bergersen, L. J. Sæthre, M. Faubel, W. Pokapanich, G. ¨Ohrwall, O. Bj¨ orneholm, and B. Winter, On the Origins of Core- Electron Chemical Shifts of Small Biomolecules in Aque- ous Solution: Insights from Photoemission and ab Initio Calculations of Glycine (aq), Journal of the American Chemical Society133, 3120 (2011)
2011
-
[8]
Niskanen, N
J. Niskanen, N. Arul Murugan, Z. Rinkevicius, O. Vah- tras, C. Li, S. Monti, V. Carravetta, and H. ˚Agren, Hy- brid density functional–molecular mechanics calculations for core-electron binding energies of glycine in water so- lution, Phys. Chem. Chem. Phys.15, 244 (2013)
2013
-
[9]
L¨ oytynoja, J
T. L¨ oytynoja, J. Niskanen, K. J¨ ank¨ al¨ a, O. Vah- tras, Z. Rinkevicius, and H. ˚Agren, Quantum mechan- ics/molecular mechanics modeling of photoelectron spec- tra: The carbon 1s core–electron binding energies of ethanol–water solutions, The Journal of Physical Chem- istry B118, 13217 (2014)
2014
-
[10]
Tanuma, C
S. Tanuma, C. J. Powell, and D. R. Penn, Calculations of electron inelastic mean free paths. V. Data for 14 or- ganic compounds over the 50–2000 eV range, Surface and Interface Analysis21, 165 (1994)
2000
-
[11]
Hjorth Larsen, J
A. Hjorth Larsen, J. Jørgen Mortensen, J. Blomqvist, I. E. Castelli, R. Christensen, M. Du lak, J. Friis, M. N. Groves, B. Hammer, C. Hargus, E. D. Hermes, P. C. Jennings, P. Bjerre Jensen, J. Kermode, J. R. Kitchin, E. Leonhard Kolsbjerg, J. Kubal, K. Kaasb- jerg, S. Lysgaard, J. Bergmann Maronsson, T. Max- son, T. Olsen, L. Pastewka, A. Peterson, C. Ros...
2017
-
[12]
I. Batatia, P. Benner, Y. Chiang, A. M. Elena, D. P. Kov´ acs, J. Riebesell, X. R. Advincula, M. Asta, M. Avaylon, W. J. Baldwin, F. Berger, N. Bernstein, A. Bhowmik, F. Bigi, S. M. Blau, V. C˘ arare, M. Ceriotti, S. Chong, J. P. Darby, S. De, F. D. Pia, V. L. Deringer, R. Elijoˇ sius, Z. El-Machachi, F. Falcioni, E. Fako, A. C. Ferrari, J. L. A. Gardner,...
Pith/arXiv arXiv 2025
-
[14]
Vashishta, R
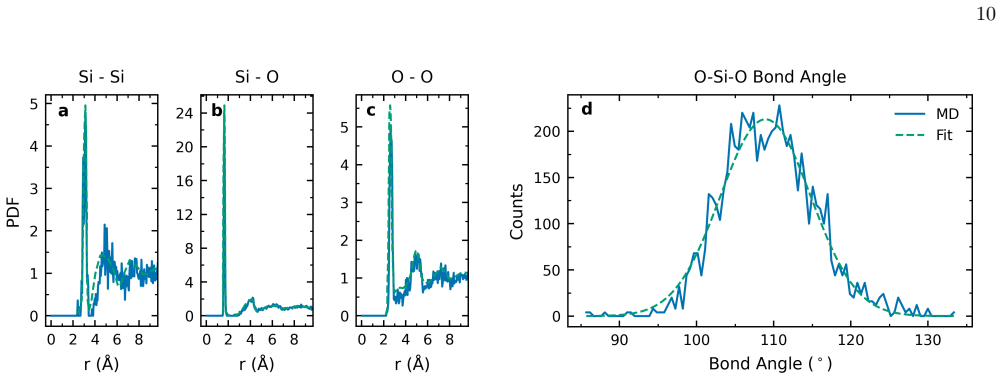
P. Vashishta, R. K. Kalia, J. P. Rino, and I. Ebbsj¨ o, Inter- action potential for SiO 2: A molecular-dynamics study of structural correlations, Phys. Rev. B41, 12197 (1990)
1990
-
[15]
J. J. Mortensen, A. H. Larsen, M. Kuisma, A. V. Ivanov, A. Taghizadeh, A. Peterson, A. Haldar, A. O. Dohn, C. Sch¨ afer, E. ¨O. J´ onsson, E. D. Hermes, F. A. Nils- son, G. Kastlunger, G. Levi, H. J´ onsson, H. H¨ akkinen, J. Fojt, J. Kangsabanik, J. Sødequist, J. Lehtom¨ aki, J. Heske, J. Enkovaara, K. T. Winther, M. Dulak, M. M. Melander, M. Ovesen, M. ...
2024
-
[16]
J. P. Perdew, K. Burke, and M. Ernzerhof, Generalized gradient approximation made simple, Physical Review Letters77, 3865 (1996)
1996
-
[17]
Kohn and L
W. Kohn and L. J. Sham, Self-consistent equations in- cluding exchange and correlation effects, Phys. Rev.140, A1133 (1965)
1965
-
[18]
Travnikova, K
O. Travnikova, K. J. Børve, M. Patanen, J. S¨ oderstr¨ om, C. Miron, L. J. Sæthre, N. M˚ artensson, and S. Svens- son, The ESCA molecule—Historical remarks and new results, Journal of Electron Spectroscopy and Related Phenomena185, 191 (2012)
2012
-
[19]
G. M. Bancroft, H. W. Nesbitt, R. Ho, D. M. Shaw, J. S. Tse, and M. C. Biesinger, Toward a comprehensive un- derstanding of solid-state core-level XPS linewidths: Ex- perimental and theoretical studies on the Si 2pand O 1s linewidths in silicates, Phys. Rev. B80, 075405 (2009)
2009
-
[20]
F. J. Himpsel, F. R. McFeely, A. Taleb-Ibrahimi, J. A. Yarmoff, and G. Hollinger, Microscopic structure of the SiO2/Si interface, Physical Review B38, 6084–6096 (1988)
1988
-
[21]
Stegemann, K
B. Stegemann, K. M. Gad, P. Balamou, D. Sixtensson, D. V¨ ossing, M. Kasemann, and H. Angermann, Ultra- thin silicon oxide layers on crystalline silicon wafers: Comparison of advanced oxidation techniques with re- spect to chemically abrupt SiO2/Si interfaces with low defect densities, Applied Surface Science395, 78 (2017), progress in Applied Surface, In...
2017
-
[22]
M. M. Banaszak Holl, S. Lee, and F. R. McFeely, Core- level photoemission and the structure of the Si/SiO2 interface: A reappraisal, Applied Physics Letters65, 1097–1099 (1994)
1994
-
[23]
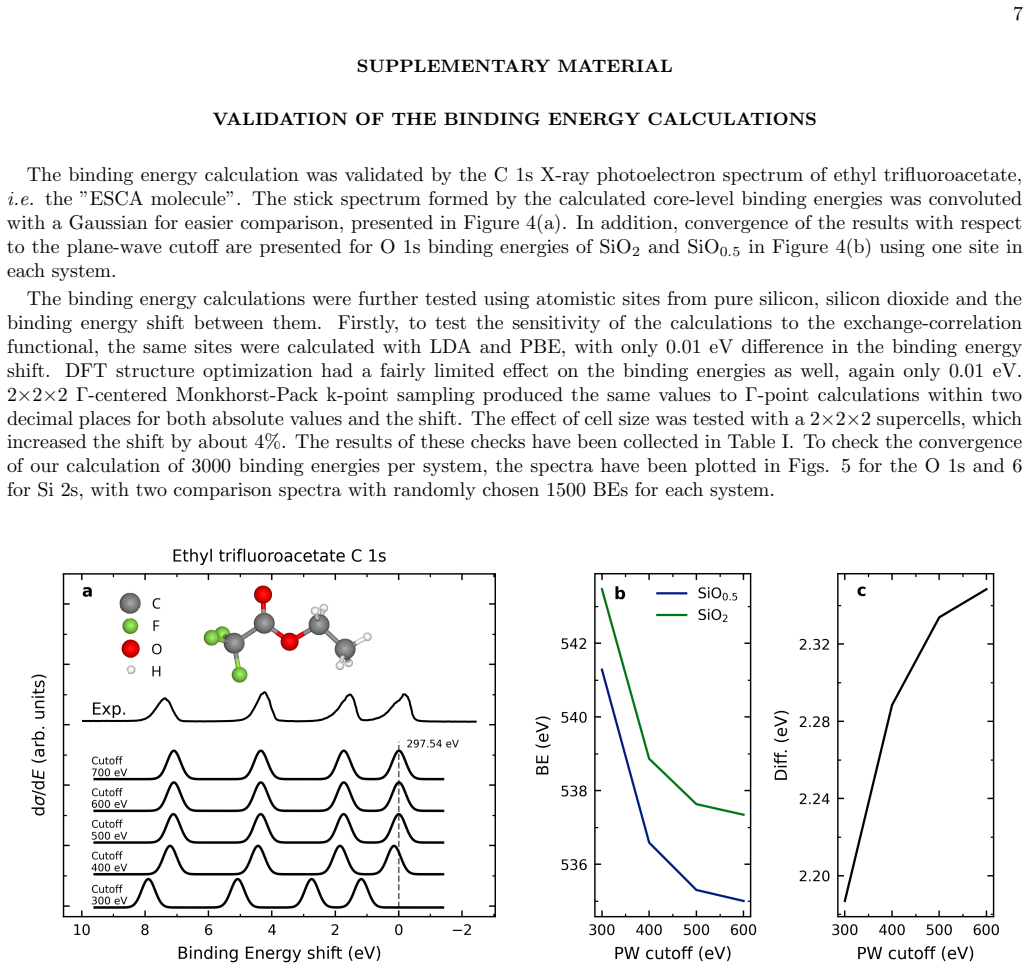
K. Z. Zhang, K. E. Litz, M. M. Banaszak Holl, and F. R. McFeely, The role of second-neighbor effects in photoe- mission: Are silicon surfaces and interfaces special?, Ap- plied Physics Letters72, 46–48 (1998). 7 SUPPLEMENT AR Y MA TERIAL V ALIDA TION OF THE BINDING ENERGY CALCULA TIONS The binding energy calculation was validated by the C 1s X-ray photoel...
discussion (0)
Sign in with ORCID, Apple, or X to comment. Anyone can read and Pith papers without signing in.