REVIEW 1 major objections 1 minor 1 cited by
Intermediate-velocity clouds make up only 18% of high-altitude clouds near the Sun, with most showing low velocities.
Reviewed by Pith at T0; open to challenge. T0 means a machine referee read the full paper against a public rubric. the ladder, T0–T4 →
T0 review · grok-4.3
2026-06-30 13:32 UTC pith:BI3UY6DC
load-bearing objection Low-velocity clouds outnumber IVCs at high |z| near the Sun by about 5 to 1, with a 2.9x north-south asymmetry, from the first 3D dust-based search. the 1 major comments →
The 3D Structure and Kinematics of the Local Disk-Halo Interface: Intermediate-velocity Clouds are the Minority of High-altitude Clouds in the Solar Neighborhood
The pith
A machine-rendered reading of the paper's core claim, the machinery that carries it, and where it could break.
Core claim
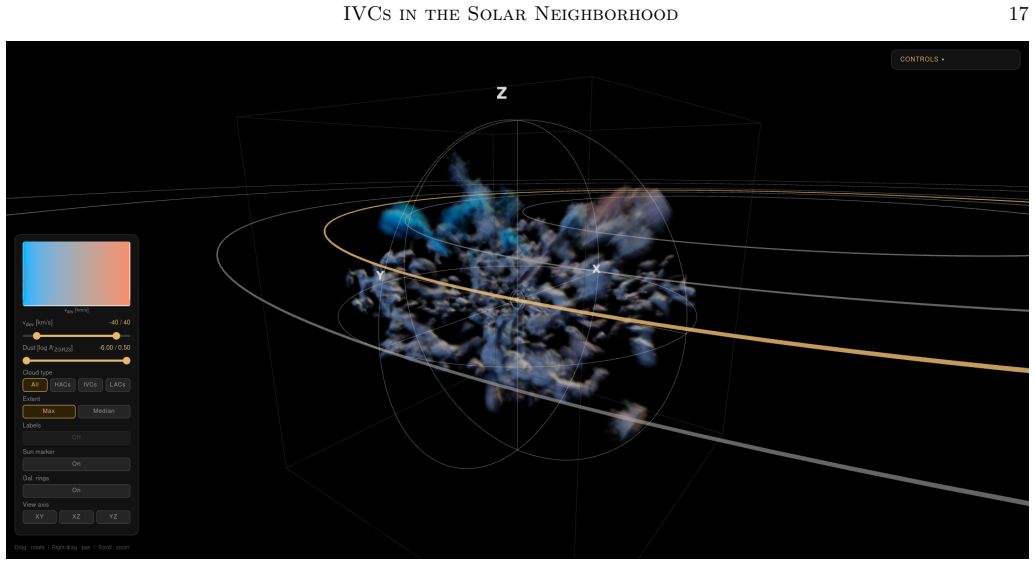
By identifying dust clouds in three dimensions and linking them morphologically to HI 21 cm emission, the authors demonstrate that intermediate-velocity clouds represent only 18% of the total number of clouds at |z| >= 480 pc in the Solar Neighborhood, with the remainder exhibiting low radial velocities, while also recording a strong north-south asymmetry of (2.9 ± 0.2) times more clouds in the northern Galactic hemisphere at these heights.
What carries the argument
Morphological similarity between 3D dust structures from topological extraction and HI 21 cm emission used to assign radial velocities to a sample of 519 clouds.
Load-bearing premise
That matching the shapes of dust clouds in the 3D map to HI emission features assigns the correct radial velocities without significant projection or line-of-sight confusion.
What would settle it
A spectroscopic radial-velocity measurement of one high-altitude dust cloud that differs from the velocity inferred from its HI morphological match.
If this is right
- Models of the local disk-halo interface must incorporate low-radial-velocity structures at high altitudes rather than focusing solely on velocity outliers.
- The observed north-south asymmetry in cloud counts at |z| >= 480 pc requires explanation in any description of feedback-driven Galactic fountain flows.
- The newly identified 3D IVCs within the Intermediate Velocity Arch now supply direct distances, sizes, densities, masses, pressures, and dust-to-gas ratios.
- Accounting for the full population of high-altitude clouds changes estimates of mass and energy exchange between disk and halo.
Where Pith is reading between the lines
- Extending the morphological velocity assignment method to larger 3D dust maps could test whether the 18% minority fraction for IVCs persists beyond the Solar Neighborhood.
- The vertical asymmetry might connect to asymmetric star-formation histories or magnetic-field configurations on one side of the plane.
- If the shape-matching technique proves robust, it offers a route to kinematic studies of dust clouds without requiring complete spectroscopic coverage.
Editorial analysis
A structured set of objections, weighed in public.
Referee Report
Summary. The paper performs the first 3D spatial search for anomalous-velocity clouds at the local disk-halo interface by applying a topological structure finder to a parsec-resolution 3D dust map, identifying 1,695 dust clouds within 1.25 kpc (z from -646 to +928 pc). Morphological similarity to HI 21 cm emission is used to assign radial velocities, yielding a high-confidence sample of 519 clouds. The work reports several IVCs (including the first 3D identification of structures in the Intermediate Velocity Arch), a 2.9 ± 0.2 north-south asymmetry above |z| ≥ 480 pc, and that IVCs constitute only 18% of clouds at these altitudes, with the majority having low velocities.
Significance. If the velocity assignments hold, the result demonstrates that low-radial-velocity structures dominate the high-altitude population in the Solar Neighborhood, underscoring the need to include them in disk-halo interface and Galactic fountain models. The provision of direct 3D distances, sizes, densities, masses, pressures, and dust-to-gas ratios for IVCs is a concrete advance over prior 2D studies.
major comments (1)
- [Methods (sample construction)] Methods (sample construction of the 519 clouds): The assignment of radial velocities rests on morphological similarity between 3D dust structures and HI 21 cm emission, but the manuscript provides no false-positive rate, confusion matrix, or validation against independent velocity tracers. At |z| ≥ 480 pc, multiple velocity components commonly overlap on the sky; without quantified reliability, the partitioning into the 18% IVC fraction cannot be verified and is load-bearing for the central claim.
minor comments (1)
- [Abstract and results] Abstract and §4: the reported asymmetry factor (2.9 ± 0.2) and 18% fraction should be accompanied by explicit statements of the exact altitude cut and sample size used in each calculation.
Simulated Author's Rebuttal
We thank the referee for their detailed and constructive report. We agree that the reliability of the velocity assignments is central to the 18% IVC fraction and will strengthen the manuscript on this point.
read point-by-point responses
-
Referee: [Methods (sample construction)] Methods (sample construction of the 519 clouds): The assignment of radial velocities rests on morphological similarity between 3D dust structures and HI 21 cm emission, but the manuscript provides no false-positive rate, confusion matrix, or validation against independent velocity tracers. At |z| ≥ 480 pc, multiple velocity components commonly overlap on the sky; without quantified reliability, the partitioning into the 18% IVC fraction cannot be verified and is load-bearing for the central claim.
Authors: We acknowledge that the current manuscript does not provide a quantitative false-positive rate or confusion matrix for the morphological matching procedure. The velocity assignments were performed by direct visual and structural comparison of the 3D dust clouds to HI 21 cm emission maps (primarily from the HI4PI survey), requiring clear spatial coincidence in both projected morphology and velocity channel. We will revise the Methods section to (1) explicitly list the matching criteria used to define the high-confidence sample of 519 clouds, (2) include a new subsection or appendix with examples of both successful matches (including the IVA structures whose velocities align with literature values) and ambiguous cases that were excluded, and (3) discuss the impact of line-of-sight velocity crowding at |z| ≥ 480 pc, noting that the majority of our high-|z| clouds lie at latitudes where a single dominant HI component is typically present. While a full statistical validation against independent tracers (e.g., absorption-line measurements) is not feasible with existing data, we will add a qualitative reliability estimate based on the fraction of clouds that match known IVC complexes. These changes will allow readers to assess the robustness of the 18% IVC fraction. revision: yes
Circularity Check
No significant circularity; observational counts from independent data sources.
full rationale
The paper constructs a sample of 519 clouds via topological structure finding on an external 3D dust map, then assigns radial velocities through morphological comparison to HI 21 cm data. The headline fraction (IVCs = 18% at |z| >= 480 pc) is obtained by direct enumeration of the resulting catalog. No equations, fitted parameters, or self-citations are invoked that reduce this count to a tautology or to the inputs by construction. The derivation chain is self-contained against external benchmarks and contains no self-definitional, fitted-input, or load-bearing self-citation steps.
Axiom & Free-Parameter Ledger
axioms (2)
- domain assumption The 3D dust map used has sufficient resolution and fidelity to identify individual clouds at |z| up to ~900 pc.
- domain assumption Morphological similarity between dust and HI emission provides a reliable proxy for assigning radial velocities.
read the original abstract
Studies of the Milky Way's disk-halo interface have historically identified inflowing and outflowing gas incompatible with disk rotation on the basis of radial velocity, leading to the well-known categories of intermediate-velocity clouds (IVCs) and high-velocity clouds (HVCs). In this work, we leverage recent progress in 3D dust mapping of the Solar Neighborhood to perform the first 3D spatial search for anomalous-velocity clouds at the local disk-halo interface. We identify 1,695 dust clouds within 1.25 kpc of the Sun (with altitudes ranging between z=-646 pc to z=+928 pc) by applying a topological structure finding method to a parsec-resolution 3D dust map. We then evaluate the morphological similarity between these clouds and HI 21 cm emission to measure cloud kinematics, and construct a sample of 519 clouds with high-confidence distances, 3D morphologies, and radial velocities. Among these are several IVCs (embedded within the well-known Intermediate Velocity Arch complex) now identified in 3D for the first time, enabling direct measurement of their distances, sizes, densities, masses, pressures, and dust-to-gas ratios. We observe a pronounced asymmetry in the vertical distribution of all clouds in the Solar Neighborhood, with $(2.9 \pm 0.2) \times$ more clouds in the Northern Galactic hemisphere than the Southern above altitudes at which IVCs are present ($|z| \geq 480$ pc). IVCs make up only 18% of the total number of clouds located at these high altitudes, with the remainder having low velocities -- highlighting the importance of accounting for low-radial-velocity structures when evaluating the local disk-halo interface and modeling feedback-driven Galactic fountain flows.
Figures




Forward citations
Cited by 1 Pith paper
-
Gas accretion onto the Milky Way: high-velocity cloud survival and the revival of the terminal-velocity paradigm
Terminal velocity is a local, conditional equilibrium for Milky Way high-velocity clouds: dense clouds fall quasi-ballistically, adiabatic clouds break up, and radiative cooling can restore terminal-like motion.
Reference graph
Works this paper leans on
-
[1]
Anderson, L. D., Wenger, T. V., Armentrout, W. P., Balser, D. S., & Bania, T. M. 2019, ApJ, 871, 145 Astropy Collaboration, Robitaille, T. P., Tollerud, E. J., et al. 2013, A&A, 558, A33 Astropy Collaboration, Price-Whelan, A. M., Sipőcz, B. M., et al. 2018, AJ, 156, 123 Astropy Collaboration, Price-Whelan, A. M., Lim, P. L., et al. 2022, ApJ, 935, 167 Ba...
work page 2019
-
[2]
Cubical ripser: Software for computing persistent homology of image and volume data,
10 3 10 2 10 1 100 Two-sided p-value p = 0.05 [5.5, 8.0] km s 1 Figure C1.Left:Histograms of the distributions of synthetic “too-fast” cloud fractionsFsyn for various amplitudes of injected isotropic Gaussian turbulence:σ= 0.01km s −1, 1 km s−1, 5.5 km s−1, 8 km s−1, 15 km s−1, and 25 km s−1, with histogram color increasing continuously from dark purple t...
discussion (0)
Sign in with ORCID, Apple, or X to comment. Anyone can read and Pith papers without signing in.