REVIEW 5 major objections 5 minor 54 references
Optimal Spatial Anomaly Detection
T0 review · 5 major / 5 minor · reviewed 2026-08-04 · deepseek-v4-flash
Pith's one-line read Counting and localizing spatial anomaly regions on a lattice is provably consistent, with minimax-optimal localization up to a log factor.
desk verdict Novel convex-hull penalty and plausible rates, but missing proofs, a mismatch between the minimax lower-bound class and the upper-bound assumptions, and an unanalyzed approximation algorithm leave the core claims unverified. read the letter →
The pith
A machine-rendered reading of the paper's core claim, the machinery that carries it, and where it could break.
The reading
What carries the argument
The central object is the double-penalized least-squares cost C(m; R_1:m) = L(R_1:m) + beta*m + lambda * sum_j |Co(R_j)|, where Co(R) is the minimum convex hull of a region (the smallest convex lattice polygon enclosing it). The L0 term beta*m controls the number of anomaly regions, while the convex-hull-area term lambda*|Co(R_j)| penalizes spatial scatter, making it costly to merge distant regions that share the same mean signal. The consistency proof relies on this convex-hull penalty to prevent over-merging, and the minimax lower bound is derived through a Fano-type argument. Computationally, the exact minimization is NP-hard, so the paper introduces the Circular Region Segmentation (CRS)
What would settle it
Simulate a lattice with two same-mean anomaly regions whose size and signal place them above the claimed SNR threshold but whose centers are closer than their diameters (violating the separation assumption). If the estimator fails to separate them and the localization error exceeds C * sigma^2/Delta^2 * sqrt(n) log n, the consistency claim fails in that regime. Alternatively, shrink the anomaly size below a constant fraction of n while keeping the SNR high; if the method still works, it reveals the assumption is stronger than necessary.
Extended reading notes
Core claim
The central claim is that spatial anomaly detection has a sharp detectability threshold: when the region size and mean shift satisfy delta*Delta^2/sigma^2 < sqrt(n) log n, no estimator can localize the anomalies (the minimax error is at least n/64), while above that threshold the optimal localization error is of order sigma^2/Delta^2 * sqrt(n). DPLS-SAD attains this optimal rate up to a multiplicative log n factor under the paper's assumptions. The estimator minimizes a least-squares cost with both an L0 penalty on the number of regions and a convex-hull-area penalty on each region, and it is guaranteed to recover the true number of anomalies along with a localization error bound. The guaran
Load-bearing premise
The load-bearing premise is that every true anomaly region is large—a constant fraction of the whole lattice—and well separated from other regions, with gaps larger than the regions' own diameters; small or touching anomalies lie outside the theorem's guarantees.
Editorial extensions
If this is right
- Counting and locating multiple spatial anomalies with complex shapes—holes, concavities, disconnected components—is achievable with a single objective and is provably consistent.
- The SNR threshold sqrt(n) log n separates an impossible regime from a solvable one, giving practitioners a concrete way to check whether their dataset's region size and mean shift are strong enough for reliable detection.
- The sqrt(n) localization error is the inherent price of moving from timeline changepoint detection (O(log n)) to spatial detection; no method can beat it in the worst case.
- The method applies directly to real-world gridded data, and the paper demonstrates automatic recovery of major marine heatwave regions from sea surface temperature fields.
- In general dimensions, the localization error scales as n/n_max * log n, revealing a curse of dimensionality as the dimension grows.
Reading between the lines
- Beyond the paper's stated claims, a practical tuning implication is that the convex-hull penalty should be small relative to the L0 penalty (lambda roughly beta/n); this ratio may transfer to other spatial segmentation methods.
- The convex-hull penalty could plausibly be replaced by a graph-convex-hull or Steiner-tree penalty for anomaly detection on networks or graphs, where Euclidean hulls are undefined.
- The paper's Supplementary Material A shows that when anomaly regions are adjacent but have distinct mean signals, the classic L0 penalized cost alone suffices—suggesting the convex-hull penalty is specifically for separating same-mean regions.
- Editorial flag: the proofs of the main theorems are announced in Supplementary Material C as 'available upon request' rather than reproduced in the posted text, so the consistency and minimax claims are not fully verifiable from the submitted manuscript alone.
Editorial analysis
A structured set of objections, weighed in public.
Referee Report
Summary. The paper introduces DPLS-SAD, a double-penalized least-squares method for detecting multiple spatial anomaly regions on a lattice. The cost function combines an L0 penalty on the number of regions with a penalty on the cardinality of the minimum convex hull of each region. Under assumptions of sub-Gaussian noise, large region size, region smoothness, and spatial separation, Theorem 1 claims consistency of the number of anomalies and a localization error of order (sigma^2/Delta^2) sqrt(n) log n for the exact minimizer of (3.1). Theorems 2 and 3 state a minimax phase transition at SNR delta Delta^2/sigma^2 ~ sqrt(n) log n and a lower bound of order (sigma^2/Delta^2) sqrt(n), leading to the claim of minimax optimality up to a logarithmic factor. Extensions to general dimensions and spatially dependent errors are given in Theorems 4-6. An approximate dynamic-programming/CRS algorithm (Algorithm 2) is proposed with O(n^4) cost, and simulations plus a marine-heatwave application are provided. The main technical proofs are not included in the manuscript or supplement; Supplementary Material C states they are 'available upon request.'
Significance. If the results are correct, the paper introduces a novel formulation for spatial collective anomaly detection with explicit non-asymptotic rates, a phase transition, and flexibility in anomaly shape. The localisation rate sqrt(n) log n versus log n in the timeline setting is an interesting and plausible 'price of spatiality.' The convex-hull penalty is a creative device to discourage merging of distant regions. The extension to dependent data and higher dimensions broadens applicability. However, the current manuscript does not allow verification of the central theorems because proofs are omitted, the minimax lower bound is stated for a broader class than the upper bound's assumptions, and the proposed algorithm has no theoretical guarantee. The empirical study uses oracle-tuned penalties and, in most settings, violates the paper's own large-region assumption.
major comments (5)
- [Supplementary Material C] The proofs of Theorems 1-6 and Theorem A.1 are said to be 'available upon request.' This is not acceptable for a journal submission: all central claims in the paper depend on these proofs, and the manuscript cannot be evaluated for correctness. The authors must include complete, self-contained proofs in the supplement.
- [Section 4, Theorems 2-3 vs Section 3, Theorem 1] Theorem 3 gives a minimax lower bound over all distributions satisfying only the Section 2.1 model and Assumption 1, while the upper bound in Theorem 1 requires Assumptions 2 and 3 (large regions, separation, smoothness). A lower bound over a larger class does not imply the same lower bound over the restricted class used in the upper bound; the minimax risk over the restricted class can be strictly smaller. To claim DPLS-SAD is minimax optimal up to a logarithm for the class in Theorem 1, the hard instances used in the Fano argument must also satisfy Assumptions 2 and 3. As stated, the optimality claim is not established.
- [Section 6, Algorithm 2] Theorems 1, 4, and 6 are proved for the exact minimizer of (3.1) or (5.1), but Algorithm 2 solves a modified problem: it sorts observations by absolute deviation, restricts attention to the first N points, and uses the CRS heuristic to construct regions. No theorem states that the output of Algorithm 2 achieves the same consistency or localisation rates, or even that the approximation error is controlled. Without such a guarantee, the computational method is not theoretically supported. The authors should either prove a risk bound for Algorithm 2 or explicitly state that it is a heuristic with no theoretical backing.
- [Section 7.1, Table 1] The simulation study sets beta = Delta * delta and lambda = beta/n using the true values of Delta and delta, and in Setting 3 these are additionally scaled by 0.65. This is oracle tuning: the penalization uses information unavailable in practice. The claim that DPLS-SAD is robust to a wide range of penalties does not remedy the fact that the reported NoC and Err numbers are not evidence for data-driven performance. A data-driven selection procedure (e.g., based on sensitivity analysis or cross-validation) should be implemented and evaluated, or the results should be presented as an oracle benchmark.
- [Assumption 2(ii) vs Section 7.1] Assumption 2(ii) requires each anomaly region to contain a constant fraction of the lattice, delta >= C_R n. In the simulations, the anomaly sizes are far smaller. For example, with n=2500 and Setting 1, |R|=180 split among five equal regions gives delta=36, a fraction of 0.014; even the largest simulated regions give fractions well below any reasonable constant C_R. Thus the simulation settings lie outside the regime in which Theorem 1 is proved. The paper should either state that the simulations are outside the theoretical assumptions (making them only heuristic evidence) or adjust the theory to cover smaller anomaly regions.
minor comments (5)
- [Section 2.2] Typo: 'seminal measures' should likely be 'seminal measures' or 'standard measures'; also the sentence structure is awkward.
- [Figure 1 caption] Caption reads 'llustration' — missing 'I'.
- [References] Reference 'International Journal of Computer Vxision' contains a typo ('Vxision' should be 'Vision').
- [Section 6] The notation S_{1:N} is used before being formally defined; please define the ordering and the truncation precisely. Also, the CRS threshold xi_m is introduced in Algorithm 2 but its choice in simulations (xi_m = 20 * floor(log10(sqrt(n)))/m) is not derived or justified beyond being a practical choice.
- [Section 7.2 / Table 2] The 3D simulation uses a 12x12x12 lattice, which is very small (n=1728). It would be helpful to state whether the theoretical Assumption 4(iii) (d_B > 2 d_A) is satisfied for these configurations; otherwise the results are again outside the theory.
Circularity Check
Theoretical derivation is self-contained; simulation section uses oracle penalties, giving mild empirical circularity.
-
other
[Section 7.1 and Table 1 caption]
"As a result, in most settings, we setβ=∆·δ. From our theorems,λis smaller thanβroughly by a factor ofn. Therefore, we fixλ=β/nin the simulations. In practice, when (∆, δ) are not available, we can selectβbased on sensitivity analysis. ... In Settings 3, we scale bothβandλby factors of 0.65."
The Monte Carlo evaluation sets the penalty parameters using the true minimal signal Δ and the true minimal region size δ, which are exactly the unknown quantities the DPLS-SAD cost is designed to recover, and it adds a further 0.65 rescaling in Setting 3. The reported NoC and Err numbers are therefore conditional on oracle knowledge of the very objects being estimated, and the empirical curves partly restate the oracle tuning choices rather than testing a fully data-driven procedure. This does not make the theorems circular, but it weakens the claim that the simulations independently demonstrate the numeric performance of the method.
full rationale
The paper's theoretical derivation chain is not circular. The DPLS-SAD estimator is defined by an explicit penalized least squares objective, Theorem 1 is stated under explicit Assumptions 1-3 with specified penalty scalings, and the localisation bound is not obtained by plugging the target quantity back into an assumption. The minimum convex hull penalty is defined independently of the true anomaly regions. The only noticeable self-citation, Zheng et al. (2022), is background support for L0 penalised cost approaches and is not load-bearing for the new spatial results. The main circularity concern is empirical rather than mathematical: Section 7.1 tunes β=Δδ and λ=β/n using the true values of Δ and δ, and also rescales both penalties by 0.65 in Setting 3, so the simulation evidence is partly an evaluation of an oracle-tuned version of the method. Separately, there is a scope gap in the claimed minimax optimality: Theorems 2 and 3 lower-bound a broad class satisfying only Assumption 1, whereas Theorem 1 upper-bounds the narrower smooth, well-separated class of Assumptions 2-3; unless the Fano hard instances satisfy the upper-bound assumptions, the lower bound does not transfer. That is a correctness/verifiability concern, not a circular reduction, and the supplementary proofs are only 'available upon request,' so it cannot currently be checked.
Assumptions & free parameters
free parameters (4)
- L0 penalty beta =
beta = Delta*delta in simulations; C_beta*sqrt(n)*log(n) in theory (C_beta unspecified)
- Convex-hull penalty lambda =
lambda = beta/n in simulations; C_lambda*log(n)/sqrt(n) in theory (C_lambda unspecified)
- CRS threshold xi_m =
xi_m = 20*floor(log10(sqrt(n)))/m
- Setting 3 scale factor =
0.65
assumptions (6)
- domain assumption Sub-Gaussian independent errors (Assumption 1)
- domain assumption Known baseline mean mu_0* and variance proxy sigma^2
- domain assumption Signal strength and region size: Delta^2/sigma^2 >= C_eta log^{1+eta} n / sqrt(n) and delta >= C_R n (Assumption 2(i)-(ii))
- domain assumption Well-separation: diameter <= d_A sqrt(n) and distance >= d_B sqrt(n) (Assumption 2(iii))
- domain assumption Smooth regional class R: at most K intervals per row (Assumption 3)
- ad hoc to paper The approximate CRS/DP algorithm preserves the rates of the exact minimizer
Cite this review
Pith. "Pith review of Optimal Spatial Anomaly Detection." pith.science (2026). https://pith.science/paper/BLTFZMJF
@misc{pith2026251022330,
  author       = {Pith},
  title        = {Pith review of: Optimal Spatial Anomaly Detection},
  year         = {2026},
  howpublished = {\url{https://pith.science/paper/BLTFZMJF}},
  note         = {Machine review of arXiv:2510.22330}
}
abstract
There has been a growing interest in anomaly detection problems recently, whilst their focuses are mostly on anomalies taking place on the time index. In this work, we investigate a new anomaly-in-mean problem in multidimensional spatial lattice, that is, to detect the number and locations of anomaly ``spatial regions'' from the baseline. In addition to the classic minimization over the cost function with a $L_0$ penalization, we introduce an innovative penalty on the area of the minimum convex hull that covers the anomaly regions. We show that the proposed method yields a consistent estimation of the number and locations of spatial anomalies. Under the minimax framework, we characterize the optimal detection error for multidimensional spatial anomaly detection problem and reveal the trade-off between detection performance and the geometric flexibility of anomaly region shapes. Large-scale Monte Carlo simulations are carried out to examine the numeric performance of the method. The method has a wide range of applications in real-world problems. As an example, we apply it to detect the marine heatwaves using the sea surface temperature data from the European Space Agency.
Figures


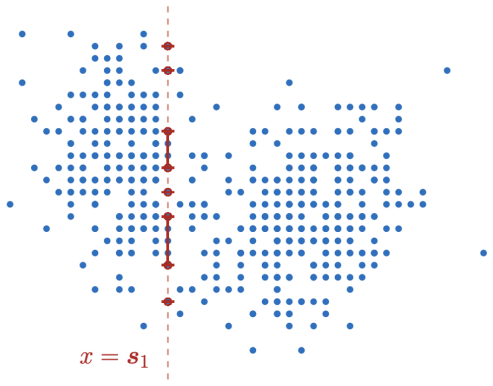
Figures from the paper (6 more)


Reference graph
Works this paper leans on
-
[1]
M., De Ruijter, W
Beal, L. M., De Ruijter, W. P., Biastoch, A. and Zahn, R. (2011) On the role of the Agulhas system in ocean circulation and climate. Nature, 472, 429--436
2011
-
[2]
(2006) Graph cuts and efficient ND image segmentation
Boykov, Y., and Funka-Lea, G. (2006) Graph cuts and efficient ND image segmentation. International Journal of Computer Vxision, 70, 109--131
2006
-
[3]
M., Demko, A
Cavole, L. M., Demko, A. M., Diner, R. E., Giddings, A., Koester, I., Pagniello, C. M. L. S., Paulsen, M.-L., Ramirez-Valdez, A., Schwenck, S. M., Yen, N. K., Zill, M. E., and Franks, P. J. S. (2016) Biological impacts of the 2013–2015 warm-water anomaly in the Northeast Pacific: Winners, losers, and the future. Oceanography, 29, 273--285
2016
-
[4]
H., Zhang, R., and Yau, C
Chan, N. H., Zhang, R., and Yau, C. Y. (2022) Inference for structural breaks in spatial models. Statistica Sinica, 32, 1961--1981
2022
-
[5]
C., Monselesan, D
Chapman, C. C., Monselesan, D. P., Risbey, J. S., Feng, M., and Sloyan, B. M. (2022) A large-scale view of marine heatwaves revealed by archetype analysis. Nature Communications, 13, 7843
2022
-
[6]
and Fryzlewicz, P
Cho, H. and Fryzlewicz, P. (2015) Multiple-change-point detection for high dimensional time series via sparsified binary segmentation. Journal of the Royal Statistical Society Series B: Statistical Methodology, 77, 475--507
2015
-
[7]
J., Good, S
Embury, O., Merchant, C. J., Good, S. A., Rayner, N. A., Høyer, J. L., Atkinson, C., Block, T., Alerskans, E., Pearson, K. J., Worsfold, M., McCarroll, N. and Donlon, C. (2024) Satellite-based time-series of sea-surface temperature since 1980 for climate applications. Scientific Data, 11, 326
2024
-
[8]
Fewings, M. R. and Brown, K. S. (2019) Regional structure in the marine heat wave of summer 2015 off the western United States. Frontiers in Marine Science, 6, 564
2019
Show all 54 references
-
[9]
T., Eckley, I
Fisch, A. T., Eckley, I. A. and Fearnhead, P. (2022) A linear time method for the detection of collective and point anomalies. Statistical Analysis and Data Mining: ASA Data Science Journal, 15, 494--508
2022
-
[10]
Fodor, G., and Conde, M. V. (2023). Rapid deforestation and burned area detection using deep multimodal learning on satellite imagery. Preprint arXiv:2307.04916
2023 arXiv
-
[11]
(2014) Wild binary segmentation for multiple change-point detection
Fryzlewicz, P. (2014) Wild binary segmentation for multiple change-point detection. Annals of Statistics, 42, 2243--2281
2014
-
[12]
and Reimherr, M
Gromenko, O., Kokoszka, P. and Reimherr, M. (2017) Detection of change in the spatiotemporal mean function. Journal of the Royal Statistical Society Series B: Statistical Methodology, 79, 29--50
2017
-
[13]
(2023) Using an anomaly detection approach for the segmentation of colorectal cancer tumors in whole slide images
Gu, Q., Meroueh, C., Levernier, J., Kroneman, T., Flotte, T., and Hart, S. (2023) Using an anomaly detection approach for the segmentation of colorectal cancer tumors in whole slide images. Journal of Pathology Informatics, 14, 100336
2023
-
[14]
(2022) Anomaly detection-inspired few-shot medical image segmentation through self-supervision with supervoxels
Hansen, S., Gautam, S., Jenssen, R., and Kampffmeyer, M. (2022) Anomaly detection-inspired few-shot medical image segmentation through self-supervision with supervoxels. Medical Image Analysis, 78, 102385
2022
-
[15]
J., Sen Gupta, A., Oliver, E
Holbrook, N. J., Sen Gupta, A., Oliver, E. C. J., Hobday, A. J., Benthuysen, J. A., Scannell, H. A., Smale, D. A. and Wernberg, T. (2020) Keeping pace with marine heatwaves. Nature Reviews Earth and Environment, 1, 482--493
2020
-
[16]
D., Barnes, D., Arabhi, S., Alt, A., Gioumousis, P., Gwin, E., Sangtrakulcharoen, P., Tan, L
Jackson, B., Scargle, J. D., Barnes, D., Arabhi, S., Alt, A., Gioumousis, P., Gwin, E., Sangtrakulcharoen, P., Tan, L. and Tsai, T. T. (2005) An algorithm for optimal partitioning of data on an interval. IEEE Transactions on Signal Processing Letters, 12, 105--108
2005
-
[17]
B., Bachman, S
Kajtar, J. B., Bachman, S. D., Holbrook, N. J. and Pilo, G. S. (2022) Drivers, dynamics, and persistence of the 2017/2018 Tasman Sea marine heatwave. Journal of Geophysical Research: Oceans, 127, e2022JC018931
2022
-
[18]
Kalantari, M., Ghezelbash, S., Ghezelbash, R., and Yaghmaei, B. (2020). Developing a fractal model for spatial mapping of crime hotspots. European Journal on Criminal Policy and Research, 26, 571--591
2020
-
[19]
Kao, H. Y. and Yu, J. Y. (2009) Contrasting eastern-Pacific and central-Pacific types of ENSO. Journal of Climate, 22, 615--632
2009
-
[20]
and Eckley, I
Killick, R., Fearnhead, P. and Eckley, I. A. (2012) Optimal detection of changepoints with a linear computational cost. Journal of the American Statistical Association, 107, 1590--1598
2012
-
[21]
and Meyer, M
Kirch, C., Klein, P. and Meyer, M. (2025) Scan statistics for the detection of anomalies in M-dependent random fields with applications to image data. Journal of the American Statistical Association, (2025): 1-20
2025
-
[22]
(2023) Seeded binary segmentation: a general methodology for fast and optimal changepoint detection
Kovács, S., Bühlmann, P., Li, H., and Munk, A. (2023) Seeded binary segmentation: a general methodology for fast and optimal changepoint detection. Biometrika , 110 , 249--256
2023
-
[23]
(1997) A spatial scan statistic
Kulldorff, M. (1997) A spatial scan statistic. Communications in Statistics-Theory and Methods , 26 , 1481--1496
1997
-
[24]
R., Willis, J
Lee, T., Hobbs, W. R., Willis, J. K., Halkides, D., Fukumori, I., Armstrong, E. M., Hayashi, A. K., Liu, W. T., Patzert, W., and Wang, O. (2010) Record warming in the South Pacific and western Antarctica associated with the strong central‐Pacific El Niño in 2009–10. Geophysica...
2010
-
[25]
L., Takahashi, K., Watkins, A
L'Heureux, M. L., Takahashi, K., Watkins, A. B., Barnston, A. G., Becker, E. J., Di Liberto, T. E., Gamble, F., Gottschalck, J., Halpert, M. S., Huang, B., Mosquera Vásquez, K. A., and Wittenberg, A. T. (2017) Observing and predicting the 2015/16 El Niño. Bulletin of the Ameri...
2017
-
[26]
Z., Wang, J
Li, X. Z., Wang, J. F., Yang, W. Z., Li, Z. J., and Lai, S. J. (2011) A spatial scan statistic for multiple clusters. Mathematical Biosciences, 233, 135--142
2011
-
[27]
(2023) A strong 2023/24 El Niño is staged by tropical Pacific Ocean heat content buildup
Lian, T., Wang, J., Chen, D., Liu, T., and Wang, D. (2023) A strong 2023/24 El Niño is staged by tropical Pacific Ocean heat content buildup. Ocean-Land-Atmosphere Research, 2, 0011
2023
-
[28]
H., Yu, Y., and Rinaldo, A
Madrid Padilla, O. H., Yu, Y., and Rinaldo, A. (2021) Lattice partition recovery with dyadic CART. Advances in Neural Information Processing Systems, 34, pp. 26143--26155
2021
-
[29]
(2017) On optimal multiple changepoint algorithms for large data
Maidstone, R., Hocking, T., Rigaill, G., and Fearnhead, P. (2017) On optimal multiple changepoint algorithms for large data. Statistics and Computing, 27, 519--533
2017
-
[30]
(2018) The 2017 record marine heatwave in the southwestern Atlantic shelf
Manta, G., de Mello, S., Trinchin, R., Badagian, J., and Barreiro, M. (2018) The 2017 record marine heatwave in the southwestern Atlantic shelf. Geophysical Research Letters, 45, 12,449--12,456
2018
-
[31]
G., Hendon, H
Marshall, A. G., Hendon, H. H., Feng, M., and Schiller, A. (2015) Initiation and amplification of the Ningaloo Niño. Climate Dynamics, 45, 2367--2385
2015
-
[32]
E., Pershing, A., Brown, C
Mills, K. E., Pershing, A., Brown, C. J., Chen, Y., Chiang, F.-S., Holland, D. S., Lehuta, S., Nye, J. A., Sun, J. C., Thomas, A. C. and Wahle, R. A. (2013) Fisheries management in a changing climate: lessons from the 2012 ocean heat wave in the Northwest Atlantic. Oceanograph...
2013
-
[33]
and Goto, H
Miyama, T., Minobe, S. and Goto, H. (2021) Marine heatwave of sea surface temperature of the Oyashio region in summer in 2010–2016. Frontiers in Marine Science, 7, 576240
2021
-
[34]
Moore, A., Chu, L., and Zhu, Z. (2025). Adaptive Block-Based Change-Point Detection for Sparse Spatially Clustered Data with Applications in Remote Sensing Imaging. Preprint arXiv:2505.21814
2025 arXiv
-
[35]
and Patti, B
Olita, A., Sorgente, R., Natale, S., Gaberšek, S., Ribotti, A., Bonanno, A. and Patti, B. (2007) Effects of the 2003 European heatwave on the Central Mediterranean Sea: surface fluxes and the dynamical response. Ocean Science, 3, 273--289
2007
-
[36]
and Wernberg, T
Oliver, E.C.J., Donat, M.G., Burrows, M.T., Moore, P.J., Smale, D.A., Alexander, L.V., Benthuysen, J.A., Feng, M., Sen Gupta, A., Hobday, A.J., Holbrook, N.J., Perkins-Kirkpatrick, S.E., Scannell, H.A., Straub, S.C. and Wernberg, T. (2018) Longer and more frequent marine heatw...
2018
-
[37]
and Sen Gupta, A
Oliver, E.C.J., Benthuysen, J.A., Darmaraki, S., Donat, M.G., Hobday, A.J., Holbrook, N.J., Schlegel, R.W. and Sen Gupta, A. (2021) Marine heatwaves. Annual Review of Marine Science, 13, 313--342
2021
-
[38]
and Taillie, C
Patil, G.P. and Taillie, C. (2003) Geographic and network surveillance via scan statistics for critical area detection. Statistical Science, 18, 457--465
2003
-
[39]
and Schleussner, C.F
Pfleiderer, P., Nath, S. and Schleussner, C.F. (2022) Extreme Atlantic hurricane seasons made twice as likely by ocean warming. Weather and Climate Dynamics, 3, 471--482
2022
-
[40]
and Brox, T
Ronneberger, O., Fischer, P. and Brox, T. (2015) U-net: convolutional networks for biomedical image segmentation. In Medical image computing and computer-assisted intervention–MICCAI 2015: 18th international conference, Munich, Germany, Oct. 5th--9th, pp. 234--241. Springer In...
2015
-
[41]
(2005) A flexibly shaped spatial scan statistic for detecting clusters
Tango, T., and Takahashi, K. (2005) A flexibly shaped spatial scan statistic for detecting clusters. International Journal of Health Geographics , 4 , 11
2005
-
[42]
(1992) Consistency results in multiple change-point problems, Ph.D
Venkatraman, E. (1992) Consistency results in multiple change-point problems, Ph.D. Thesis, Stanford University
1992
-
[43]
Verzelen, N., Fromont, M., Lerasle, M., and Reynaud-Bouret, P. (2023). Optimal change-point detection and localization. The Annals of Statistics, 51, 1586--1610
2023
-
[44]
(2024) The state of the ocean in the northeastern Atlantic and adjacent seas
von Schuckmann, K., Moreira, L., Cancet, M., Gues, F., Autret, E., Aydogdu, A., et al. (2024) The state of the ocean in the northeastern Atlantic and adjacent seas. State of the Planet, 4, 1--32
2024
-
[45]
(1981) Detection 'disorder' in multidimensional random processes
Vostrikova, L. (1981) Detection 'disorder' in multidimensional random processes. Soviet Mathematics Doklady , 24 , 55–59
1981
-
[46]
(2022) Unsupervised image anomaly detection and segmentation based on pretrained feature mapping
Wan, Q., Gao, L., Li, X., and Wen, L. (2022) Unsupervised image anomaly detection and segmentation based on pretrained feature mapping. IEEE Transactions on Industrial Informatics, 19, 2330--2339
2022
-
[47]
and Samworth, R
Wang, T. and Samworth, R. J. (2018) High dimensional change point estimation via sparse projection. Journal of the Royal Statistical Society Series B: Statistical Methodology, 80, 57--83
2018
-
[48]
and Song, M
Wang, H. and Song, M. (2011) Ckmeans.1d.dp: optimal k-means clustering in one dimension by dynamic programming. The R Journal, 3, 29--33
2011
-
[49]
and Rinaldo, A
Wang, D., Yu, Y. and Rinaldo, A. (2020) Univariate mean change point detection: Penalization, CUSUM and optimality. Electronic Journal of Statistics, 14, 1917--1961
2020
-
[50]
(1988) Estimating the number of change-points via Schwarz' criterion
Yao, Y.-C. (1988) Estimating the number of change-points via Schwarz' criterion. Statistics and Probability Letters, 6, 181--189
1988
-
[51]
and Rinaldo, A
Yu, Y., Madrid, O. and Rinaldo, A. (2022) Optimal partition recovery in general graphs. In International Conference on Artificial Intelligence and Statistics, PMLR, pp. 4339--4358
2022
-
[52]
(2010) Spatial scan statistics adjusted for multiple clusters
Zhang, Z., Assunção, R., and Kulldorff, M. (2010) Spatial scan statistics adjusted for multiple clusters. Journal of Probability and Statistics, 2010, 642379
2010
-
[53]
F., Ng, W
Zhao, Z., Ma, T. F., Ng, W. L. and Yau, C. Y. (2024) A composite likelihood-based approach for change-point detection in spatio-temporal processes. Journal of the American Statistical Association, 119, 3086--3100
2024
-
[54]
Zheng, C., Eckley, I. A. and Fearnhead, P. (2022) Consistency of a range of penalised cost approaches for detecting multiple changepoints. Electronic Journal of Statistics, 16, 4497--4546
2022
Reviewed August 4, 2026 · model on record in the stance chip above.
Discussion (0). Continue with ORCID to comment.