REVIEW 4 major objections 6 minor 2 references
Utilizing Machine Learning Models to Predict Acute Kidney Injury in Septic Patients from MIMIC-III Database
T0 review · 4 major / 6 minor · reviewed 2026-08-11 · deepseek-v4-flash
Pith's one-line read A logistic regression model with 23 features predicts acute kidney injury in septic patients with an AUC of 0.887 and outperforms five machine-learning baselines.
desk verdict The 0.887 AUC is not a prediction—the model's top features are the same measurements used to define AKI. read the letter →
The pith
A machine-rendered reading of the paper's core claim, the machinery that carries it, and where it could break.
The reading
What carries the argument
The machine is a logistic regression classifier fed by 23 features whose absolute Pearson correlation with the AKI label falls between 0.1 and 1; Synthetic Minority Over-Sampling Technique (SMOTE) balances the minority non-AKI class; and Shapley values attribute each feature's contribution to the prediction. Logistic regression carries the argument because it outputs directly interpretable, calibrated probabilities, and the paper uses its low Brier score and calibration curve to claim that the risk estimates are reliable enough for clinical use.
What would settle it
Look at the cohort-extraction code: if the AKI outcome is defined by the standard KDIGO criteria using creatinine and urine output over the same first 24 hours that supply the predictor values, then retrain the model with the outcome drawn from measurements taken 48 to 72 hours later; if the AUC falls materially below 0.887, the reported performance was inflated by label leakage.
Extended reading notes
Core claim
The central claim is that a logistic regression model with 23 features, selected by correlation magnitude from an initial set of 50, outperforms XGBoost, K-Nearest Neighbors, Support Vector Machines, Random Forest, and LightGBM for predicting AKI in septic patients, and also beats the best published model. The authors report test-set AUC 0.887 (95% CI [0.861, 0.915]), accuracy 0.817, F1 0.866, recall 0.827, and a Brier score of 0.13, with the top Shapley drivers being urine output, maximum and minimum bilirubin, weight, maximum blood urea nitrogen, and minimum estimated glomerular filtration rate. They interpret the result as evidence that a parsimonious, interpretable model can match or exceed complex algorithms for this clinical prediction task.
Load-bearing premise
The load-bearing premise is that the 23 features are known before AKI occurs and do not encode the diagnosis itself; if AKI was labeled from the same creatinine, urine output, blood urea nitrogen, and eGFR values that serve as predictors, then the high AUC mostly restates the label rather than predicting it.
Editorial extensions
If this is right
- If the AUC of 0.887 generalizes, clinicians in the ICU could screen septic patients with 23 readily available measurements and flag high-risk patients for earlier intervention.
- The small feature set lowers data-collection burden and overfitting risk, which matters when electronic health records are sparse or missing.
- The result implies that complex gradient-boosting or kernel-based models may not be necessary for this task; a calibrated linear model can suffice when paired with well-chosen features.
- If the comparison with the best existing literature holds, the field gains a simpler reference model that future AKI prediction studies need to beat.
Reading between the lines
- Editorial inference: the paper never defines how AKI was labeled or when the outcome window ends, and several predictor features (urine output, creatinine, blood urea nitrogen, and estimated glomerular filtration rate) are the same measurements normally used to define AKI; the headline AUC may therefore be inflated by label leakage.
- Editorial inference: a fair clinical test would retrain the model without renal-function features and check whether the remaining 16 features still predict AKI; if they do, the model has genuine predictive content beyond restating the diagnostic criteria.
- Editorial inference: the model was developed on a single hospital system's data, so its transferability is untested; applying the same 23-feature logistic regression to MIMIC-IV or another critical-care database would show whether the reported performance gap persists.
Signed reviews
Editorial analysis
A structured set of objections, weighed in public.
Referee Report
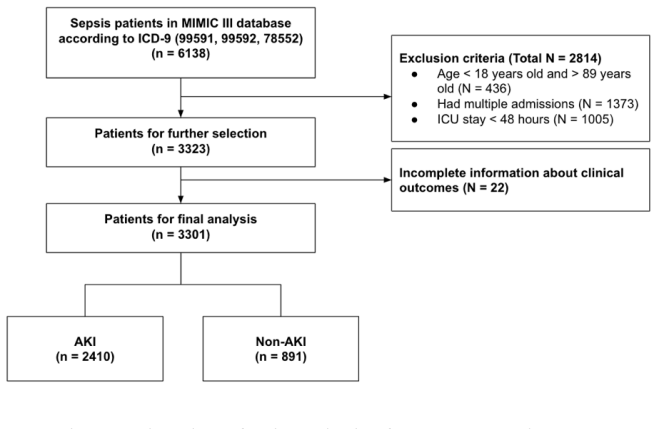
Summary. The paper develops a logistic regression model to predict acute kidney injury (AKI) in septic ICU patients using MIMIC-III data, reporting a test-set AUC of 0.887 (95% CI [0.861–0.915]), accuracy 0.817, F1 0.866, and Brier score 0.13, which it claims outperforms five baseline machine learning models and the best existing literature while using only 23 features. The features are derived from the first 24 hours after ICU admission, selected by correlation with the AKI outcome, and the data imbalance is addressed with SMOTE. The central claim is that this model provides an effective, interpretable tool for early AKI prediction in septic patients.
Significance. If the reported results were valid, the contribution would be a modest but practically useful model: a small, interpretable feature set with a transparent logistic-regression baseline, calibration assessment via Brier scores, and comparison against several common ML algorithms. The authors deserve credit for including calibration curves, confidence intervals, and Shapley-based interpretability, which are good practices in clinical prediction modeling. However, because the AKI outcome is never defined and the modeling pipeline leaks outcome information into feature selection and the training process, the reported performance is not credible, and the clinical significance cannot be assessed without a full reanalysis.
major comments (4)
- [Sections 1, 2.3, and Table 1] The AKI outcome is never defined. The paper states in Section 1 that AKI is diagnosed 'based on increased creatinine levels and a decrease in urine output,' yet the predictor set includes urine output, minimum and maximum creatinine, minimum eGFR, and BUN from the first 24 hours. Under standard KDIGO criteria, these are the same measurements used to determine the outcome, so the model is partly predicting the outcome from its own definition. The manuscript must specify the AKI definition, the observation window, the baseline-creatinine rule, and demonstrate that predictors are measured before the outcome; otherwise, the headline AUC of 0.887 may be a tautology rather than a prospective prediction.
- [Section 2.6] SMOTE is applied before the train/test/validation split. The text says 'SMOTE was added to every feature that has been selected to balance the data' and then 'The data was then split into a training, testing, and validation cohort.' Generating synthetic minority-class examples from the entire dataset means the test set is not independent of the training data, so the reported test-set AUC and all comparison metrics in Tables 4 and 5 are optimistically biased. SMOTE must be applied only within the training fold after the data split.
- [Section 2.4] Correlation-based feature selection is performed on the full 3301-patient cohort using the AKI outcome before any data split. This leaks test-set information into the choice of the 23 features, so the test-set evaluation is not an unbiased estimate of generalizable performance. The feature-selection procedure should be conducted inside the training set only, and the selected features should then be frozen before evaluating on the held-out test set.
- [Abstract and Section 3.1] The reported split proportions and sample sizes are internally inconsistent. The abstract and Section 3.1 state the data was divided into 40% training, 10% testing, and 50% validation, but the reported counts of 1980, 661, and 660 correspond to approximately 60%, 20%, and 20% of the 3301 patients. This error affects the interpretation of the headline test-set results, including the confidence intervals, and must be corrected and the analysis rerun with a properly sized held-out test set.
minor comments (6)
- [Section 2.1] The heading 'Data Souce' should be 'Data Source.'
- [Table 2] The p-value entry '¡0.0001' should be '<0.0001'.
- [Section 2.4 and Table 1] The text mentions 'minimum eGFR, maximum eGFR' among the top features, but Table 1 lists only 'Minimum Estimated Glomerular Filtration Rate (eGFR)'; please clarify which eGFR features were included.
- [Abstract and Section 4.1] The abstract says '13 fewer variables' and an '8.57% improvement,' while Section 4.1 says '13 less variables' and an '8.56% improvement'; these numbers should be unified.
- [Figure 5] The Figure 5 caption describes 'predictors' in a way that reads like a feature list, but the figure appears to be a Shapley importance plot; please revise the caption to describe what is shown.
- [Sections 1 and 5] The paper claims compliance with TRIPOD guidelines, but it does not report essential TRIPOD items such as the outcome definition, how missing data were handled across imputations, or how hyperparameters were selected; either provide a completed TRIPOD checklist or temper the claim.
Circularity Check
The 0.887 AUC is largely a tautology: urine output, creatinine, eGFR, and BUN from the first 24 hours are the same measures the paper itself cites as defining AKI, and the outcome definition/timing is never stated.
-
self definitional
[Section 1 (AKI diagnosis definition) with Section 2.4/Table 1 (feature list)]
"Currently, a prominent measure for the diagnosis of AKI is based on increased creatinine levels and a decrease in urine output. ... (xv) minimum creatinine: patient’s minimum recorded creatinine level from lab results; (xvi) maximum creatinine: patient’s maximum recorded creatinine level from lab results; ... (xix) urine output: patient’s recorded urine output; ... (xxii) minimum estimated glomerular filtration rate (eGFR): patient’s minimum recorded estimated glomerular filtration rate from lab results."
The paper never defines the AKI outcome, its index time, or its ascertainment window. Under standard KDIGO criteria, AKI is defined by a rise in creatinine or a fall in urine output, and eGFR is a direct transform of creatinine. The model therefore uses the same first-24-hour renal measurements that define the label as predictors of that label. Low urine output, high creatinine, and low eGFR separate AKI from non-AKI by construction, so the high AUC and the top SHAP features are expected even if the model has no prospective predictive content. The test-set AUC is a measure of how well the label’s own diagnostic criteria separate the two groups, not a prediction of a future event.
-
fitted input called prediction
[Section 2.4, Feature Selection]
"To determine the top features, we used a correlation-based method. We tested to see which features had an absolute value between 0.1 and 1, leaving us with the 23 most correlated features to AKI."
Feature selection is performed on the entire 3301-patient cohort using the AKI outcome label before any train/test split. The test set is then drawn from the same cohort, so the reported 0.887 AUC measures features that were selected for their direct correlation with the very outcome they are asked to predict. This is feature-selection leakage rather than an independent forecast: the selected inputs are fitted to the label, and the model's claimed predictive performance partly reflects that fit. The paper presents the resulting separation as prediction accuracy even though the feature set was chosen on the basis of the outcome.
full rationale
The paper's central claim is that a 23-feature logistic regression predicts sepsis-associated AKI with AUC 0.887. The derivation chain is: extract first-24-hour renal-function values (urine output, min/max creatinine, min eGFR, min/max BUN), label patients as AKI by an unstated criterion, fit a model on those features, and report AUC. Because the paper itself states that AKI diagnosis is based on increased creatinine and decreased urine output, and because the outcome definition and timing are never provided, the top predictors are the same measurements used to define the label. Under KDIGO, a creatinine rise or urine-output fall within the first 24 hours already constitutes AKI, so the model is separating the label's own definitional criteria, making the high AUC largely tautological. A second, secondary leakage is the outcome-correlation-based feature selection on the full cohort before splitting, which further inflates the reported performance. The SMOTE-before-split step adds additional optimism but is a methodological flaw rather than definitional circularity. No load-bearing self-citation was found: the cited prior group work (ref. 11) supports the methodology but does not supply the focal result. The 8.57% improvement over literature is also not a controlled external benchmark because the comparison model may use a different outcome definition. Overall, the central 'prediction' reduces substantially to the input definition, warranting a score of 8.
Assumptions & free parameters
free parameters (8)
- Correlation threshold |r| > 0.1 =
0.1
- Missing-value thresholds =
20% feature exclusion; rows with >11 missing values removed
- Logistic regression hyperparameters =
C=100, max_iter=200, penalty='l2'
- XGBoost hyperparameters =
objective='binary:logistic', reg_lambda=100, reg_alpha=120, max_depth=2
- KNN hyperparameters =
n_neighbors=40
- SVM hyperparameters =
C=0.1, gamma=0.02
- Random Forest hyperparameters =
n_estimators=150, max_depth=12, min_samples_split=128, min_samples_leaf=10
- LightGBM hyperparameters =
lambda_l1=1, lambda_l2=1, num_leaves=20, max_depth=4, learning_rate=0.01, n_estimators=1050
assumptions (4)
- domain assumption AKI outcome is defined by KDIGO-style criteria based on creatinine rise and urine output, and can be predicted from first-24h features that include these markers.
- domain assumption ICD-9 codes 99591, 99592, and 78552 identify the septic population of interest.
- domain assumption First-24h summary values (min/max) adequately represent the prediction window before AKI onset.
- domain assumption Multiple imputation and SMOTE produce valid synthetic data without altering test performance.
Cite this review
Pith. "Pith review of Utilizing Machine Learning Models to Predict Acute Kidney Injury in Septic Patients from MIMIC-III Database." pith.science (2026). https://pith.science/paper/BN5HOEV5
@misc{pith2026241203737,
  author       = {Pith},
  title        = {Pith review of: Utilizing Machine Learning Models to Predict Acute Kidney Injury in Septic Patients from MIMIC-III Database},
  year         = {2026},
  howpublished = {\url{https://pith.science/paper/BN5HOEV5}},
  note         = {Machine review of arXiv:2412.03737}
}
read the original abstract
Sepsis is a severe condition that causes the body to respond incorrectly to an infection. This reaction can subsequently cause organ failure, a major one being acute kidney injury (AKI). For septic patients, approximately 50% develop AKI, with a mortality rate above 40%. Creating models that can accurately predict AKI based on specific qualities of septic patients is crucial for early detection and intervention. Using medical data from septic patients during intensive care unit (ICU) admission from the Medical Information Mart for Intensive Care 3 (MIMIC-III) database, we extracted 3301 patients with sepsis, with 73% of patients developing AKI. The data was randomly divided into a training set (n = 1980, 40%), a test set (n = 661, 10%), and a validation set (n = 660, 50%). The proposed model was logistic regression, and it was compared against five baseline models: XGBoost, K Nearest Neighbors (KNN), Support Vector Machines (SVM), Random Forest (RF), and LightGBM. Area Under the Curve (AUC), Accuracy, F1-Score, and Recall were calculated for each model. After analysis, we were able to select 23 features to include in our model, the top features being urine output, maximum bilirubin, minimum bilirubin, weight, maximum blood urea nitrogen, and minimum estimated glomerular filtration rate. The logistic regression model performed the best, achieving an AUC score of 0.887 (95% CI: [0.861-0.915]), an accuracy of 0.817, an F1 score of 0.866, a recall score of 0.827, and a Brier score of 0.13. Compared to the best existing literature in this field, our model achieved an 8.57% improvement in AUC while using 13 fewer variables, showcasing its effectiveness in determining AKI in septic patients. While the features selected for predicting AKI in septic patients are similar to previous literature, the top features that influenced our model's performance differ.
Figures


Figures from the paper (3 more)


Reference graph
Works this paper leans on
-
[4]
Existing Literature Comparison Our model aims to predict acute kidney injury in septic patients
Discussion 4.1. Existing Literature Comparison Our model aims to predict acute kidney injury in septic patients. Among all the models we have trained, the proposed Logistic Regression model shows an impressive outcome with an AUC of 0.887, which is only 0.23% higher than the second best model trained, LightGBM. These results exceed the general pattern see...
work page 2023
-
[21]
Effect of a Process Mining based Pre-processing Step in Prediction of the Critical Health Outcomes
Dina Elreedy and Amir F Atiya. A comprehensive analysis of synthetic minority oversampling technique (smote) for handling class imbalance. Information Sciences, 505:32–64, 2019. 22. Xuan Song, Xinyan Liu, Fei Liu, and Chunting Wang. Comparison of machine learning and logistic regression models in predicting acute kidney injury: A systematic review and met...
work page Pith review arXiv 2019
Reviewed August 11, 2026 · model on record in the stance chip above.
Discussion (0). Continue with ORCID to comment.