REVIEW 2 major objections 6 minor 52 references
Interpretable brain age prediction using linear latent variable models of functional connectivity
T0 review · 2 major / 6 minor · reviewed 2026-08-14 · deepseek-v4-flash
Pith's one-line read For connectivity-based brain age prediction, constraining PCA-style latent variable models with non-negativity and orthonormality improves both interpretability and predictive accuracy.
desk verdict Useful internal comparison of constrained latent variable models for brain age, but the cross-dataset generalization is oversold and the novelty claim is wrong. read the letter →
The pith
A machine-rendered reading of the paper's core claim, the machinery that carries it, and where it could break.
The reading
What carries the argument
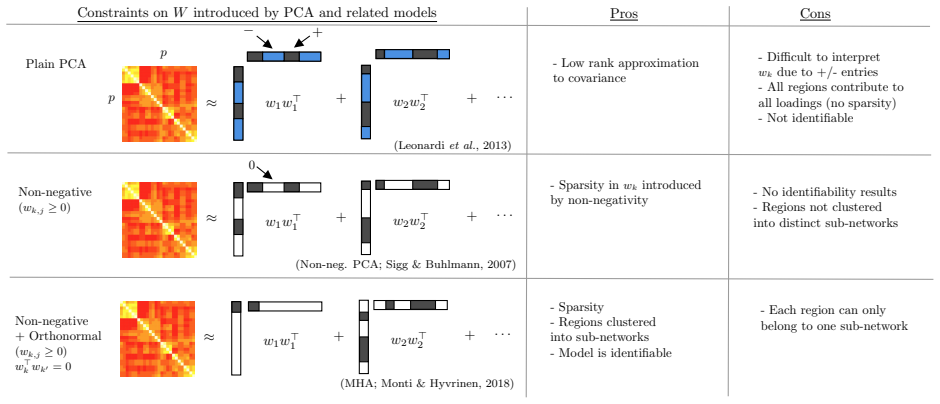
The central object is the loading matrix $W \in \mathbb{R}^{p \times k}$, whose columns define functional networks, constrained by non-negativity and orthonormality. MHA (Modular Hierarchical Analysis) is the probabilistic model that enforces both constraints and makes the decomposition identifiable; MCF (Modular Connectivity Factorization) is the related objective with the same constraints. Each subject's covariance is modelled as $\Sigma^{(i)} = \sum_j g^{(i)}_j W_j W_j^T + v^{(i)} I$, so the diagonal entries $g^{(i)}_j$ quantify the activity of network $j$ in subject $i$, and those activities become the features in the linear regression for age. The machinery converts high-dimensional connectivity matrices into a small set of non-negative, non-overlapping network scores while retaining predictive signal, which is what makes the subsequent model interpretation possible.
What would settle it
Rerun the evaluation on HCP and ATR with a trivial baseline that always predicts the mean training age; if the MHA and MCF errors do not clearly beat this baseline, the transfer-generalization claim fails. A stronger test would restrict all three datasets to a common age range and re-compare the methods on that subset.
Extended reading notes
Core claim
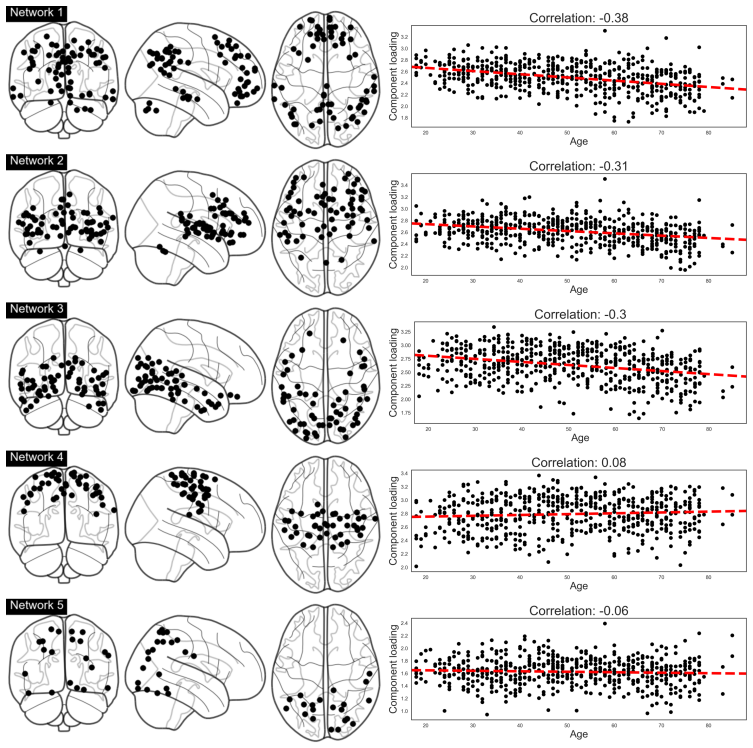
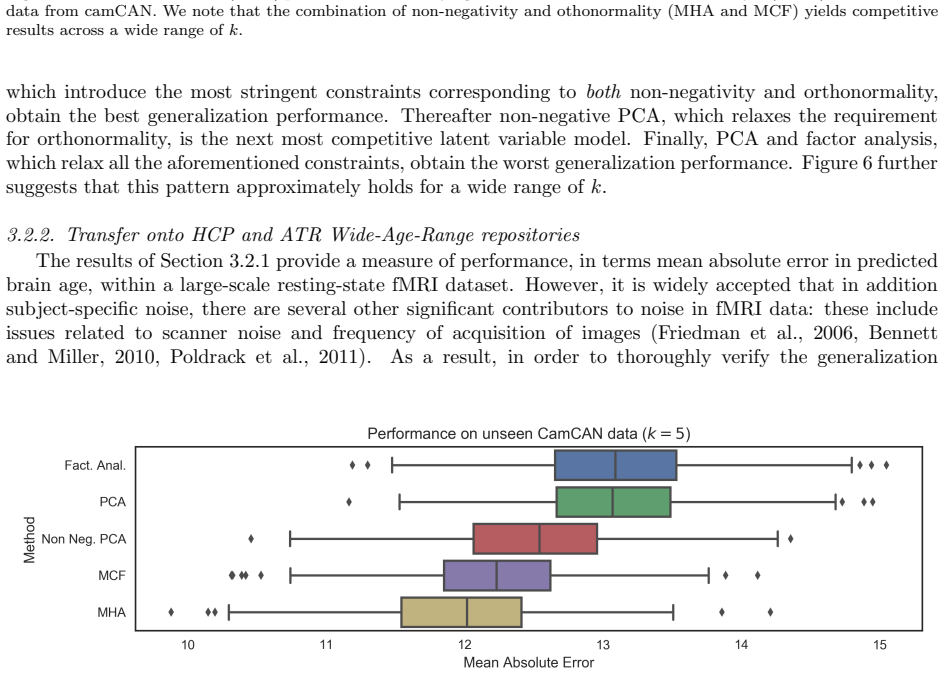
The paper claims that functional connectivity features for brain age prediction are best extracted by decomposing each subject's covariance matrix as a low-rank sum of networks, $\Sigma^{(i)} = \sum_j g^{(i)}_j W_j W_j^T + v^{(i)} I$, with the loading matrix $W$ constrained to be non-negative ($W \ge 0$) and orthonormal ($W^T W = I$). Under these constraints (the MHA and MCF models), each brain region belongs to exactly one network, the decomposition is identifiable up to trivial symmetries, and the associated network activities $g^{(i)}_j$ are more informative for linear regression than unconstrained PCA or factor analysis loadings. In experiments on 647 CamCAN participants, the constrained models produced spatially coherent, bilaterally symmetric networks matching the default mode, salience, visual, and somatomotor systems, and activity in most of these networks declined with age. Transferring the CamCAN-trained regression to HCP and ATR produced mean absolute errors of 12.71 and 12.18 years respectively, lower than all less-constrained baselines on the same held-out data.
Load-bearing premise
The transfer evaluation assumes raw mean absolute error is a meaningful measure of generalization on HCP and ATR, but on HCP (ages 22 to 37) a constant predictor would already give an error far below the reported 12.71 years, so the 'generalizes well' conclusion rests on a fragile premise.
Editorial extensions
If this is right
- Connectivity-based brain age models can be made interpretable without sacrificing accuracy, provided the feature extraction step imposes non-negativity and orthonormality.
- The inferred networks identify a concrete set of age-sensitive systems (default mode, salience, visual, and somatomotor) whose activity declines with age, giving targeted hypotheses for ageing research.
- The two-step pipeline transfers across scanners and acquisition protocols, suggesting the learned networks capture reproducible between-subject variation rather than scanner-specific artefacts.
- Because the regression is linear, each network's coefficient directly reads as the change in predicted age per unit change in network activity, enabling hypothesis-driven follow-up.
- The performance figures set a baseline for healthy subjects only; extending the same pipeline to clinical groups would require re-validation before use as a biomarker.
Reading between the lines
- The raw mean absolute error comparisons on HCP and ATR are fragile because those datasets have narrow or mid-range age distributions; a fairer evaluation would compare against an age-constant baseline, and the 'generalizes well' claim may weaken under that test.
- The same constrained decomposition could be used to compute a per-network 'brain age gap', separating which network's decline most drives an individual's predicted age acceleration.
- The identifiability of the constrained loading matrix could enable direct cross-cohort comparisons of network structure, turning brain age models into standardized connectomic atlases.
- A testable extension is to apply the pipeline to task-based fMRI or to patient groups to see whether the same networks carry the age signal when cognition or pathology changes.
Signed reviews
Editorial analysis
A structured set of objections, weighed in public.
Referee Report
Summary. The paper proposes a two-stage framework for brain-age prediction from resting-state fMRI functional connectivity. In the first stage, linear latent variable models (factor analysis, PCA, non-negative PCA, MCF, and MHA) are used to learn a shared loading matrix W whose columns are interpreted as functional connectivity networks; subject-specific network activities are then used as features in a linear regression to predict age. The framework is trained and validated on CamCAN, with the number of factors k selected by validation likelihood, and the fitted model is transferred without retraining to HCP and ATR Wide-Age-Range data. The central claim is that introducing non-negativity and orthonormality constraints improves both interpretability and predictive performance, with MHA and MCF reported as the best-performing methods on all three repositories.
Significance. If the central claims hold, the paper would contribute a transparent, interpretable approach to brain-age modeling from functional connectivity, with the inferred networks (e.g., default mode, salience, visual, somatomotor) offering neurobiological insight. The manuscript has several strengths: the method is clearly described; the choice of k using validation likelihood without using age labels is a sensible safeguard against circularity; the CamCAN internal comparison across latent-variable models is a useful empirical contribution; and the synthetic experiments, while favorable to the constrained models, are explicitly presented as a numerical validation of the estimation procedure. The cross-dataset transfer design (training only on CamCAN) is also commendable. However, the external generalization evidence is currently under-analyzed: the raw MAE values on HCP and ATR are not compared with trivial baselines, which is essential because the age ranges of those datasets are narrow or uneven.
major comments (2)
- [Section 3.2.2, Table 1] The cross-dataset generalization claim is not evaluated against trivial baselines. On HCP, ages span only 22–37 years, so a constant predictor returning the mean age of the HCP sample would achieve an MAE equal to the mean absolute deviation of that age distribution, roughly 2–4 years (approximately 3.75 years even under a uniform assumption), whereas the reported MHA MAE is 12.71 years. On ATR, ages span 20–70 years, where a constant predictor would achieve an MAE of about 12.5 years under a uniform age distribution, essentially equal to the reported MHA value of 12.18 years. The raw MAEs therefore do not demonstrate that the models encode age-related connectivity; they are equally consistent with predictions that are nearly constant or driven by dataset-specific offsets. This undermines the abstract's and Section 4's claims that the models 'generalize well' to unseen repositories and that constraints improve predictive performance on those data.
- [Section 3.2.2, Figures 8–9] The conclusion that MHA and MCF show the 'smallest drop' in performance and thereby generalize best is based on absolute MAE differences that are small relative to the age-range baseline. For example, on ATR the difference between MHA (12.18) and factor analysis (13.40) is about 1.2 years, while the constant-predictor baseline is about 12.5 years; on HCP the MAE values exceed the entire age range of the dataset. Without reporting the correlation between predicted and true age (or R²) on HCP and ATR, or explicitly comparing against a mean-age predictor, the relative ordering of methods could reflect calibration or dataset-specific offsets rather than age-related predictive signal. The authors should either add these baselines and calibration analyses to support the transfer claim, or substantially weaken the generalization claim and restrict the predictive-performance conclusion to the internal CamCAN comparison.
minor comments (6)
- [Section 1] The word 'conncetivity' appears in the second paragraph of the introduction and should be corrected to 'connectivity'.
- [Acknowledgments] The sentence 'The authors with to thank Steve Smith' should read 'wish to thank'.
- [Figure 6 caption] The word 'othonormality' in the caption is a typo and should be 'orthonormality'.
- [Section 2.3 and Section 3.2.1] The hyper-parameter k is fixed to 5 for all models even though the authors note that the optimal k may differ across models; a sentence explaining why this fixed choice is appropriate for the cross-model comparison would be helpful.
- [Table 1 caption] The caption states that bracketed values are standard deviations, but it would be clearer to specify that these are standard deviations across the 1000 random subsets of 30 subjects, not across the subjects within a dataset.
- [Section 3.1.1] The sentence 'This is a phenomenon is also observed in the real data analysis' contains a grammatical error ('This is a phenomenon is') and should be rephrased.
Circularity Check
No significant circularity: the brain-age pipeline is fit on CamCAN training data and tested on held-out subjects and two external datasets, so the reported predictions are not fitted values renamed as predictions.
full rationale
The two-stage procedure is a standard, non-circular pipeline: the loading matrix W and subject-level factor loadings are estimated from CamCAN training subjects, the linear age-regression is fit on the same training split, and all reported MAE values (CamCAN test, HCP, ATR) are produced with fixed parameters on data not used for fitting. The comparison showing MHA/MCF outperform PCA and factor analysis is an empirical result on held-out data rather than a consequence of how the methods are defined; the synthetic experiments are explicitly generated from the assumed model as simulation checks. The only self-citation is the MHA identifiability/uniqueness result from Monti and Hyvärinen (2018), which is a mathematical background justification for interpretability and is not used to fabricate the predictive comparisons. The lack of trivial baselines for the HCP/ATR absolute MAEs is a legitimate external-validity concern but is not circularity, since the HCP and ATR predictions are genuinely out-of-sample. No equation is defined in terms of its own output, and no fitted parameter is presented as a free prediction.
Assumptions & free parameters
free parameters (4)
- k (number of latent factors) =
5
- Per-subject noise variance v(i) =
estimated per subject
- Factor variances G(i) =
estimated per subject
- Regression coefficients beta =
fitted on CamCAN training data
assumptions (4)
- domain assumption fMRI observations are Gaussian with covariance decomposable as W G(i) W^T + v(i) I (Equation 3).
- domain assumption The Power 264-region parcellation defines the functional nodes; connectivity is estimated via sample covariance over the full resting-state time course.
- standard math MHA's identifiability and network clustering properties (Monti and Hyvarinen, 2018) are assumed.
- domain assumption Age-specific preprocessing differences across CamCAN, HCP, and ATR do not dominate the connectivity signal.
Cite this review
Pith. "Pith review of Interpretable brain age prediction using linear latent variable models of functional connectivity." pith.science (2026). https://pith.science/paper/BRCTYTXV
@misc{pith2026190801555,
  author       = {Pith},
  title        = {Pith review of: Interpretable brain age prediction using linear latent variable models of functional connectivity},
  year         = {2026},
  howpublished = {\url{https://pith.science/paper/BRCTYTXV}},
  note         = {Machine review of arXiv:1908.01555}
}
read the original abstract
Neuroimaging-driven prediction of brain age, defined as the predicted biological age of a subject using only brain imaging data, is an exciting avenue of research. In this work we seek to build models of brain age based on functional connectivity while prioritizing model interpretability and understanding. This way, the models serve to both provide accurate estimates of brain age as well as allow us to investigate changes in functional connectivity which occur during the ageing process. The methods proposed in this work consist of a two-step procedure: first, linear latent variable models, such as PCA and its extensions, are employed to learn reproducible functional connectivity networks present across a cohort of subjects. The activity within each network is subsequently employed as a feature in a linear regression model to predict brain age. The proposed framework is employed on the data from the CamCAN repository and the inferred brain age models are further demonstrated to generalize using data from two open-access repositories: the Human Connectome Project and the ATR Wide-Age-Range.
Figures


Figures from the paper (7 more)





Reference graph
Works this paper leans on
- [1]
-
[2]
A. Athreya, D. E. Fishkind, M. Tang, C. E. Priebe, Y. Park, J. T. Vogelstein, K. Levin, V. Lyzinski, and Y. Qin. Statistical inference on random dot product graphs: a survey. The Journal of Machine Learning Research, 18 0 (1): 0 8393--8484, 2017
work page 2017
-
[3]
C. M. Bennett and M. B. Miller. How reliable are the results from functional magnetic resonance imaging? Annals of the New York Academy of Sciences, 1191 0 (1): 0 133--155, 2010
work page 2010
-
[4]
D. P. Bertsekas. Constrained optimization and Lagrange multiplier methods . Academic Press, 2014
work page 2014
-
[5]
C. M. Bishop. Pattern recognition and machine learning. springer, 2006
2006
-
[6]
V. D. Calhoun, R. Miller, G. Pearlson, and T. Adal . The chronnectome: time-varying connectivity networks as the next frontier in f M R I data discovery. Neuron, 84 0 (2): 0 262--274, 2014
work page 2014
- [7]
-
[8]
J. H. Cole and K. Franke. Predicting age using neuroimaging: innovative brain ageing biomarkers. Trends in neurosciences, 40 0 (12): 0 681--690, 2017
work page 2017
Show all 52 references
-
[9]
J. H. Cole, R. Leech, D. J. Sharp, and A. D. N. Initiative. Prediction of brain age suggests accelerated atrophy after traumatic brain injury. Annals of neurology, 77 0 (4): 0 571--581, 2015
2015
-
[10]
J. H. Cole, R. P. Poudel, D. Tsagkrasoulis, M. W. Caan, C. Steves, T. D. Spector, and G. Montana. Predicting brain age with deep learning from raw imaging data results in a reliable and heritable biomarker. NeuroImage, 163: 0 115--124, 2017
2017
-
[11]
J. H. Cole, S. J. Ritchie, M. E. Bastin, M. V. Hern \'a ndez, S. M. Maniega, N. Royle, J. Corley, A. Pattie, S. E. Harris, Q. Zhang, et al. Brain age predicts mortality. Molecular psychiatry, 23 0 (5): 0 1385, 2018
2018
-
[12]
H. R. Cremers, T. D. Wager, and T. Yarkoni. The relation between statistical power and inference in f M R I . PloS one, 12 0 (11): 0 e0184923, 2017
2017
-
[13]
J. S. Damoiseaux, K. E. Prater, B. L. Miller, and M. D. Greicius. Functional connectivity tracks clinical deterioration in Alzheimer's disease . Neurobiol. Aging, 33 0 (4), 2012. doi:10.1016/j.neurobiolaging.2011.06.024
2012 doi
-
[14]
N. U. Dosenbach, B. Nardos, A. L. Cohen, D. A. Fair, J. D. Power, J. A. Church, S. M. Nelson, G. S. Wig, A. C. Vogel, C. N. Lessov-Schlaggar, et al. Prediction of individual brain maturity using f M R I . Science, 329 0 (5997): 0 1358--1361, 2010
2010
-
[15]
Franke, G
K. Franke, G. Ziegler, S. Kl \"o ppel, C. Gaser, A. D. N. Initiative, et al. Estimating the age of healthy subjects from t1-weighted M R I scans using kernel methods: exploring the influence of various parameters. Neuroimage, 50 0 (3): 0 883--892, 2010
2010
-
[16]
Franke, C
K. Franke, C. Gaser, B. Manor, and V. Novak. Advanced brainage in older adults with type 2 diabetes mellitus. Frontiers in aging neuroscience, 5: 0 90, 2013
2013
-
[17]
Friedman, G
L. Friedman, G. H. Glover, F. Consortium, et al. Reducing interscanner variability of activation in a multicenter f M R I study: controlling for signal-to-fluctuation-noise-ratio (sfnr) differences. Neuroimage, 33 0 (2): 0 471--481, 2006
2006
-
[18]
Geerligs, R
L. Geerligs, R. J. Renken, E. Saliasi, N. M. Maurits, and M. M. Lorist. A brain-wide study of age-related changes in functional connectivity. Cerebral cortex, 25 0 (7): 0 1987--1999, 2014
1987
-
[19]
Geerligs, M
L. Geerligs, M. Rubinov, R. N. Henson, et al. State and trait components of functional connectivity: individual differences vary with mental state. Journal of Neuroscience, 35 0 (41): 0 13949--13961, 2015
2015
-
[20]
Geerligs, K
L. Geerligs, K. A. Tsvetanov, and R. N. Henson. Challenges in measuring individual differences in functional connectivity using f M R I : the case of healthy aging. Human brain mapping, 38 0 (8): 0 4125--4156, 2017
2017
-
[21]
Geerligs et al
L. Geerligs et al. Reduced specificity of functional connectivity in the aging brain during task performance. Human Brain Mapping, 35: 0 319--330, 2012
2012
-
[22]
C. D. Good, I. S. Johnsrude, J. Ashburner, R. N. Henson, K. J. Friston, and R. S. Frackowiak. A voxel-based morphometric study of ageing in 465 normal adult human brains. Neuroimage, 14 0 (1): 0 21--36, 2001
2001
-
[23]
Grady, S
C. Grady, S. Sarraf, C. Saverino, and K. Campbell. Age differences in the functional interactions among the default, frontoparietal control, and dorsal attention networks. Neurobiology of aging, 41: 0 159--172, 2016
2016
-
[24]
H. H. Harman. Modern Factor Analysis. Univ. of Chicago Press, 1960
1960
-
[25]
Hirayama, A
J. Hirayama, A. Hyv \"a rinen, V. Kiviniemi, M. Kawanabe, and O. Yamashita. Characterizing variability of modular brain connectivity with constrained principal component analysis. PloS one, 11 0 (12): 0 e0168180, 2016
2016
-
[26]
Hotelling
H. Hotelling. Analysis of a complex of statistical variables into principal components. Journal of educational psychology, 24 0 (6): 0 417, 1933
1933
-
[27]
Hyv \" a rinen, J
A. Hyv \" a rinen, J. I. Hirayama, V. Kiviniemi, and M. Kawanabe. Orthogonal Connectivity Factorization: Interpretable Decomposition of Variability in Correlation Matrices . Neural Comput., 28 0 (3): 0 445--484, 2016
2016
-
[28]
Jolliffe
I. Jolliffe. Principal component analysis. Springer, 2011
2011
-
[29]
Kelly, B
C. Kelly, B. B. Biswal, R. C. Craddock, F. X. Castellanos, and M. P. Milham. Characterizing variation in the functional connectome: promise and pitfalls. Trends in cognitive sciences, 16 0 (3): 0 181--188, 2012
2012
-
[30]
o ssler, H.-J. M \
N. Koutsouleris, C. Davatzikos, S. Borgwardt, C. Gaser, R. Bottlender, T. Frodl, P. Falkai, A. Riecher-R \"o ssler, H.-J. M \"o ller, M. Reiser, et al. Accelerated brain aging in S chizophrenia and beyond: a neuroanatomical marker of psychiatric disorders. Schizophrenia bullet...
2013
-
[31]
Lancaster, R
J. Lancaster, R. Lorenz, R. Leech, and J. H. Cole. Bayesian optimization for neuroimaging pre-processing in brain age classification and prediction. Frontiers in aging neuroscience, 10: 0 28, 2018
2018
-
[32]
Leonardi, J
N. Leonardi, J. Richiardi, M. Gschwind, S. Simioni, J. M. Annoni, M. Schluep, P. Vuilleumier, and D. Van De Ville . Principal components of functional connectivity: A new approach to study dynamic brain connectivity during rest . Neuroimage, 83: 0 937--950, 2013
2013
-
[33]
F. Liem, L. Geerligs, J. S. Damoiseaux, and D. S. Margulies. Functional connectivity in aging, 2019
2019
-
[34]
S. Lim, C. E. Han, P. J. Uhlhaas, and M. Kaiser. Preferential detachment during human brain development: age-and sex-specific structural connectivity in diffusion tensor imaging (dti) data. Cerebral Cortex, 25 0 (6): 0 1477--1489, 2013
2013
-
[35]
R. P. Monti and A. Hyv \" a rinen. A Unified Probabilistic Model for Learning Latent Factors and Their Connectivities from High-Dimensional Data . In Conf. Uncertain. Artif. Intell., 2018
2018
-
[36]
R. P. Monti, P. Hellyer, D. Sharp, R. Leech, C. Anagnostopoulos, and G. Montana. Estimating time-varying brain connectivity networks from functional M R I time series. NeuroImage, 103: 0 427--443, 2014
2014
-
[37]
R. P. Monti, R. Lorenz, R. M. Braga, C. Anagnostopoulos, R. Leech, and G. Montana. Real-time estimation of dynamic functional connectivity networks. Human brain mapping, 38 0 (1): 0 202--220, 2017 a
2017
-
[38]
R. P. Monti, R. Lorenz, P. Hellyer, R. Leech, C. Anagnostopoulos, and G. Montana. Decoding time-varying functional connectivity networks via linear graph embedding methods. Frontiers in computational neuroscience, 11: 0 14, 2017 b
2017
-
[39]
Ogawa, T
T. Ogawa, T. Aihara, T. Shimokawa, and O. Yamashita. Large-scale brain network associated with creative insight: combined voxel-based morphometry and resting-state functional connectivity analyses. Scientific reports, 8 0 (1): 0 6477, 2018
2018
-
[40]
R. A. Poldrack, J. A. Mumford, and T. E. Nichols. Handbook of functional MRI data analysis. Cambridge University Press, 2011
2011
-
[41]
J. D. Power, A. L. Cohen, S. M. Nelson, G. S. Wig, K. A. Barnes, J. A. Church, A. C. Vogel, T. O. Laumann, F. M. Miezin, B. L. Schlaggar, et al. Functional network organization of the human brain. Neuron, 72 0 (4): 0 665--678, 2011
2011
-
[42]
Raz and K
N. Raz and K. M. Rodrigue. Differential aging of the brain: patterns, cognitive correlates and modifiers. Neuroscience & Biobehavioral Reviews, 30 0 (6): 0 730--748, 2006
2006
-
[43]
Salimi-Khorshidi, G
G. Salimi-Khorshidi, G. Douaud, C. F. Beckmann, M. F. Glasser, L. Griffanti, and S. M. Smith. Automatic denoising of functional M R I data: combining independent component analysis and hierarchical fusion of classifiers. Neuroimage, 90: 0 449--468, 2014
2014
-
[44]
C. D. Sigg and J. M. Buhmann. Expectation-maximization for sparse and non-negative P C A . In Proceedings of the 25th international conference on Machine learning, pages 960--967. ACM, 2008
2008
-
[45]
S. M. Smith. The future of f M R I connectivity. Neuroimage, 62 0 (2): 0 1257--1266, 2012
2012
-
[46]
S. M. Smith, M. Jenkinson, M. W. Woolrich, C. F. Beckmann, T. E. Behrens, H. Johansen-Berg, P. R. Bannister, M. De Luca, I. Drobnjak, D. E. Flitney, et al. Advances in functional and structural M R image analysis and implementation as F S L . Neuroimage, 23: 0 S208--S219, 2004
2004
-
[47]
S. M. Smith, D. Vidaurre, F. Alfaro-Almagro, T. E. Nichols, and K. L. Miller. Estimation of brain age delta from brain imaging. NeuroImage, 2019
2019
-
[48]
O. Sporns. Discovering the human connectome. MIT press, 2012
2012
-
[49]
Taylor, N
J. Taylor, N. Williams, R. Cusack, T. Auer, M. Shafto, M. Dixon, L. Tyler, and Cam-CAN. The C ambridge C entre for A geing and N euroscience ( C am- C A N ) data repository: structural and functional M R I , M E G , and cognitive data from a cross-sectional adult lifespan samp...
2015
-
[50]
D. C. Van Essen, S. M. Smith, D. M. Barch, T. E. Behrens, E. Yacoub, K. Ugurbil, W.-M. H. Consortium, et al. The W U - M inn H uman C onnectome P roject: an overview. Neuroimage, 80: 0 62--79, 2013
2013
-
[51]
T. Wu, L. Wang, Y. Chen, C. Zhao, K. Li, and P. Chan. Changes of functional connectivity of the motor network in the resting state in Parkinson's disease . Neurosci. Lett., 460 0 (1): 0 6--10, 2009. doi:10.1016/j.neulet.2009.05.046
2009 doi
-
[52]
Zass and A
R. Zass and A. Shashua. Non-negative sparse P C A . In Advances in Neural Information Processing Systems, pages 1561--1568, 2007
2007
Reviewed August 14, 2026 · model on record in the stance chip above.
Discussion (0). Continue with ORCID to comment.