A penalized distributed lag non-linear Lee-Carter framework for regional weekly mortality forecasting
Pith reviewed 2026-05-22 13:03 UTC · model grok-4.3
The pith
An extended Lee-Carter model with penalized distributed lag terms for heat, cold and influenza improves accuracy in regional weekly mortality forecasts.
A machine-rendered reading of the paper's core claim, the machinery that carries it, and where it could break.
Core claim
By adding penalized distributed lag non-linear components to the Lee-Carter model together with age- and region-specific seasonal effects, the framework captures the delayed and non-linear effects of heat, cold, and influenza on mortality. Temporal dynamics of the latent factors are modeled with SARIMA processes and cross-regional dependencies are captured through copulas, while a negative binomial distribution handles overdispersion. Applied to regional French mortality data from 1990-2019, the approach produces well-calibrated forecast distributions, improves predictive accuracy relative to benchmark models, and reveals substantial heterogeneity in temperature- and influenza-related risks.
What carries the argument
Penalized distributed lag non-linear components that recover the delayed and non-linear effects of heat, cold, and influenza on mortality, integrated into the Lee-Carter structure for age- and region-specific modeling.
Load-bearing premise
The chosen penalty tuning and lag structure in the distributed lag non-linear components correctly recover the true delayed and non-linear effects of heat, cold, and influenza without bias from post-hoc selection or overfitting to the 1990-2019 French data.
What would settle it
Generating forecasts for a later period such as 2020-2023 and checking whether the predicted probability distributions match the observed weekly death counts, or whether the estimated temperature-mortality relative risk curves align with independent epidemiological evidence, would test the calibration and the non-linear component.
Figures


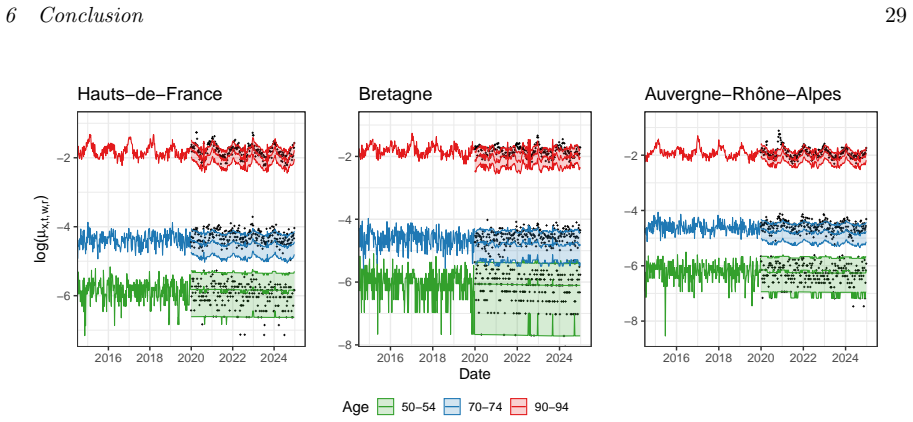
read the original abstract
Accurate forecasts of weekly mortality are essential for public health and the insurance industry. We develop a forecasting framework that extends the Lee-Carter model with age- and region-specific seasonal effects and penalized distributed lag non-linear components that capture the delayed and non-linear effects of heat, cold, and influenza on mortality. The model accommodates overdispersed mortality rates via a negative binomial distribution. We model the temporal dynamics of the latent factors in the model using SARIMA processes and capture cross-regional dependencies through a copula-based approach. Using regional French mortality data (1990-2019), we demonstrate that the proposed framework yields well-calibrated forecast distributions and improves predictive accuracy relative to benchmark models. The results further show substantial heterogeneity in temperature- and influenza-related relative risks between ages and regions. These findings underscore the importance of incorporating exogenous drivers and dependence structures into a weekly mortality forecasting framework.
Editorial analysis
A structured set of objections, weighed in public.
Referee Report
Summary. The manuscript develops a penalized distributed lag non-linear extension of the Lee-Carter model for regional weekly mortality forecasting. It adds age- and region-specific seasonal effects, penalized DLNM terms to capture delayed and non-linear impacts of heat, cold, and influenza, a negative binomial likelihood for overdispersion, SARIMA dynamics on the latent factors, and a copula to model cross-regional dependence. Applied to French regional mortality data 1990–2019, the authors claim that the framework produces well-calibrated forecast distributions, improves predictive accuracy relative to benchmark models, and reveals substantial heterogeneity in temperature- and influenza-related relative risks across ages and regions.
Significance. If the central claims hold after proper validation, the work would meaningfully advance applied mortality forecasting by integrating exogenous drivers and spatial dependence into a weekly, regional Lee-Carter framework. The combination of DLNM penalties with copula dependence structures addresses a recognized gap in short-term public-health forecasting.
major comments (2)
- [Methods (DLNM specification)] Methods section on the penalized DLNM components: the description of penalty-parameter tuning, lag order, and knot placement does not specify whether selection was performed via nested cross-validation on held-out periods or on the full 1990–2019 dataset. Without this detail the claim that the DLNM terms recover unbiased delayed and non-linear effects of temperature and influenza cannot be evaluated, directly threatening the reported forecast calibration and accuracy gains.
- [Results (forecast evaluation)] Results and validation: the abstract asserts well-calibrated forecast distributions and accuracy improvements, yet the manuscript provides no explicit hold-out period, rolling-window scheme, or proper scoring-rule comparison that isolates the contribution of the DLNM and copula terms from the high-dimensional regional/age structure. This omission leaves open the possibility that reported gains are inflated by overfitting.
minor comments (1)
- [Abstract] The abstract would benefit from a concise quantitative statement of the accuracy improvement (e.g., percentage reduction in CRPS or log-score relative to the best benchmark).
Simulated Author's Rebuttal
We thank the referee for their constructive and detailed comments, which highlight important aspects of methodological transparency and validation rigor. We address each major comment below and commit to revisions that strengthen the manuscript without altering its core contributions.
read point-by-point responses
-
Referee: Methods section on the penalized DLNM components: the description of penalty-parameter tuning, lag order, and knot placement does not specify whether selection was performed via nested cross-validation on held-out periods or on the full 1990–2019 dataset. Without this detail the claim that the DLNM terms recover unbiased delayed and non-linear effects of temperature and influenza cannot be evaluated, directly threatening the reported forecast calibration and accuracy gains.
Authors: We agree that explicit documentation of the hyperparameter selection process is essential for evaluating the DLNM effects. In the original analysis, penalty parameters, lag orders, and knot placements were determined via grid search and cross-validation on the full 1990–2019 dataset, following standard DLNM practice for stable effect estimation. To address the referee's concern, we will revise the Methods section to describe this procedure in detail, discuss its implications for potential optimism bias in effect recovery, and add a sensitivity analysis using time-series nested cross-validation on held-out periods. This will allow readers to better assess the unbiasedness of the reported temperature and influenza effects. revision: yes
-
Referee: Results and validation: the abstract asserts well-calibrated forecast distributions and accuracy improvements, yet the manuscript provides no explicit hold-out period, rolling-window scheme, or proper scoring-rule comparison that isolates the contribution of the DLNM and copula terms from the high-dimensional regional/age structure. This omission leaves open the possibility that reported gains are inflated by overfitting.
Authors: We acknowledge that the validation procedures require clearer exposition to rule out overfitting concerns. The manuscript employs a rolling-window forecasting evaluation with held-out periods in the later years of the sample, but the description was not sufficiently detailed. In the revision, we will expand the Results section to explicitly document the hold-out scheme, rolling-window implementation, and use of proper scoring rules such as the Continuous Ranked Probability Score (CRPS) and logarithmic score. We will also include ablation experiments comparing the full model to reduced versions without the DLNM components and without the copula, thereby isolating their specific contributions beyond the regional/age structure. revision: yes
Circularity Check
No significant circularity in the modeling framework
full rationale
The paper constructs an extended Lee-Carter model by adding age- and region-specific seasonal effects, penalized distributed lag non-linear (DLNM) terms for temperature and influenza, negative binomial overdispersion, SARIMA dynamics on latent factors, and a copula for cross-regional dependence. These components are introduced as independent modeling choices drawn from established statistical literature rather than derived from the target forecasts or fitted parameters. The empirical demonstration on 1990-2019 French regional data then evaluates predictive accuracy and heterogeneity against benchmarks; no equation reduces a claimed prediction or uniqueness result to a quantity defined solely by the same fitted values or by a self-citation chain. The derivation chain therefore remains self-contained and externally falsifiable.
Axiom & Free-Parameter Ledger
free parameters (2)
- penalty parameters for DLNM
- lag order and knot placement
axioms (3)
- domain assumption Mortality counts are adequately described by a negative binomial distribution
- domain assumption Latent temporal factors follow SARIMA processes
- domain assumption Cross-regional dependence can be captured by a copula
Lean theorems connected to this paper
-
IndisputableMonolith/Cost/FunctionalEquation.leanwashburn_uniqueness_aczel unclear?
unclearRelation between the paper passage and the cited Recognition theorem.
We model the non-linear and delayed effects of temperature and influenza on mortality in Eq. (3.2) using a distributed lag non-linear model (DLNM). ... fr(ξt,w,r) = Σℓ Σj Σk ηjk,r · bj(ξt,w−ℓ,r)·ck(ℓ)
-
IndisputableMonolith/Foundation/AlexanderDuality.leanalexander_duality_circle_linking unclear?
unclearRelation between the paper passage and the cited Recognition theorem.
To reduce model complexity and enforce spatial coherence ... we introduce the Laplacian matrix L ... lp(θ;ψ1,ψ2) = lnb(θ) − (ψ1/2) Σ η′1,q L η1,q − (ψ2/2) Σ η′2,q L η2,q
What do these tags mean?
- matches
- The paper's claim is directly supported by a theorem in the formal canon.
- supports
- The theorem supports part of the paper's argument, but the paper may add assumptions or extra steps.
- extends
- The paper goes beyond the formal theorem; the theorem is a base layer rather than the whole result.
- uses
- The paper appears to rely on the theorem as machinery.
- contradicts
- The paper's claim conflicts with a theorem or certificate in the canon.
- unclear
- Pith found a possible connection, but the passage is too broad, indirect, or ambiguous to say the theorem truly supports the claim.
Reference graph
Works this paper leans on
-
[2]
barnett2010measure APACrefauthors Barnett, A. APACrefauthors \ 2010 . What measure of temperature is the best predictor of mortality? What measure of temperature is the best predictor of mortality? Environmental Research 110 6 604--611 . APACrefDOI doi:10.1097/01.ede.0000362214.90491.53 APACrefDOI
-
[3]
beginmodelling APACrefauthors B \'e gin, J F. , Boudreault, M. \ Landry, T. APACrefauthors \ 2025 . Modelling seasonal mortality: An age--period--cohort approach. Modelling seasonal mortality: An age--period--cohort approach. Preprint at https://www.researchgate.net/publication/391576373_Modelling_seasonal_mortality_An_age-period-cohort_approach
-
[4]
brouhns2005bootstrapping APACrefauthors Brouhns, N. , Denuit, M. \ Van Keilegom, I. APACrefauthors \ 2005 . Bootstrapping the P oisson log-bilinear model for mortality forecasting Bootstrapping the P oisson log-bilinear model for mortality forecasting . Scandinavian Actuarial Journal 2005 3 212--224 . APACrefDOI doi:10.1080/03461230510009754 APACrefDOI
-
[5]
brouhns2002measuring APACrefauthors Brouhns, N. , Denuit, M. \ Vermunt, J K. APACrefauthors \ 2002 . Measuring the longevity risk in mortality projections Measuring the longevity risk in mortality projections \ ( 2). Staempfli Verlag AG . Preprint at https://research.tilburguniversity.edu/files/510433/brouhns2002.PDF
work page 2002
-
[6]
nasadataset APACrefauthors Center for International Earth Science Information Network -- CIESIN -- Columbia University . APACrefauthors \ 2018 . Gridded Population of the World, Version 4 ( GPWv4 ): Population Count, Revision 11. Gridded population of the world, version 4 ( GPWv4 ): Population count, revision 11. Palisades, New York: NASA Socioeconomic Da...
-
[7]
chaves2023global APACrefauthors Chaves, S S. , Nealon, J. , Burkart, K G. , Modin, D. , Biering-S rensen, T. , Ortiz, J R. others APACrefauthors \ 2023 . Global, regional and national estimates of influenza-attributable ischemic heart disease mortality Global, regional and national estimates of influenza-attributable ischemic heart disease mortality . ECl...
-
[8]
cds APACrefauthors Copernicus Climate Change Service, Climate Data Store . APACrefauthors \ 2020 . E-OBS daily gridded meteorological data for E urope from 1950 to present derived from in-situ observations. E-OBS daily gridded meteorological data for E urope from 1950 to present derived from in-situ observations. Copernicus Climate Change Service (C3S) Cl...
-
[9]
delwarde2007negative APACrefauthors Delwarde, A. , Denuit, M. \ Partrat, C. APACrefauthors \ 2007 . Negative binomial version of the L ee-- C arter model for mortality forecasting Negative binomial version of the L ee-- C arter model for mortality forecasting . Applied Stochastic Models in Business and Industry 23 5 385--401 . APACrefDOI doi:10.1002/asmb....
-
[10]
fernandez2015seasonal APACrefauthors Fern \'a ndez-Dur \'a n, J J. \ Gregorio-Dom \' nguez, M M. APACrefauthors \ 2015 . Seasonal mortality for fractional ages in short term life insurance Seasonal mortality for fractional ages in short term life insurance . Scandinavian Actuarial Journal 2015 3 266--277 . APACrefDOI doi:10.1080/03461238.2013.819028 APACrefDOI
-
[11]
gasparrini2011impact APACrefauthors Gasparrini, A. \ Armstrong, B. APACrefauthors \ 2011 . The impact of heat waves on mortality The impact of heat waves on mortality . Epidemiology 22 1 68 . APACrefDOI doi:10.1097/EDE.0b013e3181fdcd99 APACrefDOI
-
[12]
gasparrini2010distributed APACrefauthors Gasparrini, A. , Armstrong, B. \ Kenward, M G. APACrefauthors \ 2010 . Distributed lag non-linear models Distributed lag non-linear models . Statistics in Medicine 29 21 2224--2234 . APACrefDOI doi:10.1002/sim.3940 APACrefDOI
-
[13]
gasparrini2015mortality APACrefauthors Gasparrini, A. , Guo, Y. , Hashizume, M. , Lavigne, E. , Zanobetti, A. , Schwartz, J. Armstrong, B. APACrefauthors \ 2015 . Mortality risk attributable to high and low ambient temperature: A multicountry observational study Mortality risk attributable to high and low ambient temperature: A multicountry observational ...
-
[14]
gneiting2007strictly APACrefauthors Gneiting, T. \ Raftery, A E. APACrefauthors \ 2007 . Strictly proper scoring rules, prediction, and estimation Strictly proper scoring rules, prediction, and estimation . Journal of the American statistical Association 102 477 359--378
work page 2007
-
[15]
guibert2025impact APACrefauthors Guibert, Q. , Pincemin, G. \ Planchet, F. APACrefauthors \ 2025 . Impact of climate change on mortality: An extrapolation of temperature effects based on time series data in F rance Impact of climate change on mortality: An extrapolation of temperature effects based on time series data in F rance . International Journal of...
-
[16]
guo2017heat APACrefauthors Guo, Y. , Gasparrini, A. , Armstrong, B G. , Tawatsupa, B. , Tobias, A. , Lavigne, E. Tong, S. APACrefauthors \ 2017 . Heat wave and mortality: A multicountry, multicommunity study Heat wave and mortality: A multicountry, multicommunity study . Environmental Health Perspectives 125 8 087006 . APACrefDOI doi:10.1289/EHP1026 APACrefDOI
-
[17]
hyndman2008automatic APACrefauthors Hyndman, R J. \ Khandakar, Y. APACrefauthors \ 2008 . Automatic time series forecasting: the forecast package for R Automatic time series forecasting: the forecast package for R . Journal of Statistical Software 27 1--22 . APACrefDOI doi:10.18637/jss.v027.i03 APACrefDOI
-
[18]
stmfnote APACrefauthors Jdanov, D A. , Galarza, A A. , Shkolnikov, V M. , Jasilionis, D. , N \'e meth, L. , Leon, D A. Barbieri, M. APACrefauthors \ 2021 . The short-term mortality fluctuation data series, monitoring mortality shocks across time and space The short-term mortality fluctuation data series, monitoring mortality shocks across time and space ....
-
[19]
jordan2019evaluating APACrefauthors Jordan, A. , Kr \"u ger, F. \ Lerch, S. APACrefauthors \ 2019 . Evaluating probabilistic forecasts with scoringRules Evaluating probabilistic forecasts with scoringRules . Journal of Statistical Software 90 1--37
work page 2019
-
[20]
karlinsky2021tracking APACrefauthors Karlinsky, A. \ Kobak, D. APACrefauthors \ 2021 . Tracking excess mortality across countries during the COVID -19 pandemic with the World Mortality Dataset Tracking excess mortality across countries during the COVID -19 pandemic with the World Mortality Dataset . elife 10 e69336 . APACrefDOI doi:10.7554/eLife.69336 APACrefDOI
-
[21]
kleinow2015common APACrefauthors Kleinow, T. APACrefauthors \ 2015 . A common age effect model for the mortality of multiple populations A common age effect model for the mortality of multiple populations . Insurance: Mathematics and Economics 63 147--152 . APACrefDOI doi:10.1016/j.insmatheco.2015.03.023 APACrefDOI
-
[22]
koissi2006evaluating APACrefauthors Koissi, M C. , Shapiro, A F. \ H \"o gn \"a s, G. APACrefauthors \ 2006 . Evaluating and extending the L ee-- C arter model for mortality forecasting: Bootstrap confidence interval Evaluating and extending the L ee-- C arter model for mortality forecasting: Bootstrap confidence interval . Insurance: Mathematics and Econ...
-
[23]
lee1992modeling APACrefauthors Lee, R D. \ Carter, L R. APACrefauthors \ 1992 . Modeling and forecasting US mortality Modeling and forecasting US mortality . Journal of the American Statistical Association 87 419 659--671 . APACrefDOI doi:10.1080/01621459.1992.10475265 APACrefDOI
-
[24]
North American Actuarial Journal , volume =
li2022joint APACrefauthors Li, H. \ Tang, Q. APACrefauthors \ 2022 . Joint extremes in temperature and mortality: A bivariate POT approach Joint extremes in temperature and mortality: A bivariate POT approach . North American Actuarial Journal 26 1 43--63 . APACrefDOI doi:10.1080/10920277.2020.1823236 APACrefDOI
-
[25]
li2023influenza APACrefauthors Li, L. , Yan, Z L. , Luo, L. , Liu, W. , Yang, Z. , Shi, C. Ou, C Q. APACrefauthors \ 2023 . Influenza-associated excess mortality by age, sex, and subtype/lineage: population-based time-series study with a distributed-lag nonlinear model Influenza-associated excess mortality by age, sex, and subtype/lineage: population-base...
-
[26]
li2005coherent APACrefauthors Li, N. \ Lee, R D. APACrefauthors \ 2005 . Coherent mortality forecasts for a group of populations: An extension of the L ee- C arter method Coherent mortality forecasts for a group of populations: An extension of the L ee- C arter method . Demography 42 3 575--594 . APACrefDOI doi:10.1353/dem.2005.0021 APACrefDOI
-
[27]
lowen2007influenza APACrefauthors Lowen, A C. , Mubareka, S. , Steel, J. \ Palese, P. APACrefauthors \ 2007 . Influenza virus transmission is dependent on relative humidity and temperature Influenza virus transmission is dependent on relative humidity and temperature . PLoS Pathogens 3 10 e151 . APACrefDOI doi:10.1371/journal.ppat.0030151 APACrefDOI
-
[28]
lowen2014roles APACrefauthors Lowen, A C. \ Steel, J. APACrefauthors \ 2014 . Roles of humidity and temperature in shaping influenza seasonality Roles of humidity and temperature in shaping influenza seasonality . Journal of Virology 88 14 7692--7695 . APACrefDOI doi:10.1128/jvi.03544-13 APACrefDOI
-
[29]
madaniyazi2022seasonal APACrefauthors Madaniyazi, L. , Armstrong, B. , Chung, Y. , Ng, C F S. , Seposo, X. , Kim, Y. others APACrefauthors \ 2022 . Seasonal variation in mortality and the role of temperature: a multi-country multi-city study Seasonal variation in mortality and the role of temperature: a multi-country multi-city study . International Journ...
-
[30]
martinez2021projections APACrefauthors Mart \' nez-Solanas, \`E . , Quijal-Zamorano, M. , Achebak, H. , Petrova, D. , Robine, J M. , Herrmann, F R. Ballester, J. APACrefauthors \ 2021 . Projections of temperature-attributable mortality in E urope: a time series analysis of 147 contiguous regions in 16 countries Projections of temperature-attributable mort...
-
[31]
min2025assessing APACrefauthors Min, J. , Li, H. , Nagler, T. \ Li, S. APACrefauthors \ 2025 . Assessing Climate-Driven Mortality Risk: A Stochastic Approach with Distributed Lag Non-Linear Models. Assessing climate-driven mortality risk: A stochastic approach with distributed lag non-linear models. Preprint at https://arxiv.org/pdf/2506.00561
-
[32]
pavia2022estimation APACrefauthors Pav \' a, J M. \ Lled \'o , J. APACrefauthors \ 2022 . Estimation of the combined effects of ageing and seasonality on mortality risk: An application to S pain Estimation of the combined effects of ageing and seasonality on mortality risk: An application to S pain . Journal of the Royal Statistical Society Series A: Stat...
-
[33]
pitacco2009modelling APACrefauthors Pitacco, E. APACrefauthors \ 2009 . Modelling longevity dynamics for pensions and annuity business Modelling longevity dynamics for pensions and annuity business . Oxford University Press
work page 2009
-
[34]
robben2025short APACrefauthors Robben, J. , Antonio, K. \ Kleinow, T. APACrefauthors \ 2025 . The short-term association between environmental variables and mortality: evidence from E urope The short-term association between environmental variables and mortality: evidence from E urope . Journal of the Royal Statistical Society Series A: Statistics in Soci...
-
[35]
robben2025granular APACrefauthors Robben, J. , Barigou, K. \ Kleinow, T. APACrefauthors \ 2025 . Granular mortality modeling with temperature and epidemic shocks: a three-state regime-switching approach. Granular mortality modeling with temperature and epidemic shocks: a three-state regime-switching approach. Preprint at https://arxiv.org/pdf/2503.04568
-
[36]
seklecka2017mortality APACrefauthors Seklecka, M. , Pantelous, A A. \ O'Hare, C. APACrefauthors \ 2017 . Mortality effects of temperature changes in the U nited K ingdom Mortality effects of temperature changes in the U nited K ingdom . Journal of Forecasting 36 7 824--841 . APACrefDOI doi:10.1002/for.2473 APACrefDOI
-
[37]
valleron1986computer APACrefauthors Valleron, A J. , Bouvet, E. , Garnerin, P. , M \'e nares, J. , Heard, I. , Letrait, S. \ Lefaucheux, J. APACrefauthors \ 1986 . A computer network for the surveillance of communicable diseases: the F rench experiment A computer network for the surveillance of communicable diseases: the F rench experiment . American Jour...
-
[38]
wang2022estimating APACrefauthors Wang, H. , Paulson, K R. , Pease, S A. , Watson, S. , Comfort, H. , Zheng, P. others APACrefauthors \ 2022 . Estimating excess mortality due to the COVID -19 pandemic: a systematic analysis of COVID -19-related mortality, 2020--21 Estimating excess mortality due to the COVID -19 pandemic: a systematic analysis of COVID -1...
-
[39]
wilmoth2007methods APACrefauthors Wilmoth, J R. , Andreev, K. , Jdanov, D. , Glei, D A. , Boe, C. , Bubenheim, M. Vachon, P. APACrefauthors \ 2007 . Methods protocol for the human mortality database Methods protocol for the human mortality database \ ( 9). University of California, Berkeley, and Max Planck Institute for Demographic Research, Rostock. URL:...
work page 2007
-
[40]
wong2018bayesian APACrefauthors Wong, J S. , Forster, J J. \ Smith, P W. APACrefauthors \ 2018 . Bayesian mortality forecasting with overdispersion Bayesian mortality forecasting with overdispersion . Insurance: Mathematics and Economics 83 206--221 . APACrefDOI doi:10.1016/j.ijforecast.2022.01.011 APACrefDOI
-
[41]
wood2017generalized APACrefauthors Wood, S N. APACrefauthors \ 2017 . Generalized additive models: An introduction with R Generalized additive models: An introduction with R . CRC Press . APACrefDOI doi:10.1201/9781315370279 APACrefDOI
-
[42]
Wood, Natalya Pya, and Benjamin Säfken
wood2016smoothing APACrefauthors Wood, S N. , Pya, N. \ S \"a fken, B. APACrefauthors \ 2016 . Smoothing parameter and model selection for general smooth models Smoothing parameter and model selection for general smooth models . Journal of the American Statistical Association 111 516 1548--1563 . APACrefDOI doi:10.1080/01621459.2016.1180986 APACrefDOI
discussion (0)
Sign in with ORCID, Apple, or X to comment. Anyone can read and Pith papers without signing in.