REVIEW 3 major objections 4 minor 9 references
Managing the Complexity of Processing Financial Data at Scale -- an Experience Report
T0 review · 3 major / 4 minor · reviewed 2026-08-14 · deepseek-v4-flash
Pith's one-line read vwd reports that its production systems process 18 billion financial notifications a day, peaking above one million per second.
desk verdict A readable industry experience report; treat the scale numbers as indicative until the authors reconcile 18B/day with 700k/s. read the letter →
The pith
A machine-rendered reading of the paper's core claim, the machinery that carries it, and where it could break.
The reading
What carries the argument
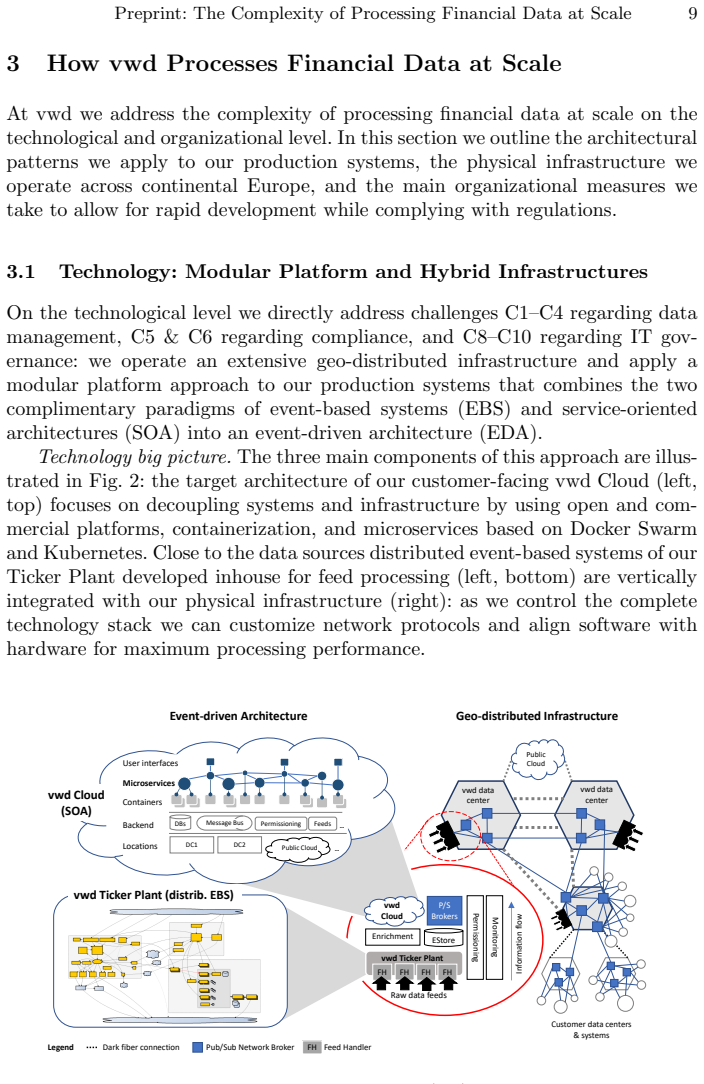
The load-bearing machinery is the ticker plant, an in-house, distributed event-based system in which feed handlers are tailored to the protocol, syntax, and semantics of each of the 500+ sources and scale horizontally. Normalized notifications flow into an event store (in-memory plus relational databases), are enriched with derived KPIs, and are pushed through a distributed content-based publish/subscribe broker network that filters by fine-grained subscriptions to any of 30 million symbols. This machinery sits inside a service-oriented, containerized cloud that exposes legacy applications behind REST facades, running on a geo-distributed hybrid infrastructure connected by dedicated dark-fiber gigabit lines, with permissioning metering consumption for licensing and compliance. The paper uses the four V's framework to define ten challenges and then shows how each architectural component addresses specific challenges.
What would settle it
Install an independent counter at the boundary of the ticker plant on a normal trading day, recount all received messages under a public definition of 'notification,' and compare the daily total and one-second peak with 18 billion and 1 million; also run the same count across a major political event to test the reported 50 percent volume increase around the Brexit vote.
Extended reading notes
Core claim
The central claim is that processing financial data at this scale is not mainly a throughput problem but a problem of coordinating four kinds of complexity: the sheer and growing volume of small notifications; their variety across protocols, formats, and instrument identifiers that must be normalized at runtime; the velocity requirement of roughly 40 ms end-to-end latency inside the ticker plant; and veracity, meaning that different subscribers value timeliness and completeness differently. The authors report concrete production figures—98 percent of notifications are ticks of 20–250 bytes, average daily volume grew from 167 million notifications in 2003 to 8.3 billion in 2008 and about 18 billion now—and they describe the distributed infrastructure and organizational two-speed model that, in their account, absorbs these loads, including a 50 percent volume increase around the Brexit vote and even higher sustained volumes around the 2016 U.S. election.
Load-bearing premise
The reported scale figures are vwd's internal measurements, and the paper does not define exactly what counts as a notification or which averaging windows produce the 18 billion/day and 1 million/sec numbers; if those definitions differ from standard industry usage, the headline metrics would shift.
Editorial extensions
If this is right
- Capacity planning must target combined time-zone peaks: the 10-minute-averaged curves show load clustering around exchange opens, closures, and local lunch breaks, so a single global average understates peak demand.
- Event-driven surges are a routine design case: the reported 50 percent volume increase around the Brexit vote and multi-day elevated volume around the 2016 U.S. election mean elasticity must cover attention spikes, not only scheduled trading hours.
- The same feed must be served at multiple quality levels: because some subscribers prefer timeliness even with dropped notifications while others prefer complete delayed streams, throttling, delaying, and permissioning become core functions rather than optional features.
- Regulatory accountability shapes the architecture: outsourcing guidelines, disaster-resilience requirements, and up to ten years of data retention push the system toward geo-distributed, auditable, hybrid operation.
- A modular event-driven architecture allows a heterogeneous legacy landscape to keep running: legacy applications wrapped behind REST facades and developed on a two-speed model reduce the operational burden of acquisitions and organic growth.
Reading between the lines
- The 40 ms end-to-end latency target is stated as a benchmark, not a measured distribution; publishing percentiles under load would turn it from an internal goal into a checkable service-level promise.
- Because the paper does not define exactly what counts as a notification or which averaging windows produce the 18 billion/day and 1 million/sec figures, independent reproduction or vendor comparison would require standardizing that unit; the headline numbers should be read as internal metrics.
- The load curves suggest a predictive capacity-management play: using exchange calendars and scheduled macro-economic events to pre-scale, with surprise events absorbed by general-purpose burst capacity.
- The observation that morning notifications are larger because open statistics reset daily fields implies that time-of-day-aware serialization or compression could reduce bandwidth and parsing cost.
Signed reviews
Editorial analysis
A structured set of objections, weighed in public.
Referee Report
Summary. This experience report from vwd, a European financial data provider, describes the practical challenges of processing financial data at production scale. The paper identifies ten challenges (C1–C10) organized around the Big Data dimensions of volume, variety, velocity, and veracity, as well as compliance and IT governance. It then outlines the company's technical and organizational responses: a geo-distributed hybrid infrastructure, an event-driven architecture combining a ticker plant (EBS) with a containerized service-oriented cloud (SOA), and organizational measures such as DevOps teams and two-speed development. The central quantitative claims are that vwd processes on average 18 billion notifications per day from 500+ data sources for 30 million symbols, with daily peak rates above 1 million notifications/sec, and that the Brexit vote caused a 50% increase in data volume. The paper also illustrates diurnal load patterns for selected exchanges and describes regulatory constraints such as GDPR, EBA guidelines, and licensing obligations.
Significance. If the scale figures are reliable and precisely defined, this paper provides a valuable practitioner account of a large-scale, geo-distributed financial data processing system, complementing academic work on event-based systems with real operational details. The C1–C10 taxonomy is a useful organizing device, and the architecture description—ticker plant, pub/sub broker network, hybrid infrastructure—is concrete. The authors also show appropriate caution in places, such as the caveat that the selected feeds in Fig. 1 cover limited market segments and 'might provide different products and instrument types.' The main weakness is that the headline numerical claims are internally inconsistent and under-specified, which undermines the paper's central 'at scale' contribution until clarified.
major comments (3)
- [Abstract and Section 2.2 (C1)] The headline scale figures are internally inconsistent. 18 billion notifications per day corresponds to a sustained average of 18e9 / 86400 ≈ 208,000 notifications/sec, not the stated 700,000/sec; conversely, 700,000/sec sustained over 24 hours implies roughly 60.5 billion notifications/day, about 3.4 times the stated daily total. The only way both figures can be true is if the 700,000/sec average is computed over an unstated window of about 7.1 hours, or if the two numbers count different types of notifications. The abstract and C1 present these figures without specifying the averaging window or counting rules. Since the entire 'at scale' claim rests on these numbers, this ambiguity is load-bearing and must be resolved.
- [Section 2.2 (C1) and 'Summarizing challenges C1–C4'] Related to the inconsistency above, the summarization states that 'our systems have to elastically scale to deal with peak rates that amount to several orders of magnitude of the average load.' With a stated peak of 1+ million/sec and a stated average of either 208k/sec or 700k/sec, the peak-to-average ratio is about 5 or 1.4, respectively—not 'several orders of magnitude.' This claim needs to be reconciled with the actual numbers, or the language should be revised to match the observed ratios.
- [Section 2.2 (C1), Section 2.2 (C2), and Figure 1] The manuscript does not define what counts as a 'notification' for the headline statistics: whether the 18 billion/day and 1+ million/sec figures include news and ad-hoc messages, whether they refer to raw feed data or post-enrichment events, and over what time period the 'daily average' is computed. The paper's own caveat about Figure 1—that the measured feeds 'might provide different products and instrument types'—highlights that the representativeness of the illustrated load patterns is limited. A precise measurement methodology (or at least a clear counting definition) is necessary for the reader to assess the central scale claim.
minor comments (4)
- [Section 2.2 (C2)] The percentage breakdown of daily notifications (98% ticks, 0.16% reference data, 0.001% news) sums to 98.161%, leaving roughly 1.84% of notifications unaccounted for; please specify the remaining categories or correct the figures.
- [Figure 1 caption] The exchange name is misspelled as 'Syndey' in the figure caption; it should be 'Sydney'.
- [Section 3.1 (Gigabit connectivity)] The sentence 'same to connect our locations to global public cloud providers' is grammatically incomplete; please rephrase, for example to 'we also use these lines to connect our locations to global public cloud providers.'
- [Section 2.2 (C3)] The 40 ms latency is described as an 'internal benchmark' that vwd 'defines'; please clarify whether this is a target, a measured end-to-end latency, or an observed upper bound.
Circularity Check
No circularity: the paper is an experience report with descriptive empirical claims and contains no derivation, model, or prediction that reduces to its inputs.
full rationale
The paper is an experience report describing vwd's production systems and the challenges of processing financial data at scale. It makes no formal derivation, no predictive model, and no fitted-parameter claim. The central quantitative statements, such as the daily average of 18 billion notifications and peak rates above 1 million per second, are presented as empirical measurements from the authors' own systems; there is no reasoning loop in which these values are defined in terms of a claimed output. The paper does cite two works by the first author (refs. [5] and [6]), but these citations are used only as background references for SOA availability metrics and runtime quality-of-information negotiation, respectively; they do not support the paper's load-bearing scale claims, which stand on the reported operational data. The self-acknowledged caveat that the measured feeds in Fig. 1 'might provide different products and instrument types' concerns representativeness and measurement ambiguity, not circularity. Even if the numbers are internally inconsistent under one counting convention, as the skeptic note observes, that is a correctness or precision concern about empirical reporting, not a circular derivation. No equation in the paper defines a predicted quantity in terms of an input quantity, and no parameter is fitted to data and then renamed as a result. The paper is therefore self-contained as an experience report and exhibits no significant circularity.
Assumptions & free parameters
assumptions (2)
- domain assumption Reported operational metrics (18B notifications/day, 1M notifications/sec peak, 40ms latency benchmark) are accurate as measured by vwd.
- domain assumption The five exchanges shown in Fig. 1 are representative of overall feed load patterns.
Cite this review
Pith. "Pith review of Managing the Complexity of Processing Financial Data at Scale -- an Experience Report." pith.science (2026). https://pith.science/paper/C2B453HQ
@misc{pith2026190803206,
  author       = {Pith},
  title        = {Pith review of: Managing the Complexity of Processing Financial Data at Scale -- an Experience Report},
  year         = {2026},
  howpublished = {\url{https://pith.science/paper/C2B453HQ}},
  note         = {Machine review of arXiv:1908.03206}
}
read the original abstract
Financial markets are extremely data-driven and regulated. Participants rely on notifications about significant events and background information that meet their requirements regarding timeliness, accuracy, and completeness. As one of Europe's leading providers of financial data and regulatory solutions vwd processes a daily average of 18 billion notifications from 500+ data sources for 30 million symbols. Our large-scale geo-distributed systems handle daily peak rates of 1+ million notifications/sec. In this paper we give practical insights about the different types of complexity we face regarding the data we process, the systems we operate, and the regulatory constraints we must comply with. We describe the volume, variety, velocity, and veracity of the data we process, the infrastructure we operate, and the architecture we apply. We illustrate the load patterns created by trading and how the markets' attention to the Brexit vote and similar events stressed our systems.
Figures

Reference graph
Works this paper leans on
-
[1]
BaFin: Minimum requirements for risk management for banks. https://www.bafin. de/dok/11681598 (2018), [Online; access 2019-05-09]
-
[2]
CSSF: Circular CSSF 17/654. https://www.cssf.lu/fileadmin/files/Lois_ reglements/Circulaires/Hors_blanchiment_terrorisme/cssf17_654eng_upd_ 19_714.pdf (2017), [Online; access 2019-05-09]
work page 2017
-
[3]
EBA: Final report on EBA guidelines on outsourcing arrangements. https://eba.europa.eu/documents/10180/2551996/EBA+revised+Guidelines+ on+outsourcing+arrangements, [Online; access 2019-02-12]
work page 2019
-
[4]
https://www.equinix.com/ resources/success-stories/vwd-group/ (2019), [Online; access 2019-05-09]
Equinix Inc.: VWD Group Customer Success Story. https://www.equinix.com/ resources/success-stories/vwd-group/ (2019), [Online; access 2019-05-09]
work page 2019
-
[5]
Frischbier, S., Buchmann, A., P¨ utz, D.: FIT for SOA? Introducing the FIT-metric to optimize the availability of service oriented architectures. In: CSDM’12, pp. 93 –
-
[6]
Frischbier, S., Pietzuch, P., Buchmann, A.: Managing expectations: Runtime nego- tiation of information quality requirements in event-based systems. In: ICSOC’14. pp. 199–213. Springer (2014). https://doi.org/10.1007/978-3-662-45391-9 14
-
[7]
Hinze, A., Sachs, K., Buchmann, A.: Event-based applications and enabling tech- nologies. In: DEBS’09. ACM (2009). https://doi.org/10.1145/1619258.1619260
-
[8]
Saha, B., Srivastava, D.: Data quality: The other face of big data. In: ICDE’14. pp. 1294–1297. IEEE (March 2014). https://doi.org/10.1109/ICDE.2014.6816764
arXiv 2014
Show all 9 references
-
[104]
https://doi.org/10.1007/978-3-642-25203-7 6
Springer (2012). https://doi.org/10.1007/978-3-642-25203-7 6
2012 doi
Reviewed August 14, 2026 · model on record in the stance chip above.
Discussion (0). Continue with ORCID to comment.