REVIEW 3 major objections 7 minor 24 references
The Hubble Image Similarity Project
T0 review · 3 major / 7 minor · reviewed 2026-08-16 · deepseek-v4-flash
Pith's one-line read Crowd judgments of Hubble images yield a human similarity benchmark for image search.
desk verdict A genuinely useful human-similarity benchmark for HST images, with honest but under-tested aggregation; the dataset deserves publication, with fixes to the context-dependence validation. read the letter →
The pith
A machine-rendered reading of the paper's core claim, the machinery that carries it, and where it could break.
The reading
What carries the argument
The carrying mechanism is the preference matrix $F$ plus the masked cosine distance computed from its rows. Each entry $F_{ij}$ is a Bayesian estimate—from aggregated positive and negative votes, with a per-object prior—of the probability that a reviewer would call images $i$ and $j$ similar. The distance $D_{ij}$ is the cosine distance between the two preference fingerprint vectors, ignoring missing entries; this network-fingerprint comparison is what turns 850,000 noisy page-level judgments into a complete $2098 \times 2098$ matrix. Because every distance depends on thousands of indirect comparisons rather than a single vote, random errors and layout bias largely average out.
What would settle it
Embed the same reference-comparison pair in pages of near-twin distractors and in pages of unrelated distractors, and measure whether the inferred preference for that pair shifts with context. If the positive-vote rate depends on page composition, the aggregated preference matrix—and every fingerprint distance built from it—carries a systematic bias.
Extended reading notes
Core claim
The central claim is that indirect, overlapping human votes carry enough information to reconstruct a low-noise perceptual metric. Each image sits in a comparison network spanning roughly two thousand other images, so the pattern of votes an image attracts—its preference fingerprint—matters more than any single review. The paper estimates a Bayesian preference value for every pair, builds the preference matrix $F$, and defines the similarity distance between two images as the masked cosine distance between their fingerprints; two images count as similar when they vote the same way toward the surrounding network, not merely when one reviewer clicked both. The resulting distances separate the sample by object class and Hubble type, and visual inspection of nearest neighbors shows genuine agreement in morphology and texture, including hard-to-describe features.
Load-bearing premise
The entire distance construction assumes that a reviewer's chance of calling image B similar to reference A does not depend on which other images are shown on the same page; the authors themselves call this assumption 'surely oversimplifications.'
Editorial extensions
If this is right
- Computer-vision search systems can be scored by comparing their nearest-neighbor lists with the ordering of this human distance matrix.
- The three-phase review design—exhaustive broad voting, followed by close-neighbor refinement, followed by rotated repeated comparisons—can be transplanted to other image domains.
- The matrix is complete even though most image pairs were never directly compared, so it can feed dimensionality-reduction, clustering, and retrieval benchmarks directly.
- The repeated and rotated reviews, together with golden-question accuracy between 84 and 96 percent, give benchmark users a built-in estimate of label noise.
- Because distances were built without object-type labels, agreement with galaxy and nebula taxonomy is an independent check that the metric captures real visual structure.
Reading between the lines
- A natural extension is to re-run the same fingerprint construction on data where reviewers rank images instead of choosing 'similar' or 'most similar,' which would isolate context effects from true preference.
- The authors note that t-SNE neighbors sometimes look more convincing than raw-matrix neighbors; if so, a cross-validated version of the distance matrix would be an even stronger benchmark.
- A testable prediction follows: a retrieval algorithm trained to reproduce these human distances should outperform models trained on object labels or metadata in appearance-based searches.
- Since reviewers show a small but significant bias toward images placed near the reference, future crowd benchmarks should randomize layout or explicitly model position effects.
Signed reviews
Editorial analysis
A structured set of objections, weighed in public.
Referee Report
Summary. The Hubble Image Similarity Project (HISP) constructs and publicly releases a dataset of human similarity judgments on 2,098 grayscale HST cutout images drawn from 666 NGC objects (parent sample 19,916). Three review phases were run with paid Amazon Mechanical Turk reviewers recruited from the Baltimore area: Phase 1 exhaustively compared every image pair (single reviewer per page, 'select all similar' among 15 comparisons, with golden questions); Phase 2 used 'select most similar' pages of six comparisons drawn from the ~200 nearest neighbors; Phase 3 used pages of three comparisons from the ~36 nearest neighbors, with rotations and multiple reviewers. The paper's Appendix A presents an algorithm that converts votes into a preference matrix F via a Bayesian binomial estimator with power-law priors (Eq. A6) and then computes a masked cosine distance D_ij between preference 'fingerprints' (Eq. A7), yielding a fully populated symmetric distance matrix. The paper demonstrates convergence of the distances across phases (Fig. 13), shows that object types from the NGC catalog separate cleanly in a t-SNE embedding of the matrix (Figs. 14–15), and presents nearest-neighbor montages that the authors judge visually excellent (Fig. 16).
Significance. The released dataset is the central contribution, and it is a substantial one: nearly 850,000 paid human judgments on 2,098 carefully selected HST cutouts, with the images, review results, three stage-wise distance matrices, and the Python code all archived at MAST (doi:10.17909/0q3g-by85). Because the authors release the phase-level matrices separately, users can independently study convergence and can apply more sophisticated models (e.g., reviewer-bias or Bradley-Terry-type preference models) to the raw votes. The experimental design is strong in several respects: embedded golden questions with and without rotations, three independent reviewers in the later phases, avoidance of same-object comparisons, and the use of paid local reviewers under fair-wage conditions. The clean separation of NGC object types in the t-SNE projection (Fig. 15) is a genuinely independent anchor for the central claim, because object-type labels played no role in the image selection, reviews, or distance computation; it indicates that the distances carry real morphological information.
major comments (3)
- [Appendix A.3, Eq. (A6); §§3.3–3.4] The conversion of phases 2 and 3 'most similar' selections into positive and negative votes treats every non-selected comparison as a negative vote for similarity. Because the comparison sets are deliberately restricted to close neighbors (N_n = 200 with D_min = 0.4 in phase 2; N_n = 36 with D_min = 0.21 in phase 3), a non-selection often means only that another image on the page was even closer, not that the pair is dissimilar; the bias is therefore correlated with the local density of similar images and is not removed by the network redundancy that cancels independent review errors (§4.1). Appendix A.1 flags the underlying context-independence assumption as a 'surely oversimplification' and notes that the golden questions could be used to test the reliability of secondary comparisons, but that test is not carried out. I ask for one of: (a) a quantitative test of page-composition effects using the golden questions; (b) a recomputation of the final distances with non-selections in phases 2/3 treated as missing rather than negative; or (c) a prominent caveat that the fine-grained distances among close neighbors may inherit this context bias.
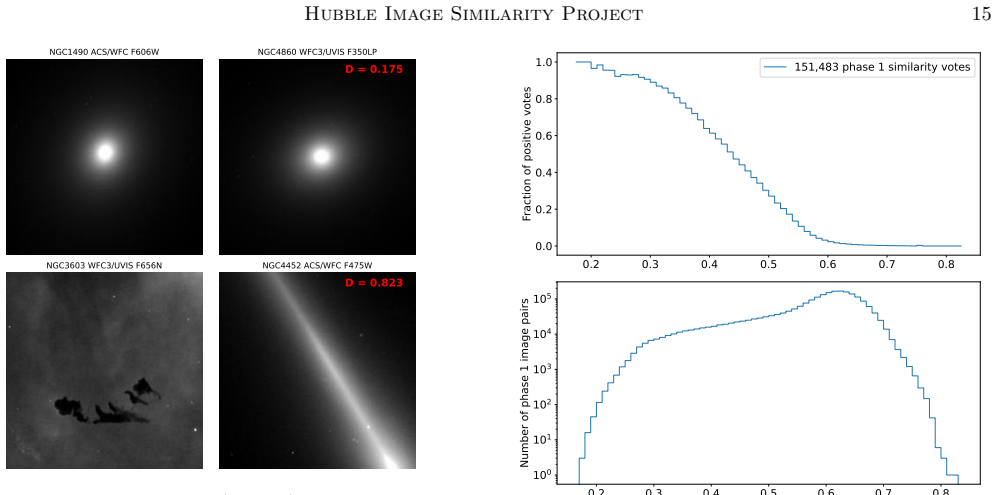
- [Appendix A.3 and §6; Figs. 10, 13, 16] The distance algorithm is tuned by experimentation on the same data ('we have a simple empirical approach that was determined via much experimentation on the data'), and the authors concede in §6 that a better algorithm would use cross-validation and that overfitting remains a concern. All of the quality demonstrations offered are in-sample: Fig. 13 shows convergence between phases rather than agreement with an external ground truth; the x-axis of Fig. 10 uses the final distance matrix that contains the same reviews whose consistency is being characterized; and Fig. 16's 'excellent results' rest on the authors' own visual examination, which §5 acknowledges is difficult to back up with data. The abstract's claims ('matches the accuracy of the trained eye', 'subtle differences among images faithfully reflected') therefore exceed what the presented evidence supports. I request at least one holdout-based validation (for example, building distances from a random half of pages or reviewers and testing on the remainder, or comparing the released phase-1-only matrix with the final matrix on the phase-2/3 pair set), and a recalibration of the abstract and §5 language to state explicitly that the validation is in-sample.
- [Section 3.3] The acknowledged error in constructing the phase 2 collection ('approximately half the image pairs were affected' by substitution of different cutouts from the same NGC object) propagates into the phase 2 preference prior, into the phase 3 neighbor selection, and hence into the final released matrix. The paper asserts that the impact is limited because the phase 2 net is broad and many substitutions are genuinely similar, but no quantitative test is provided. Given that the affected pairs are a large fraction of the phase 2 data, I request a sensitivity analysis (for example, recomputing distances with affected pairs excluded, or comparing the phase 3 neighbor sets obtained with and without the substituted pairs) and, at a minimum, a characterization of the resulting uncertainty in the MAST data documentation.
minor comments (7)
- [Section 4.2] There is a typo in Section 4.2: 'The result is is much poorer consistency in ratings' should read 'The result is much poorer consistency in ratings.'
- [Abstract; Section 5] Phrases such as 'The results are very impressive' (Abstract) and 'we find these results to be spectacular' (Section 5) are editorial in tone; I suggest replacing them with neutral statements of what the figures demonstrate, particularly in light of Major Comment 2.
- [Section 5.1] Section 5.1 states that moderate changes in the t-SNE parameters lead to comparable results, but no quantitative support is given; I suggest reporting the parameter ranges tried and a quantitative measure of the resulting variation in the coordinates.
- [Appendix A.3] Appendix A.3 notes that phase 2/3 votes are collected only in the direction where the reviewed image is the reference; a sentence explaining how this asymmetry enters the masked cosine distance in Eq. (A7) (which pairs are downweighted or lost) would help users of the released matrices.
- [Section 2; Section 5] The entropy cut in Section 2 (both entropy values greater than 5) removes roughly 60% of the parent sample; Section 5 should state explicitly that the distance distribution and statements such as 'the loneliest image' describe this high-contrast selected sample rather than HST imaging in general.
- [Appendix A.1] Phase 1 golden questions are included in the distance calculation while golden-question accuracy is also reported as a reviewer-quality diagnostic; the fraction is small (3%) and the impact likely minor, but a one-sentence justification or sensitivity check would remove a residual circularity concern.
- [Section 5] The speculation that 'the t-SNE distances actually give better results than the similarity matrix distances' conflicts with the paper's framing of the matrix as the primary product; since the authors state they cannot substantiate the claim, I suggest either deleting it or explicitly labeling it as an untested hypothesis.
Circularity Check
No significant circularity: the similarity matrix is derived from the reviews by an explicit algorithm, and the main quality evidence (NGC object-type separation) uses labels not involved in the construction.
full rationale
The paper's central product is a similarity distance matrix obtained from human review votes through a defined masked-cosine preference-fingerprint procedure (Eq. A7). The paper does not claim to predict an external quantity from first principles; it reports a data-reduction algorithm and then offers evidence for the quality of the resulting matrix. The strongest independent validation is in Section 5.1, where t-SNE embeddings of the distance matrix separate NGC object types (galaxies, ellipticals, spirals, clusters, nebulae) even though no object-type labels were used in image selection, review design, or distance computation. This is genuine external grounding. The authors' visual inspection of nearest neighbors (Fig. 16) is a sanity check, not an input to the construction. The appendix explicitly and repeatedly disclaims optimality, stating the phase 2/3 update is 'a simple empirical approach' with 'no strongly justified algorithm,' which is an honest limitation rather than a circular step. Some internal consistency figures use the derived distance matrix as a reference (e.g., Fig. 10), and the phase 1 distance matrix includes phase 1 golden-question pages, but these are descriptive self-consistency checks and are not load-bearing: the object-type separation and reviewer-error analyses do not reduce to the distance definition by construction. No self-citation chain, uniqueness theorem, or fitted-parameter-as-prediction step is load-bearing. The derivation chain is therefore self-contained, and any concerns about context-dependent similarity judgments or suboptimal data reduction are correctness/robustness issues, not circularity.
Assumptions & free parameters
free parameters (4)
- object prior mean similarity fractions fbar_i =
0.024 to 0.216 per image
- Phase 2 neighbor count N_n and distance threshold D_min =
N_n = 200, D_min = 0.4
- Phase 3 neighbor count N_n and distance threshold D_min =
N_n = 36, D_min = 0.21
- Entropy selection threshold =
>5 for global and local Shannon entropy
assumptions (5)
- domain assumption Reviewer preference for a pair is independent of the other images on the page
- domain assumption Similarity preferences are symmetric and stable across reviewers and time
- domain assumption Masked cosine distance between preference fingerprints is a valid similarity measure
- standard math Bayesian beta-binomial update with power-law prior is appropriate
- domain assumption Sample cuts (entropy, visual artifact removal) do not bias similarity structure
Cite this review
Pith. "Pith review of The Hubble Image Similarity Project." pith.science (2026). https://pith.science/paper/C73HJWTI
@misc{pith2026250417688,
  author       = {Pith},
  title        = {Pith review of: The Hubble Image Similarity Project},
  year         = {2026},
  howpublished = {\url{https://pith.science/paper/C73HJWTI}},
  note         = {Machine review of arXiv:2504.17688}
}
read the original abstract
We have created a large database of similarity information between sub-regions of Hubble Space Telescope images. These data can be used to assess the accuracy of image search algorithms based on computer vision methods. The images were compared by humans in a citizen science project, where they were asked to select similar images from a comparison sample. We utilized the Amazon Mechanical Turk system to pay our reviewers a fair wage for their work. Nearly 850,000 comparison measurements have been analyzed to construct a similarity distance matrix between all the pairs of images. We describe the algorithm used to extract a robust distance matrix from the (sometimes noisy) user reviews. The results are very impressive: the data capture similarity between images based on morphology, texture, and other details that are sometimes difficult even to describe in words (e.g., dusty absorption bands with sharp edges). The collective visual wisdom of our citizen scientists matches the accuracy of the trained eye, with even subtle differences among images faithfully reflected in the distances.
Figures


Figures from the paper (13 more)




Reference graph
Works this paper leans on
-
[1]
8 K5uF =>gŁ\ C] ۠ M K 8 8<q @c (G F cqŎ VZA I ip
thebibliography [1] 20pt to REFERENCES 6pt =0pt \@twocolumntrue 12pt -12pt 10pt plus 3pt =0pt =0pt =1pt plus 1pt =0pt =0pt -12pt =13pt plus 1pt =20pt =13pt plus 1pt \@M =10000 =-1.0em =0pt =0pt 0pt =0pt =1.0em @enumiv\@empty 10000 10000 `\.\@m \@noitemerr \@latex@warning Empty `thebibliography' environment \@ifnextchar \@reference \@latexerr Missing key o...
work page 2017
-
[2]
Astropy Collaboration , Robitaille , T. P., Tollerud , E. J., et al. 2013, , 558, A33, 10.1051/0004-6361/201322068
-
[3]
Brams , S. J., & Fishburn , P. C. 1978, American Political Science Review, 72, 831–847, 10.2307/1955105
doi:10.2307/1955105 1978
-
[4]
Christiansen , J. L., Crossfield , I. J. M., Barentsen , G., et al. 2018, , 155, 57, 10.3847/1538-3881/aa9be0
-
[5]
Fleiss , J. L. 1971, Psychological Bulletin, 74, 378, 10.1037/h0031619
doi:10.1037/h0031619 1971
-
[6]
Giavalisco , M., Livio , M., Bohlin , R. C., Macchetto , F. D., & Stecher , T. P. 1996, , 112, 369, 10.1086/118021
doi:10.1086/118021 1996
-
[7]
A., Stein , G., Harrington , P., Luki \'c , Z., & Mustafa , M
Hayat , M. A., Stein , G., Harrington , P., Luki \'c , Z., & Mustafa , M. 2021, , 911, L33, 10.3847/2041-8213/abf2c7
-
[8]
2018, arXiv e-prints, arXiv:1801.06146, 10.48550/arXiv.1801.06146
Howard , J., & Ruder , S. 2018, arXiv e-prints, arXiv:1801.06146, 10.48550/arXiv.1801.06146
Show all 24 references
- [9]
-
[10]
2015, , 521, 436, 10.1038/nature14539
LeCun , Y., Bengio , Y., & Hinton , G. 2015, , 521, 436, 10.1038/nature14539
2015 doi
-
[11]
J., Schawinski , K., Slosar , A., et al
Lintott , C. J., Schawinski , K., Slosar , A., et al. 2008, , 389, 1179, 10.1111/j.1365-2966.2008.13689.x
2008
-
[12]
R., Fekete , G., et al
Lupton , R., Blanton , M. R., Fekete , G., et al. 2004, , 116, 133, 10.1086/382245
2004 doi
-
[13]
2019, , 131, 038002, 10.1088/1538-3873/aaf3fa
Mahabal , A., Rebbapragada , U., Walters , R., et al. 2019, , 131, 038002, 10.1088/1538-3873/aaf3fa
2019 doi
-
[14]
Peek , J. E. G., & Burkhart , B. 2019, , 882, L12, 10.3847/2041-8213/ab3a9e
2019 doi
-
[15]
Peek , J. E. G., Jones , C. K., & Hargis , J. 2020, in Astronomical Society of the Pacific Conference Series, Vol. 522, Astronomical Data Analysis Software and Systems XXVII, ed. P. Ballester , J. Ibsen , M. Solar , & K. Shortridge , 381
2020
-
[16]
Rosse , T. E. O. 1850, Philosophical Transactions of the Royal Society of London Series I, 140, 499
-
[17]
2023, , 135, 084101, 10.1088/1538-3873/ace851
Seo , E., Kim , S., Lee , Y., et al. 2023, , 135, 084101, 10.1088/1538-3873/ace851
2023 doi
-
[18]
Sim , J., & Wright , C. C. 2005, Physical Therapy, 85, 257, 10.1093/ptj/85.3.257
2005 doi
-
[19]
F., Cutri , R
Skrutskie , M. F., Cutri , R. M., Stiening , R., et al. 2006, , 131, 1163, 10.1086/498708
2006 doi
-
[20]
2008, Journal of Machine Learning Research, 9, 2579
van der Maaten , L., & Hinton , G. 2008, Journal of Machine Learning Research, 9, 2579. http://www.jmlr.org/papers/v9/vandermaaten08a.html
2008
-
[21]
2017, OpenNGC, The GAVO DC team, 10.21938/Y.1EJWUD_MQ6B_EDFOVBBW
Verga, M. 2017, OpenNGC, The GAVO DC team, 10.21938/Y.1EJWUD_MQ6B_EDFOVBBW
2017 doi
-
[22]
C., Allam , S
Whitmore , B. C., Allam , S. S., Budav \'a ri , T., et al. 2016, , 151, 134, 10.3847/0004-6256/151/6/134
2016 doi
-
[23]
G., Adelman , J., Anderson , John E., J., et al
York , D. G., Adelman , J., Anderson , John E., J., et al. 2000, , 120, 1579, 10.1086/301513
2000 doi
-
[24]
2017, Classical and Quantum Gravity, 34, 064003, 10.1088/1361-6382/aa5cea
Zevin , M., Coughlin , S., Bahaadini , S., et al. 2017, Classical and Quantum Gravity, 34, 064003, 10.1088/1361-6382/aa5cea
2017 doi
Reviewed August 16, 2026 · model on record in the stance chip above.
Discussion (0). Continue with ORCID to comment.