REVIEW 3 major objections 7 minor 50 references
Dimension Agnostic Testing of Survey Data Credibility through the Lens of Regression
T0 review · 3 major / 7 minor · reviewed 2026-08-15 · deepseek-v4-flash
Pith's one-line read Survey credibility for regression can be certified with a sample count that never depends on the data dimension.
desk verdict The task-based FDD/survey-credibility idea is new and dimension-free, but Theorem 5's proof has a Hoeffding-range bug and an unstated equal-noise-variance assumption. read the letter →
The pith
A machine-rendered reading of the paper's core claim, the machinery that carries it, and where it could break.
The reading
What carries the argument
The central object is the Functional Distance of Distributions (FDD), defined as the distributional $\ell_2$-distance between the optimal model for the survey distribution and the optimal model for the true distribution, both evaluated under the true distribution. The identity that carries the argument is Lemma 4, which decomposes the true expected squared loss of the survey-fitted model as $\text{FDD}^2 + \sigma_\eta^2$, so that credibility becomes a statement about loss rather than about distributions. SurVerify then estimates the true expected loss on a small fresh sample, compares it to the survey's own training loss, and uses an early-rejection rule plus a final threshold to accept or reject. The sample-size requirements come from a new two-sided generalization bound, proved with empirical Rademacher complexity and Talagrand's contraction lemma, which controls both over- and under-estimation of the expected loss.
What would settle it
Fix a true distribution $D^*$ with noise variance $\sigma_\eta^2$ and construct a survey distribution $D_S$ whose conditional mean is the same function $f^*$ but whose noise variance is $\sigma_\eta^2/4$; then the squared FDD is zero, so Theorem 5 predicts ACCEPT with probability $1-\delta$, yet the survey loss $\hat L_S$ underestimates $\sigma_\eta^2$, which can push $\hat\gamma - \tau \hat L_S$ above $3\tau\epsilon$ and trigger REJECT. Observing rejections above $\delta$ under this construction would show that equation (11), which asserts equality of noise variances across the two distributions, is load-bearing.
Extended reading notes
Core claim
The paper's central claim is Theorem 5: given a survey drawn from an unknown distribution $D_S$, a regression model class, and i.i.d. sampling access to the true distribution $D^*$, SurVerify accepts with probability at least $1-\delta$ when the squared Functional Distance of Distributions is at most $\epsilon$, rejects with probability at least $1-\delta$ when that squared distance exceeds $5\epsilon$, and uses at most $\lceil 2/(1.9\epsilon)^2 \log(3/\delta)\rceil$ samples from $D^*$. The efficiency comes from testing the model the survey produces rather than reconstructing the population model; the paper also proves that any algorithm that reconstructs the model first must spend $\Omega(d\lambda_{\min}\sigma_\eta^2/\epsilon^2)$ samples. A new two-sided generalization bound, obtained through Rademacher complexity, supplies the required survey size for Lasso, Ridge, and kernel classes. The FDD-variance decomposition, Lemma 4, is the load-bearing identity: the expected squared loss of the survey model under the true distribution equals the squared FDD plus the irreducible noise variance $\sigma_\eta^2$.
Load-bearing premise
The proof requires that the noise variance in the survey data equals the noise variance in the true population, so that the survey's training loss estimates the irreducible noise variance $\sigma_\eta^2$; if the survey is noisier or cleaner than the population, the accept and reject thresholds shift and the guarantee can fail even when the fitted models are close.
Editorial extensions
If this is right
- For Lasso, Ridge, and kernel regression, a survey of sufficient size can be certified using only $O(\epsilon^{-2}\log(1/\delta))$ samples from the true population, with no dependence on the ambient dimension.
- If the squared FDD is at most $\epsilon$, SurVerify accepts with probability $1-\delta$; if it exceeds $5\epsilon$, SurVerify rejects with probability $1-\delta$, leaving an explicit tolerance gap between $\epsilon$ and $5\epsilon$.
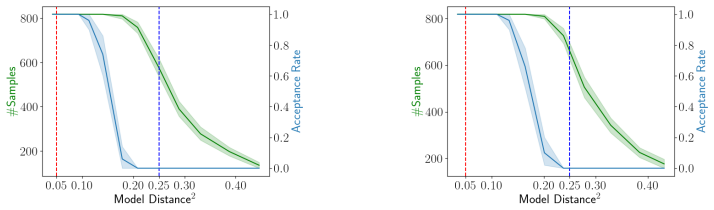
- The early-rejection rule means that surveys that are far from credible are detected with fewer samples than the worst-case bound, matching the paper's experiments where average samples used drop rapidly as the model distance grows.
- Because SurVerify does not reconstruct the regression model, it avoids the linear-in-dimension sample cost that any reconstruction-based testing method must pay, as established by the paper's lower bound.
- The same fresh samples from $D^*$ can be reused for multiple projection-based credibility checks, since the paper notes that FDD is not robust to arbitrary projections and recommends running SurVerify on projected dimensions.
Reading between the lines
- If the same two-sided concentration can be obtained for other losses, such as classification losses or heteroskedastic regression, SurVerify's compare-the-losses logic would extend to a wider family of task-specific credibility notions; the paper explicitly leaves these extensions open.
- The dimension-free sample count suggests a practical validation protocol: maintain a small gold-standard sample from the population and reuse it to certify many different survey datasets for a fixed regression task, since the required sample size is constant for fixed tolerance and confidence.
- The early-rejection stopping time itself carries quantitative information about how far the survey model is from the true model, so the algorithm could be adapted to return a constant-factor estimate of FDD rather than just a binary accept or reject.
- The FDD equivalence classes point to a possible design principle: two survey distributions are interchangeable for a task if they induce the same optimal model under the chosen hypothesis class, which could inform stratified sampling design before data collection.
Signed reviews
Editorial analysis
A structured set of objections, weighed in public.
Referee Report
Summary. The paper proposes a task-based approach to assessing whether a sample survey is credible for downstream regression analysis. It defines the Functional Distance of Distributions (FDD), the distance, measured under the true distribution, between the regression models that are optimal for the survey distribution and for the true distribution. The main algorithmic contribution is SurVerify, which fits a regression model to the survey, draws a small number of validation samples from the true distribution, and decides ACCEPT or REJECT by comparing validation loss against the survey's empirical loss. The headline claim is that the number of validation samples is O(log(1/delta)/epsilon^2), independent of the covariate dimension, with a 1-delta guarantee under an epsilon/5epsilon acceptance/rejection gap. The paper also proves a two-sided Rademacher-style generalization bound, gives survey-size lower bounds for Lasso, Ridge, and kernel classes, and presents a dimension-dependent lower bound for approaches that reconstruct the model. Experiments on synthetic data and ACS_Income illustrate the acceptance-rate behavior. The central idea is appealing, but the proof of the main theorem contains several load-bearing gaps that need to be addressed before the stated guarantees can be accepted.
Significance. If the main theorem were fully established, the paper would make a useful contribution: it offers a concrete way to certify survey credibility for regression without exponential-in-dimension distribution testing, and its validation sample complexity is genuinely dimension-free. The proposed two-sided generalization bound (Theorem 6) is also of independent interest, and the lower bound in Lemma 9 gives a useful contrast between model reconstruction and task-based testing. The experiments are careful in structure and support the qualitative accept/reject behavior claimed for the algorithm. However, the paper's central guarantee as stated is not established: the proof of Theorem 5 relies on incorrect Hoeffding constants, an unstated equality of irreducible noise variances across the survey and true distributions, and a mismatch between the FDD condition in the theorem statement and the empirical model actually used by the algorithm. These issues are load-bearing, but they appear fixable either by adding the missing assumptions or by restating the theorem in terms of the quantity the algorithm actually controls.
major comments (3)
- [Appendix D, Eqs. (22) and (26)] The Hoeffding-based concentration estimates in the proof of Theorem 5 use constants appropriate for [0,1]-valued variables, while the squared loss is bounded in [0,4] by Assumption 2. In Eq. (22), the threshold sqrt(t * 2 log(3τ/δ)) with [0,4]-valued summands gives exponent -log(3τ/δ)/4, not -log(3τ/δ), so the claimed bound delta/(3τ) does not follow. In Eq. (26), even under [0,1] boundedness the stated calculation gives 2 exp(-τ(1.9ε)^2/2) = 2δ/3 rather than delta/3; with [0,4] boundedness the discrepancy is larger. Consequently the union-bound argument does not establish the stated 1-delta guarantee. This is fixable by choosing tau with an additional factor of 8 (and adjusting the early-stopping threshold), which preserves the O(1/epsilon^2 log(1/delta)) dimension-free sample complexity, but the constants in the theorem and the algorithm description must be corrected.
- [Appendix C.1, Eq. (11)] Lemma 14 and Lemma 7 identify the survey empirical loss L_S with the true irreducible noise variance sigma_eta^2 through Eq. (11), which asserts sigma_eta^2 = E_{D*}[(f*(x)-y)^2] = E_{DS}[(f*_S(x)-y)^2]. Assumption 1 only postulates homoskedasticity and non-correlation of the noise within each distribution; it does not state that the irreducible noise variance under DS equals that under D*. If the survey is noisier or cleaner than the population by Delta, the final ACCEPT test gamma_tau - tau L_S <= 3 tau epsilon carries an additive bias tau(sigma_{D*}^2 - sigma_{DS}^2), so a perfectly credible survey can be rejected with high probability, and a far-from-credible survey can be accepted. The theorem's conditions are silent on this equality, so Theorem 5 as stated is not established. The fix is to add equal noise variance across DS and D* as an explicit assumption, or to estimate sigma_eta^2 from the D* validation samples and adjust the comparison accordingly.
- [Theorem 5, statement and proof in Appendix D] The theorem statement conditions on FDD_{D*}(DS,D*) = dist_{D*}(f_{DS}, f*), the distance between population-optimal models, but the algorithm uses fS, the empirical minimizer on the finite survey. In the proof, the condition used before Eq. (23) is 'dist^2_{D*}(fS,f*) <= epsilon', which is a different quantity from FDD^2. Nothing in Lemma 7 or in the survey-size conditions of Table 1 bounds dist_{D*}(fS, f_{DS}) under D*; uniform convergence on DS controls risk under DS, and DS and D* may have very different covariate supports. Thus FDD <= epsilon does not prevent the validation loss from being large when fS differs from f_{DS} on the support of D*, which would cause part 1 of Theorem 5 to fail as stated. The proof also assumes a unique minimizer f_{DS}, which Assumption 1 does not guarantee. The theorem should be restated in terms of dist_{D*}(fS, f*) (the quantity the algorithm actually tests), or the authors must prove a transfer bound from fS to f_{DS} under D* under explicit additional assumptions.
minor comments (7)
- [Appendix D] The proof of Theorem 5 contains the repeated headings 'Proof of 5' and 'Proof of 5'; these should be 'Proof of Part 1' and 'Proof of Part 2'.
- [Section 5 and Tables 3-6] The figures in Section 5 and the appendix state delta = 0.1, while the appendix tables say delta = 0.01 throughout; this discrepancy should be reconciled.
- [Lemma 9, discussion after the proof] The text says that if the expected losses differ by epsilon, then FDD = epsilon by Lemma 4; under equal noise variance Lemma 4 gives FDD^2 equal to the loss difference, so FDD would be sqrt(epsilon), not epsilon.
- [Abstract and Section 1] The phrase 'sample complexity of our algorithm is independent of the data's dimension' refers only to the validation samples from D*; the survey size in Table 1 for Ridge is Omega(d/epsilon^2) and for Lasso depends on d through log d. This distinction should be stated explicitly in the abstract and introduction.
- [Section 5, RQ1] The sentence 'how does the acceptance rate of SurVerify change as the the distance between the survey set S and the true distribution D*, and the tolerance parameter change?' contains a duplicated article and an ungrammatical structure.
- [Assumption 2 and Table 1] Assumption 2 states f(x) <= 1, but for the kernel class with ||theta||_H <= 1 and K(x,x) <= r^2 one only has |f(x)| <= r; if r > 1 the boundedness condition is violated, and the kernel row of Table 1 should state the additional requirement r <= 1 or rescale the kernel.
- [References and typos] The reference list contains the typo 'NuerPS' for NeurIPS, and Section 1 contains 'odtained' for 'obtained'; Section 5 repeatedly uses '#samples-to-set' where '#samples-to-test' is meant.
Circularity Check
No circularity: FDD is a defined population target, not a fitted output; Eq. (11)'s equal-noise-variance assertion is an unsupported assumption, not a circular reduction.
full rationale
No circular steps are present in SurVerify's derivation. Definition 3 defines FDD as a population-level distance between the optimal models f_D1 and f_D2, and the algorithm never fits FDD from the validation samples; the decision rule is a concentration test on the validation loss gamma against the survey loss L_S. The finite-sample gap between E_DS[(f_S-y)^2] and L_S is handled by Theorem 6's two-sided Rademacher bound, which is proved from external textbook results (McDiarmid, Talagrand contraction, MRT18/AFM20 Rademacher estimates), and the proof explicitly accounts for f_S being the ERM on S. Thus the accept/reject threshold is not the input re-labeled as a prediction. The only load-bearing caveat is Appendix C.1, Eq. (11): 'sigma_eta^2 = E_(x,y)~D*[(f*(x)-y)^2] = E_(x,y)~DS[(f*_S(x)-y)^2]' is asserted 'from Assumption 1,' but Assumption 1 states homoskedasticity and non-correlation within a regression model, not equality of irreducible noise or zero approximation error across D* and DS. If the survey distribution is noisier or cleaner, the test boundary shifts by the variance mismatch and Theorem 5 can accept or reject incorrectly. This is an unstated assumption / correctness gap, not a circular reduction: L_S is not being relabeled as FDD, and adding the equal-noise-variance condition as an explicit hypothesis would make the theorem an independent statement. There are no load-bearing self-citations.
Assumptions & free parameters
assumptions (5)
- domain assumption Exogenous noise model y=f(x)+eta with zero-mean, uncorrelated, homoskedastic noise (Assumption 1).
- domain assumption Boundedness: |y| <= 1, |x|_inf <= 1, |f(x)| <= 1 (Assumption 2).
- ad hoc to paper Equal irreducible noise variance under DS and D*.
- standard math Known Rademacher complexity bounds for bounded linear and kernel classes.
- standard math Statistical lower bound for regression parameter estimation from [DW13].
Cite this review
Pith. "Pith review of Dimension Agnostic Testing of Survey Data Credibility through the Lens of Regression." pith.science (2026). https://pith.science/paper/CM2JQRTJ
@misc{pith2026250820616,
  author       = {Pith},
  title        = {Pith review of: Dimension Agnostic Testing of Survey Data Credibility through the Lens of Regression},
  year         = {2026},
  howpublished = {\url{https://pith.science/paper/CM2JQRTJ}},
  note         = {Machine review of arXiv:2508.20616}
}
read the original abstract
Assessing whether a sample survey credibly represents the population is a critical question for ensuring the validity of downstream research. Generally, this problem reduces to estimating the distance between two high-dimensional distributions, which typically requires a number of samples that grows exponentially with the dimension. However, depending on the model used for data analysis, the conclusions drawn from the data may remain consistent across different underlying distributions. In this context, we propose a task-based approach to assess the credibility of sampled surveys. Specifically, we introduce a model-specific distance metric to quantify this notion of credibility. We also design an algorithm to verify the credibility of survey data in the context of regression models. Notably, the sample complexity of our algorithm is independent of the data dimension. This efficiency stems from the fact that the algorithm focuses on verifying the credibility of the survey data rather than reconstructing the underlying regression model. Furthermore, we show that if one attempts to verify credibility by reconstructing the regression model, the sample complexity scales linearly with the dimensionality of the data. We prove the theoretical correctness of our algorithm and numerically demonstrate our algorithm's performance.
Figures


Figures from the paper (3 more)


Reference graph
Works this paper leans on
-
[1]
On the R ademacher complexity of linear hypothesis sets
Pranjal Awasthi, Natalie Frank, and Mehryar Mohri. On the R ademacher complexity of linear hypothesis sets. CoRR , abs/2007.11045, 2020
arXiv 2007
-
[2]
Geometric dataset distances via optimal transport
David Alvarez-Melis and Nicol\` o Fusi. Geometric dataset distances via optimal transport. In Proceedings of the 34th International Conference on Neural Information Processing Systems , NIPS '20, Red Hook, NY, USA, 2020. Curran Associates Inc
work page 2020
-
[3]
Lower bounds for testing graphical models: Colorings and antiferromagnetic ising models
Ivona Bez \'a kov \'a , Antonio Blanca, Zongchen Chen, Daniel S tefankovi c , and Eric Vigoda. Lower bounds for testing graphical models: Colorings and antiferromagnetic ising models. Journal of Machine Learning Research , 21(25):1--62, 2020
work page 2020
-
[4]
Hardness of identity testing for restricted boltzmann machines and potts models
Antonio Blanca, Zongchen Chen, Daniel S tefankovi c , and Eric Vigoda. Hardness of identity testing for restricted boltzmann machines and potts models. Journal of Machine Learning Research , 22(152):1--56, 2021
work page 2021
-
[5]
Abhijit Banerjee, Esther Duflo, Clement Imbert, Santhosh Mathew, and Rohini Pande. E-governance, accountability, and leakage in public programs: Experimental evidence from a financial management reform in india. American Economic Journal: Applied Economics , 12(4):39--72, 2020
work page 2020
-
[6]
Testing that distributions are close
Tugkan Batu, Lance Fortnow, Ronitt Rubinfeld, Warren D Smith, and Patrick White. Testing that distributions are close. In FOCS2000 , pages 259--269. IEEE, 2000
work page 2000
-
[7]
Arnab Bhattacharyya, Sutanu Gayen, Saravanan Kandasamy, and N. V. Vinodchandran. Testing product distributions: A closer look. In Vitaly Feldman, Katrina Ligett, and Sivan Sabato, editors, Proceedings of the 32nd International Conference on Algorithmic Learning Theory , volume 132 of Proceedings of Machine Learning Research , pages 367--396. PMLR, 16--19 Mar 2021
work page 2021
-
[8]
Arnab Bhattacharyya, Sutanu Gayen, Kuldeep S Meel, and N. V. Vinodchandran. Efficient distance approximation for structured high-dimensional distributions via learning. In H. Larochelle, M. Ranzato, R. Hadsell, M.F. Balcan, and H. Lin, editors, Advances in Neural Information Processing Systems , volume 33, pages 14699--14711. Curran Associates, Inc., 2020
work page 2020
Show all 50 references
-
[9]
Mortality, lifestyle and socio-economic status
Silvia Balia and Andrew M Jones. Mortality, lifestyle and socio-economic status. Journal of health economics , 27(1):1--26, 2008
2008
-
[10]
Cl \' e ment L. Canonne. A survey on distribution testing: Your data is big. but is it blue? Electron. Colloquium Comput. Complex. , TR15-063 , 2015
2015
-
[11]
Cl\' e ment L. Canonne. Topics and Techniques in Distribution Testing: A Biased but Representative Sample . Foundations and Trends in Communications and Information Theory , 19(6):1032--1198, 2022
2022
-
[12]
Canonne, Ilias Diakonikolas, Daniel M
Clement L. Canonne, Ilias Diakonikolas, Daniel M. Kane, and Alistair Stewart. Testing bayesian networks. In Satyen Kale and Ohad Shamir, editors, Proceedings of the 2017 Conference on Learning Theory , volume 65 of Proceedings of Machine Learning Research , pages 370--448. PML...
2017
-
[13]
Impact of population aging on trends in diabetes prevalence: a meta-regression analysis of 160,000 japanese adults
Hadrien Charvat, Atsushi Goto, Maki Goto, Machiko Inoue, Yoriko Heianza, Yasuji Arase, Hirohito Sone, Tomoko Nakagami, Xin Song, Qing Qiao, et al. Impact of population aging on trends in diabetes prevalence: a meta-regression analysis of 160,000 japanese adults. Journal of dia...
2015
-
[14]
The price of tolerance in distribution testing
Clement L Canonne, Ayush Jain, Gautam Kamath, and Jerry Li. The price of tolerance in distribution testing. In Po-Ling Loh and Maxim Raginsky, editors, Proceedings of Thirty Fifth Conference on Learning Theory , volume 178 of Proceedings of Machine Learning Research , pages 57...
2022
-
[15]
Testing ising models
Constantinos Daskalakis, Nishanth Dikkala, and Gautam Kamath. Testing ising models. In Proceedings of the Twenty-Ninth Annual ACM-SIAM Symposium on Discrete Algorithms , SODA '18, page 1989–2007, USA, 2018. Society for Industrial and Applied Mathematics
1989
-
[16]
Sample-optimal identity testing with high probability
Ilias Diakonikolas, Themis Gouleakis, John Peebles, and Eric Price. Sample-optimal identity testing with high probability. In Ioannis Chatzigiannakis, Christos Kaklamanis, D \' a niel Marx, and Donald Sannella, editors, 45th International Colloquium on Automata, Languages, and...
2018
-
[17]
Retiring adult: New datasets for fair machine learning
Frances Ding, Moritz Hardt, John Miller, and Ludwig Schmidt. Retiring adult: New datasets for fair machine learning. In Marc'Aurelio Ranzato, Alina Beygelzimer, Yann N. Dauphin, Percy Liang, and Jennifer Wortman Vaughan, editors, NuerPS , pages 6478--6490, 2021
2021
-
[18]
Validation of linear regression models
Holger Dette and Axel Munk. Validation of linear regression models. The Annals of Statistics , 26(2):778--800, 1998
1998
-
[19]
Square hellinger subadditivity for bayesian networks and its applications to identity testing
Constantinos Daskalakis and Qinxuan Pan. Square hellinger subadditivity for bayesian networks and its applications to identity testing. In Satyen Kale and Ohad Shamir, editors, Proceedings of the 2017 Conference on Learning Theory , volume 65 of Proceedings of Machine Learning...
2017
-
[20]
Duchi and Martin J
John C. Duchi and Martin J. Wainwright. Distance-based and continuum fano inequalities with applications to statistical estimation, 2013
2013
-
[21]
Training neural networks is np-hard in fixed dimension
Vincent Froese and Christoph Hertrich. Training neural networks is np-hard in fixed dimension. In Advances in Neural Information Processing Systems 36: Annual Conference on Neural Information Processing Systems 2023, NeurIPS 2023, New Orleans, LA, USA, December 10 - 16, 2023 , 2023
2023
-
[22]
Survey methodology
Robert M Groves, Floyd J Fowler Jr, Mick P Couper, James M Lepkowski, Eleanor Singer, and Roger Tourangeau. Survey methodology . John Wiley & Sons, 2011
2011
-
[23]
Learning resources: Statistics: Power from data! non-probability sampling
Statistics Canada Government of Canada. Learning resources: Statistics: Power from data! non-probability sampling. https://www150.statcan.gc.ca/n1/edu /power-pouvoir/ch13/nonprob/5214898-eng.htm , 2024
2024
-
[24]
On choosing and bounding probability metrics
Alison L Gibbs and Francis Edward Su. On choosing and bounding probability metrics. International statistical review , 70(3):419--435, 2002
2002
-
[25]
Applied survey data analysis
Steven G Heeringa, Brady T West, and Patricia A Berglund. Applied survey data analysis . chapman and hall/CRC, 2017
2017
-
[26]
Towards Principled Unskewing : Viewing 2020 Election Polls Through a Corrective Lens From 2016
Michael Isakov and Shiro Kuriwaki. Towards Principled Unskewing : Viewing 2020 Election Polls Through a Corrective Lens From 2016. Harvard Data Science Review , 2(4), nov 3 2020. https://hdsr.mitpress.mit.edu/pub/cnxbwum6
2020
-
[27]
An Introduction to Statistical Learning: with Applications in R
Gareth James, Daniela Witten, Trevor Hastie, and Robert Tibshirani. An Introduction to Statistical Learning: with Applications in R . Springer US, 2021
2021
-
[28]
Introduction to Survey Sampling
Graham Kalton. Introduction to Survey Sampling . SAGE Publications, Inc., Thousand Oaks, California, May 2021
2021
-
[29]
The use of differential privacy for census data and its impact on redistricting: The case of the 2020 us census
Christopher T Kenny, Shiro Kuriwaki, Cory McCartan, Evan TR Rosenman, Tyler Simko, and Kosuke Imai. The use of differential privacy for census data and its impact on redistricting: The case of the 2020 us census. Science advances , 7(41):eabk3283, 2021
2020
-
[30]
Convergence and concentration of empirical measures under Wasserstein distance in unbounded functional spaces
Jing Lei. Convergence and concentration of empirical measures under Wasserstein distance in unbounded functional spaces . Bernoulli , 26(1):767 -- 798, 2020
2020
-
[31]
Sampling: design and analysis
Sharon L Lohr. Sampling: design and analysis . Chapman and Hall/CRC, 2021
2021
-
[32]
Towards out-of-distribution generalization: A survey, 2023
Jiashuo Liu, Zheyan Shen, Yue He, Xingxuan Zhang, Renzhe Xu, Han Yu, and Peng Cui. Towards out-of-distribution generalization: A survey, 2023
2023
-
[33]
Probability in Banach Spaces
Michel Ledoux and Michel Talagrand. Probability in Banach Spaces . Springer Berlin Heidelberg, 1991
1991
-
[34]
Rethinking traditional methods of survey validation
Andrew Maul. Rethinking traditional methods of survey validation. Measurement: Interdisciplinary Research and Perspectives , 15(2):51--69, 2017
2017
-
[35]
The computational complexity of training relu(s)
Pasin Manurangsi and Daniel Reichman. The computational complexity of training relu(s). CoRR , abs/1810.04207, 2018
2018 arXiv
-
[36]
Foundations of machine learning
Mehryar Mohri, Afshin Rostamizadeh, and Ameet Talwalkar. Foundations of machine learning . MIT Press, 2018
2018
-
[37]
Transgender population size in the united states: a meta-regression of population-based probability samples
Esther L Meerwijk and Jae M Sevelius. Transgender population size in the united states: a meta-regression of population-based probability samples. American journal of public health , 107(2):e1--e8, 2017
2017
-
[38]
A coincidence-based test for uniformity given very sparsely sampled discrete data
Liam Paninski. A coincidence-based test for uniformity given very sparsely sampled discrete data. IEEE Transactions on Information Theory , 54(10):4750--4755, 2008
2008
-
[39]
A newer equal part linear regression model: A case study of the influence of educational input on gross national income
Wen-Tsao Pan. A newer equal part linear regression model: A case study of the influence of educational input on gross national income. Eurasia Journal of Mathematics, Science and Technology Education , 13(8):5765--5773, 2017
2017
-
[40]
Picard and R
Richard R. Picard and R. Dennis Cook. Cross-validation of regression models. Journal of the American Statistical Association , 79(387):575--583, 1984
1984
-
[41]
Information Theory: From Coding to Learning
Yury Polyanskiy and Yihong Wu. Information Theory: From Coding to Learning . Cambridge University Press, 2025
2025
-
[42]
Robust regression and outlier detection
Peter J Rousseeuw and Annick M Leroy. Robust regression and outlier detection . John wiley & sons, 2003
2003
-
[43]
How to conduct your own survey
Priscilla Salant and Don A Dillman. How to conduct your own survey. Willey , 1994
1994
-
[44]
Ronald D. Snee. Validation of regression models: Methods and examples. Technometrics , 19(4):415--428, 1977
1977
-
[45]
Stein and Rami Shakarchi
Elias M. Stein and Rami Shakarchi. Functional Analysis . Princeton University Press, Princeton, 2012
2012
-
[46]
Nonparametric model checks for regression
Winfried Stute. Nonparametric model checks for regression . The Annals of Statistics , 25(2):613 -- 641, 1997
1997
-
[47]
Statistical development and validation of clinical prediction models
Steven J Staffa and David Zurakowski. Statistical development and validation of clinical prediction models. Anesthesiology , 135(3):396--405, September 2021
2021
-
[48]
An automatic inequality prover and instance optimal identity testing
Gregory Valiant and Paul Valiant. An automatic inequality prover and instance optimal identity testing. SIAM Journal on Computing , 46(1):429--455, 2017
2017
-
[49]
All of Statistics: A Concise Course in Statistical Inference
Larry Wasserman. All of Statistics: A Concise Course in Statistical Inference . Springer Texts in Statistics. Springer, New York, 2004
2004
-
[50]
Minimax optimal estimation of KL divergence for continuous distributions
Puning Zhao and Lifeng Lai. Minimax optimal estimation of KL divergence for continuous distributions. IEEE Trans. Inf. Theory , 66(12):7787--7811, 2020
2020
Reviewed August 15, 2026 · model on record in the stance chip above.
Discussion (0). Continue with ORCID to comment.