REVIEW 4 major objections 5 minor 27 references
beamModelTester: software framework for testing radio telescope beams
T0 review · 4 major / 5 minor · reviewed 2026-08-14 · deepseek-v4-flash
Pith's one-line read beamModelTester is a modular software framework that tests radio telescope beam models by joining predicted and observed flux and polarization data on time and frequency and mapping the differences.
desk verdict A genuinely useful modular tool for comparing beam models with observations, but the CasA demonstration is not quantitative enough to validate the Hamaker model or the framework's diagnostic power. read the letter →
The pith
A machine-rendered reading of the paper's core claim, the machinery that carries it, and where it could break.
The reading
What carries the argument
The central mechanism is the join operation: model and observed datasets, produced separately, are merged on the common independent variables of time and frequency, with horizontal coordinates altitude and azimuth computed from the station position and target coordinates. The comparison step then applies user-selectable normalisation (maximum-based or fit-based, overall or per-frequency/time) and RFI excision, and forms differences by subtraction or by ratios in either direction, along with RMSE and Pearson correlation. This join-and-compare pipeline, wrapped in modular plug-ins for data sources, is what turns two heterogeneous inputs into a quantitative map of where a beam model diverges from reality.
What would settle it
Repeat the comparison on the same observation after subtracting all known bright A-team sources using a sky model; if the smooth curved difference features attributed to sidelobes vanish, they were sky contamination rather than beam-model error. Alternatively, image the station's sidelobe response at the times and frequencies of the features to check for coincident bright sources.
Extended reading notes
Core claim
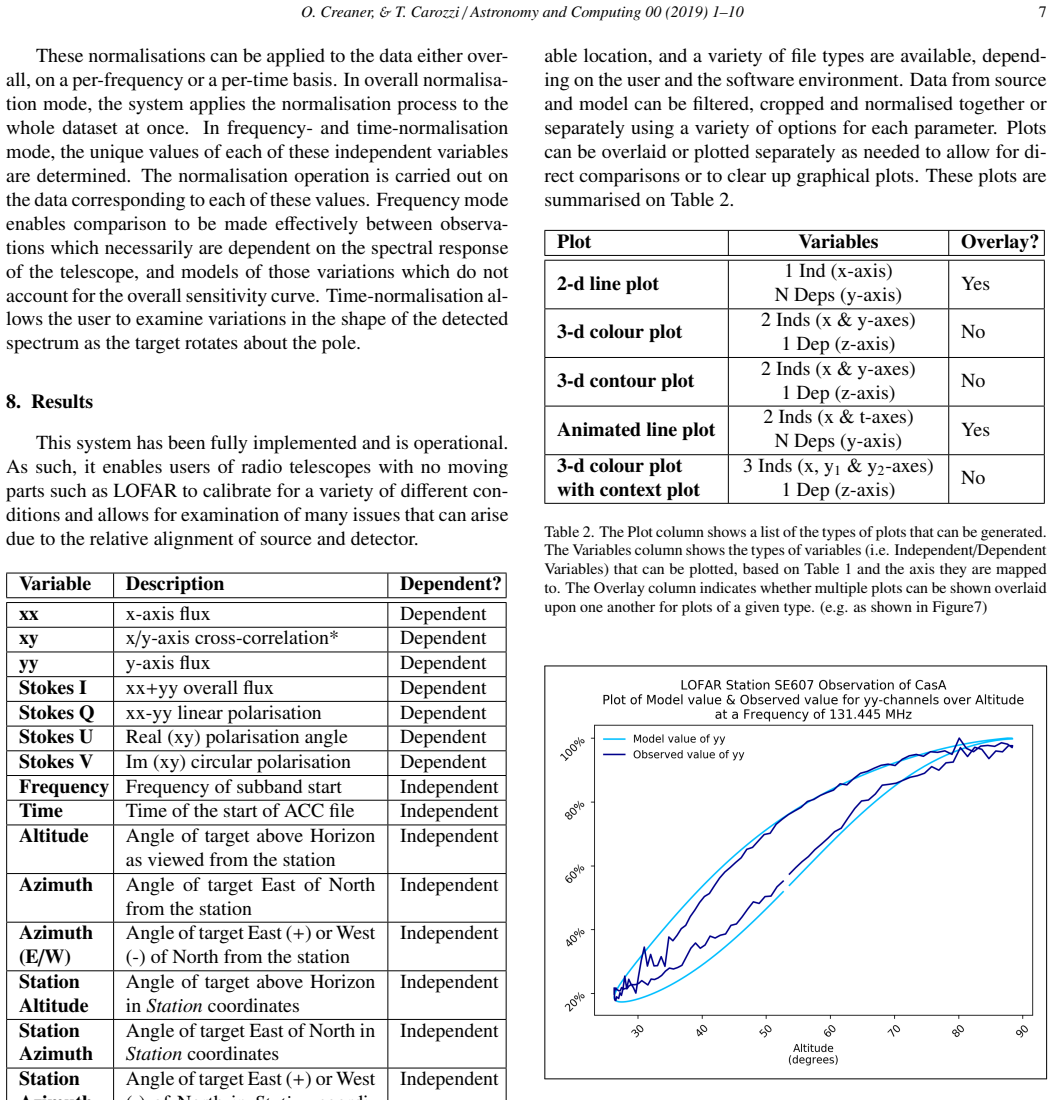
The paper claims that beamModelTester provides a working, reusable system for quantifying the performance of beam models of radio telescopes with no moving parts. It joins model predictions from the dreamBeam implementation of the Hamaker model with beamformed observations of Cassiopeia A reduced by iLiSA, calculating linear fluxes and Stokes parameters, then compares them through subtraction, division, and inverse division, with RMSE and Pearson correlation as figures of merit. The CasA demonstration shows the Hamaker model tracks the altitude dependence of the observed flux well in some frequency channels while failing in others, and it reveals smooth curved difference features that the paper attributes to bright 'A-team' sources entering the LOFAR beam sidelobes. Because these features move across the frequency axis as the target tracks across the sky, the software exposes both model deficiencies and observational contamination that a calibration model would need to include.
Load-bearing premise
The comparison treats the iLiSA-reduced observation as a faithful measurement of CasA's flux and polarization, assuming the target is point-like and that no other sky source enters the beam; if bright 'A-team' sources do enter the sidelobes in the data used, the plotted model–observation differences mix sky contamination with beam-model error.
Editorial extensions
If this is right
- Users of the framework can identify the specific altitude, azimuth, and frequency regions where a beam model fails, which directly guides where a model should be refined.
- New or alternative beam models can be tested against the same observation and against each other, providing a common basis for choosing between models.
- The difference plots can reveal contamination from bright off-axis sources entering the beam sidelobes, flagging data regions that must be handled separately in calibration.
- The framework's modular design means it can be extended to other telescopes and models with only new data plug-ins, not changes to the comparison machinery.
- Planned extensions to multiple targets and multiple stations would produce more complete sky coverage for testing models.
Reading between the lines
- A natural testable extension is to re-run the CasA comparison after subtracting A-team sources using a sky model; if the parabola-like difference features disappear, they were sidelobe contamination rather than beam-model error, and the Hamaker model's apparent failures shrink.
- The same join-and-difference machinery could serve as a generic diagnostic for any stationary phased-array station, since the orientation-dependent variation it maps is present in any such array, including future low-frequency observatories.
- The smooth curved features in the Stokes Q difference plots could be inverted to estimate the effective sidelobe gain of the station as a function of frequency and azimuth, turning the comparison tool into a beam-measurement tool.
Signed reviews
Editorial analysis
A structured set of objections, weighed in public.
Referee Report
Summary. The paper presents beamModelTester, an open-source, modular Python framework for comparing predictions of radio-telescope beam models with beamformed observations. The architecture separates model generation (dreamBeam), observation processing (iLiSA), and a comparison module that joins the two by time and frequency, applies user-selected normalisation and RFI cropping, and produces a range of 2D, 3D, and 4D diagnostic plots, including difference plots and figures of merit. The method is demonstrated on a 24-hour LOFAR HBA station SE607 observation of Cassiopeia A, comparing the Hamaker model implemented in dreamBeam with iLiSA-derived Stokes fluxes. The paper claims that the system enables users to robustly compare a model with a real observation and to identify regions where the model deviates from the data.
Significance. The software is a practical, much-needed tool for a community that relies on analytic beam models for flux and polarisation calibration of phased-array telescopes. The open-source release, modular plugin design, and extensive automated plotting are genuine strengths, and the paper demonstrates that the pipeline executes end-to-end on real data. However, the demonstration as presented does not yet establish the central claim of robust model-observation comparison: the observation pipeline deliberately avoids sky-model assumptions, while the results attribute substantial observed features to A-team sidelobe contamination, and no uncertainty quantification is provided. As a software-description paper, the contribution is valuable and likely suitable for the journal, but the scientific validation of the comparison method needs strengthening or reframing.
major comments (4)
- [Sections 5, 8, and 9] The demonstration conflates beam-model error with sky contamination. Section 5 states that iLiSA calculates beamformed fluxes 'without assumptions regarding a sky model and thus does not include demixing of other sources.' Section 8 and Figure 9 then identify 'parabola-like contamination from sidelobe observations of other A-Team sources' in the very data being compared, and Section 9 concedes that such contamination 'must be accounted for in any attempt to calibrate the observation by means of a model.' Since the difference plots cannot distinguish unmodelled sky sources from genuine beam-model deficiencies, the claim in Section 9 that the system enables a user to 'robustly compare the model with a real observation' is not supported for the CasA demonstration. Please either quantify the sidelobe contamination (e.g., by estimating the expected A-team flux at the relevant beam sidelobe gains) and show that it is negligible, or clearly reframe the CasA example as an illustrative, not a validated, demonstration.
- [Figures 2, 4, 5, 7, 8, and associated text] No uncertainties or error bars are provided for any observed or modelled quantity, yet the diagnostic value of the difference plots depends on knowing whether discrepancies are significant. For example, Figure 7's caption asserts that 'at higher altitude, noise levels are greater than the model-source disagreement,' but no noise measurement or statistical estimate is presented to support that statement. Without a noise model, propagation of calibration uncertainties, or at minimum a quantitative description of the scatter, the reader cannot assess whether the plotted differences in Figures 7-9 are physically meaningful or within measurement noise. Please add uncertainty estimates to the demonstration plots or discuss their absence explicitly.
- [Section 7, Fit-based normalisation] The description of fit-based normalisation raises a load-bearing ambiguity. The text says that this method computes 'the linear multiplication factor and constant offset that provides a least-square fit between the model and the observation, and applies these factors to the observation.' If this normalisation is applied per frequency or per time, it removes absolute calibration offsets and gains by construction, so the resulting difference plots only compare shapes, not absolute fluxes. The paper does not state whether fit-based normalisation was used in any of the demo figures, nor does it discuss the effect such normalisation has on the interpretation of the plotted differences. Please specify which normalisation mode produced each figure and explain its consequences for the claim of robust comparison.
- [Section 7, RFI cropping] The paper acknowledges that the user-specified cropping thresholds 'can lead to the elimination of real data as well as RFI-driven outliers.' Since the demo figures are trimmed to remove 'RFI-dominated frequencies' (Figures 2 and 5) and no thresholds or criteria are reported, the reader cannot determine whether any of the structure attributed to beam-model deviations could be an artefact of aggressive cropping. Please state the cropping thresholds/method used for the demonstration and show that the main conclusions are robust to reasonable variations in those thresholds.
minor comments (5)
- [Section 5] The phrase 'International LOFAR in Stand Alone mode' should be spelled out consistently at first use, and it would help to clarify which iLiSA version and configuration were used for the demonstration.
- [Figures 10 and 11] The captions refer to 'Array Factor' and 'beampattern' without defining the difference used here; consider clarifying whether these are simulated patterns only, and how they relate quantitatively to the sidelobe contamination discussed in Figure 9.
- [Section 8] The text attributes several features to Tasse et al. (2012) but does not give specific mechanisms; a sentence elaborating which feature corresponds to which explanation would improve readability.
- [Section 6] The description of Pearson's correlation as a figure of merit would benefit from a caveat that correlation is insensitive to additive and multiplicative offsets, which is particularly relevant given the fit-based normalisation option described later.
- [Throughout] Several figure references and panel labels (e.g., 'Altitude against Azimuth' in Figure 5) are not fully described in the text; a short description of each subplot would make the paper more self-contained.
Circularity Check
No significant circularity: the model-observation comparison is externally grounded, and the paper's own caveats concern validity rather than circularity.
full rationale
beamModelTester does not derive a physical law or fit a model to the data it then 'predicts.' The Hamaker beam model is an external analytical model implemented by dreamBeam; the observation is a real LOFAR/CasA measurement processed by iLiSA without a sky model (Section 5). The two are joined only by common time and frequency axes and compared through direct plots, difference plots, and figures of merit (Section 6). The optional fit-based normalisation fits a linear scale and offset to the observation, which is a deliberate normalisation step rather than a claim to predict absolute flux, and the demonstration plots use maximum normalisation. The self-citations to dreamBeam and iLiSA are software pointers, not evidence substituting for an independent result; the load-bearing model is Hamaker's and the data are external. Section 8 and Section 9 explicitly flag that sidelobe contamination from A-team sources can masquerade as model error, and conclude that such contamination must be accounted for before calibrating the observation by means of a model. That is a correctness and validity caveat about the CasA demonstration, not a circular step in the framework's derivation. No equation or fitted parameter is recycled as a prediction, so the circularity score is 0.
Assumptions & free parameters
free parameters (2)
- Fit-based normalisation scale and offset =
user-selected, least-squares fit
- RFI cropping thresholds =
user-specified percentiles or multiples of median/mean
assumptions (5)
- domain assumption The Hamaker model implemented in dreamBeam is an acceptable representation of the LOFAR station beam for the demonstration.
- domain assumption Cassiopeia A is point-like at the resolution of a single LOFAR HBA station.
- domain assumption The iLiSA-reduced observation contains flux only from the target direction, with negligible contamination from other sources.
- standard math Astropy coordinate transformations correctly compute altitude and azimuth.
- ad hoc to paper RFI excision does not remove real astrophysical signal.
Cite this review
Pith. "Pith review of beamModelTester: software framework for testing radio telescope beams." pith.science (2026). https://pith.science/paper/CMZIQ33E
@misc{pith2026190802141,
  author       = {Pith},
  title        = {Pith review of: beamModelTester: software framework for testing radio telescope beams},
  year         = {2026},
  howpublished = {\url{https://pith.science/paper/CMZIQ33E}},
  note         = {Machine review of arXiv:1908.02141}
}
read the original abstract
The flux, polarimetric and spectral response of phased array radio telescopes with no moving parts such as LOFAR is known to vary considerably with orientation of the source to the receivers. Calibration models exist for this dependency such as those that are used in the LOFAR pipeline. Presented here is a system for comparing the predicted outputs from any given model with the results of an observation. In this paper, a sample observation of a bright source, Cassiopeia A, is used to demonstrate the software in operation, by providing an observation and a model of that observation which can be compared with one another. The package presented here is flexible to allow it to be used with other models and sources. The system operates by first calculating the predictions of the model and the results of an observation of linear fluxes and Stokes parameters separately. The model and observed values are then joined using the variables common to both, time and frequency. Normalisation and RFI excision are carried out and the differences between the prediction and the observation are calculated. A wide selection of 2-, 3- and 4-dimensional plots are generated to illustrate the dependence of the model and the observation as well as the difference between them on independent parameters time, frequency, altitude and azimuth. Thus, beamModelTester provides a framework by which it is possible to calibrate and propose refinements to models and to compare models with one another.
Figures


Figures from the paper (6 more)




Reference graph
Works this paper leans on
-
[1]
write newline
" write newline "" before.all 'output.state := FUNCTION n.dashify 't := "" t empty not t #1 #1 substring "-" = t #1 #2 substring "--" = not "--" * t #2 global.max substring 't := t #1 #1 substring "-" = "-" * t #2 global.max substring 't := while if t #1 #1 substring * t #2 global.max substring 't := if while FUNCTION word.in bbl.in ":" * " " * FUNCTION f...
-
[2]
author Arias, M. , author Vink, J. , author De Gasperin, F. , author Salas, P. , author Oonk, J. , author Van Weeren, R. , author Van Amesfoort, A. , author Anderson, J. , author Beck, R. , author Bell, M. , et al., year 2018 . title Low-frequency radio absorption in Cassiopeia A . journal Astronomy & Astrophysics volume 612 , pages A110
work page 2018
-
[3]
author Asad, K. , author Koopmans, L. , author Jeli \'c , V. , author Ghosh, A. , author Abdalla, F. , author Brentjens, M. , author de Bruyn, A. , author Ciardi, B. , author Gehlot, B. , author Iliev, I. , et al., year 2016 . title Polarization leakage in epoch of reionization windows--II. Primary beam model and direction-dependent calibration . journal ...
work page 2016
-
[4]
author Asad, K. , author Koopmans, L. , author Jeli \'c , V. , author Pandey, V. , author Ghosh, A. , author Abdalla, F. , author Bernardi, G. , author Brentjens, M. , author de Bruyn, A. , author Bus, S. , et al., year 2015 . title Polarization leakage in epoch of reionization windows--I. Low Frequency Array observations of the 3C196 field . journal Mont...
work page 2015
-
[5]
author Butcher, H.R. , year 2004 . title LOFAR : First of a new generation of radio telescopes , in: booktitle Ground-based Telescopes , organization International Society for Optics and Photonics . pp. pages 537--545
work page 2004
-
[6]
author Carozzi, T.D. , year 2016-- . title dreamBeam : Radio telescope beam modeling framework . howpublished www.github.com/2baOrNot2ba/dreamBeam . note [Online; accessed 2019-06-04]
work page 2016
-
[7]
author Carozzi, T.D. , year 2017 . title dreamBeam : A software package for radio telescope beam models with a LOFAR plugin . howpublished www.astron.nl/ilttom2017/Documents/ILTTOM2017_2_SE607_1.pdf . note [Online; accessed 2019-06-04]
work page 2017
-
[8]
author Carozzi, T.D. , year 2018-- . title iLiSA - international LOFAR in stand-alone mode . howpublished www.github.com/2baOrNot2ba/iLiSA . note [Online; accessed 2019-06-04]
work page 2018
Show all 27 references
-
[9]
, year 2013
author Collette, A. , year 2013 . title Python and HDF5: Unlocking Scientific Data . publisher O'Reilly Media, Inc
2013
-
[10]
, et al., year 2014--
author Collette, A. , et al., year 2014-- . title HDF5 for Python . howpublished www.h5py.org . note [Online; accessed 2019-06-04]
2014
-
[11]
, year 2018--
author Creaner, O. , year 2018-- . title beammodeltester: a general-purpose tool for evaluation of models of radio telescope beams . howpublished www.github.com/creaneroDIAS/beamModelTester . note [Online; accessed 2019-06-04]
2018
-
[12]
, author Bolli, P
author Di Ninni, P. , author Bolli, P. , author Paonessa, F. , author Pupillo, G. , author Virone, G. , author Wijnholds, S.J. , year 2019 . title Electromagnetic analysis and experimental validation of the LOFAR radiation patterns . journal International Journal of Antennas a...
2019
-
[13]
, author Marquarding, M
author van Diepen, G. , author Marquarding, M. , author Molenaar, G. , year 2007 . title Python bindings for casacore, a library used in radio astronomy . howpublished www.github.com/casacore/python-casacore
2007
-
[14]
, author van Diepen, G
author Dijkema, T.J. , author van Diepen, G. , author Offringa, A. , author Loose, M. , author Schoenmakers, A.R.A. , author Mol, J.D. , author Grange, Y. , author pdonker , author Molenaar, G. , author Rafferty, D. , year 2008-- . title Dp3: streaming processing pipeline for ...
2008
-
[15]
, year 2011
author Hamaker, J. , year 2011 . title Mathematical-physical analysis of the generic dual-dipole antenna . type Technical Report . Tech. rep., ASTRON
2011
-
[16]
, author Kassim, N
author Helmboldt, J. , author Kassim, N. , year 2009 . title The evolution of cassiopeia a at low radio frequencies . journal The Astronomical Journal volume 138 , pages 838
2009
-
[17]
, year 2007
author Hunter, J.D. , year 2007 . title Matplotlib: A 2d graphics environment . journal Computing in Science & Engineering volume 9 , pages 90--95
2007
-
[18]
, author Oliphant, T
author Jones, E. , author Oliphant, T. , author Peterson, P. , et al., year 2001-- . title SciPy: Open source scientific tools for Python . howpublished www.scipy.org . note [Online; accessed 2019-06-04]
2001
-
[19]
, year 2010
author McKinney, W. , year 2010 . title Data Structures for Statistical Computing in Python , in: editor van der Walt, S. , editor Millman, J. (Eds.), booktitle Proceedings of the 9th Python in Science Conference , pp. pages 51 -- 56
2010
-
[20]
, author Smirnov, O
author Molenaar, G. , author Smirnov, O. , year 2018 . title KERN . journal Astronomy and Computing
2018
-
[21]
, author De Bruyn, A
author Offringa, A. , author De Bruyn, A. , author Zaroubi, S. , author van Diepen, G. , author Martinez-Ruby, O. , author Labropoulos, P. , author Brentjens, M.A. , author Ciardi, B. , author Daiboo, S. , author Harker, G. , et al., year 2013 . title The LOFAR radio environme...
2013
-
[22]
, author Pizzo, R.F
author Shulevski, A. , author Pizzo, R.F. , author van Diepen, G. , author Dijkema, T.J. , author Heald, G. , author de Gasperin, F. , author Iacobelli, M. , author McKean, J. , author Mevius, M. , author Offringa, A. , author Orr\' u , E. , author Rafferty, D. , author Tasse,...
2019
-
[23]
, author van Diepen, G
author Tasse, C. , author van Diepen, G. , author van der Tol, S. , author van Weeren, R.J. , author van Zwieten, J.E. , author Batejat, F. , author Bhatnagar, S. , author van Bemmel, I. , author B \^ rzan, L. , author Bonafede, A. , et al., year 2012 . title LOFAR calibration...
2012
-
[24]
, author Sip o cz, B
author The Astropy Collaboration , author Price-Whelan, A. , author Sip o cz, B. , author G \"u nther, H. , author Lim, P. , author Crawford, S. , author Conseil, S. , author Shupe, D. , author Craig, M. , author Dencheva, N. , et al., year 2018 . title The Astropy project: Bu...
2018
-
[25]
, author Tollerud, E.J
author The Astropy Collaboration , author Robitaille, T.P. , author Tollerud, E.J. , author Greenfield, P. , author Droettboom, M. , author Bray, E. , author Aldcroft, T. , author Davis, M. , author Ginsburg, A. , author Price-Whelan, A.M. , author Kerzendorf, W.E. , et al., y...
2013
-
[26]
, author Colbert, S.C
author Van Der Walt, S. , author Colbert, S.C. , author Varoquaux, G. , year 2011 . title The NumPy array: a structure for efficient numerical computation . journal Computing in Science & Engineering volume 13 , pages 22
2011
-
[27]
, year 2012
author Virtanen, I. , year 2012 . title Station data cookbook . howpublished www.lofar.ie/wp-content/uploads/2018/03/station_data_cookbook_v1.2.pdf . note [Online; accessed 2019-06-19]
2012
Reviewed August 14, 2026 · model on record in the stance chip above.
Discussion (0). Continue with ORCID to comment.