REVIEW 4 major objections 5 minor 28 references
Derivative-Based Mir Spectroscopy for Blood Glucose Estimation Using Pca-Driven Regression Models
T0 review · 4 major / 5 minor · reviewed 2026-08-11 · deepseek-v4-flash
Pith's one-line read Selectively fusing FTIR absorbance with its first derivative raises the coefficient of determination of blood-glucose regression from 0.44 to 0.596 in ridge regression and from 0.47 to 0.60 in SVR.
desk verdict A plausible derivative-based preprocessing idea whose reported R2 gains are undermined by selection leakage in the shared LOOCV loop; worth testing but needs a rigorous validation redesign. read the letter →
The pith
A machine-rendered reading of the paper's core claim, the machinery that carries it, and where it could break.
The reading
What carries the argument
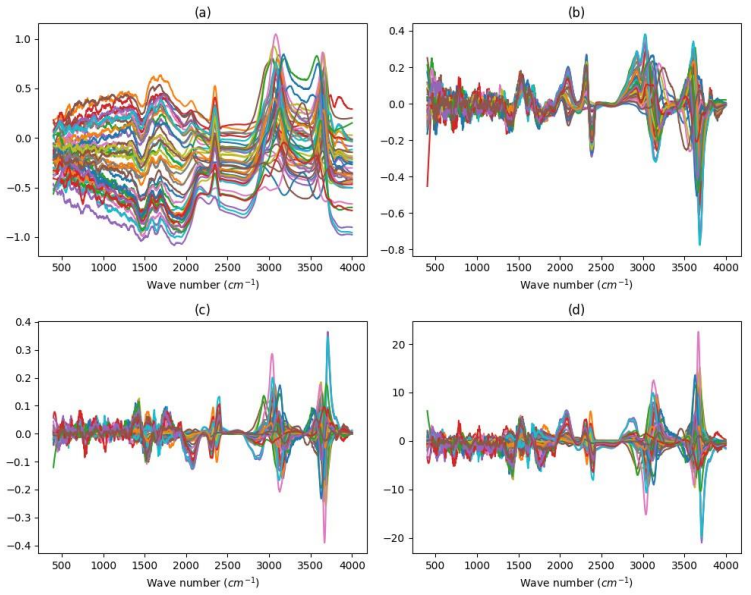
TBD is a per-wavenumber switch: for each point $i$, if $|100 \cdot A_i'| < \tau$ the output keeps the absorbance $A_i$, and otherwise it uses $100 \cdot A_i'$, with threshold $\tau$ tuned in $[0.02, 0.3]$. ADPD forms $y = x - \alpha\, z \cdot x$, where $z$ is the first derivative of $x$ with respect to wavenumber and $\alpha$ is tuned in $[0,70]$, so the raw signal is cut back most where the derivative is large. Both operations run after rubber-band baseline correction, min-max scaling, and Savitzky-Golay smoothing, and the resulting spectra are reduced with principal component analysis before entering ridge or SVR regression.
What would settle it
Re-run the whole procedure so that, for each held-out sample, the threshold, $\alpha$, PCA component count, and model hyperparameters are chosen using only the other samples, and the held-out sample is never used for tuning; if the $R^2$ gains over the base and derivative methods shrink to near zero, the reported improvements are artifacts of tuning on the scored samples.
Extended reading notes
Core claim
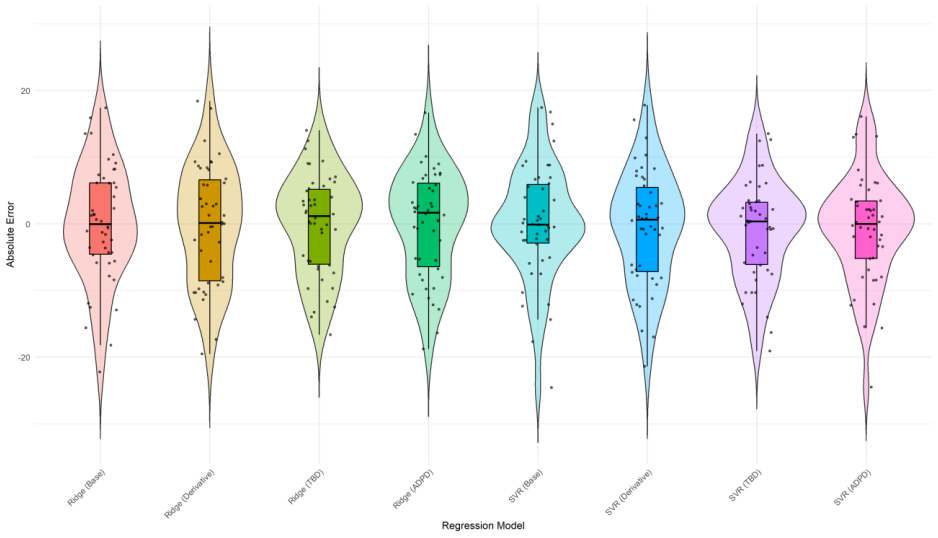
On its own terms, the paper's central claim is that derivative preprocessing works best when it is selective: instead of replacing the absorbance spectrum with its derivative everywhere, the methods keep the original absorbance where the scaled derivative is small and substitute the derivative where it is large (TBD), or downweight the absorbance by an adaptive multiple of the derivative (ADPD). In the reported leave-one-out cross-validation, TBD is the strongest variant: for ridge regression the MSE falls from 75.9 to 55.2 and $R^2$ rises from 0.44 to 0.596, and for SVR the MSE falls from 72.24 to 54.53 and $R^2$ rises from 0.47 to 0.60, corresponding to relative $R^2$ gains of roughly 36% and 27%. The authors interpret this as the methods balancing the molecular-composition information carried by absorption peaks against the resolving power of the first derivative.
Load-bearing premise
The load-bearing assumption is that the reported leave-one-out scores honestly measure how well the method will predict on new people, even though the same 46 blood samples were used to choose the method settings and then to produce those scores.
Editorial extensions
If this is right
- TBD on SVR yields $R^2 = 0.60$ with MSE 54.53 and MAE 5.63, the best reported numbers in the paper; TBD on ridge yields $R^2 = 0.596$ with MSE 55.2.
- ADPD also outperforms both the raw absorbance and the pure derivative baselines for both models, but by a smaller margin than TBD.
- In the Clarke error grid, TBD leaves both models with zero points outside zone A; in the Parkes type-1 grid it also reaches zero, while in the Parkes type-2 grid it ties the baseline.
- Because the two methods act as a preprocessing stage before PCA and the regression models, the same features can be paired with other estimators without changing the claimed benefit.
Reading between the lines
- If the gains hold under nested cross-validation, the same threshold-switch idea could be tried on near-infrared spectra or on urine and tissue FTIR, where glucose peaks are similarly weak.
- The TBD switch is a hard binary feature selector; comparing it with a soft-threshold version would show whether the improvement comes from the binary switch or from the derivative scaling itself.
- Because all settings were tuned on the same 46 samples that were then scored, the ranking of TBD over ADPD could shrink, widen, or reverse on a larger cohort with separate training, validation, and test partitions.
Signed reviews
Editorial analysis
A structured set of objections, weighed in public.
Referee Report
Summary. The paper proposes two preprocessing methods, Threshold-Based Derivative (TBD) and Adaptive Derivative Peak Detection (ADPD), that combine mid-infrared absorbance spectra with their first derivatives to improve blood glucose concentration estimation. The methods are evaluated with Ridge Regression and Support Vector Regression under leave-one-out cross-validation (LOOCV) on 46 FTIR spectra from five healthy subjects. The authors report that TBD and ADPD outperform raw absorbance and simple derivative baselines, with lower MSE/MAE, higher R2, and better Clarke and Parkes Error Grid zones, and they argue these gains are clinically meaningful.
Significance. If validated, the two preprocessing ideas are simple and potentially useful additions to the chemometric toolbox for infrared-based glucose sensing. The study includes a straightforward comparison of four feature representations and two regression models, and the use of Clarke and Parkes Error Grids is appropriate for clinical relevance. However, the current evidence is not conclusive: the study uses 46 samples with no independent test set, the hyperparameters are selected with the same LOOCV folds used for evaluation, and the central TBD equation is missing. The reported gains may therefore be artifacts of selection leakage. The paper does not supply code, data, or machine-checked proofs, so reproducibility currently rests entirely on the textual description, which is incomplete.
major comments (4)
- [Section 3, Tables 1-2] The reported LOOCV metrics are not unbiased estimates of generalization because model selection and evaluation share the same folds. Section 3 states "Using LLOC, I identified the hyperparameters for each model," and the text says the PCA component count was adjusted from 1 to 20 "within the hyperparameter tuning process." Thus the TBD threshold τ, ADPD α, PCA dimension, Ridge α, and SVR C/kernel/ε are all chosen using the same 46 samples whose held-out predictions generate Table 2. This selection leakage can inflate R2 by fitting sample-specific idiosyncrasies. A nested cross-validation or a fixed, independent test set is required to support the claimed 24–36% improvements.
- [Section 2.4] The TBD transformation equation is missing. After the sentence "Mathematically, this can be represented as follows:" the equation is absent, leaving only the variable definitions. Without the explicit formula for the threshold-based combination of A and dA/dν, the method cannot be reproduced or independently verified. Please provide the full equation, including the exact condition and output value for both branches.
- [Section 2.1] The sample-exclusion rule is under-specified. The text says four samples were eliminated "since they did not fit the requirements for inclusion," but no criteria are given. With only 50 samples originally and 46 used in all analyses, the exclusion rule can materially affect the conclusions. The authors should state the inclusion/exclusion criteria and, ideally, show that the main results are robust to the exclusion decision.
- [Section 3, Table 3] The clinical-accuracy claim is overstated relative to the evidence. The differences in Table 3 are at most one point in any error-grid zone (and some cells show the baseline method performing equally or better), yet the text repeatedly says TBD and ADPD "significantly outperform" conventional methods. No significance test or confidence interval is provided for these counts. The authors should either tone down the language or supply a statistical analysis (e.g., a bootstrap or McNemar-style test on zone membership).
minor comments (5)
- [Section 2.6] The text says the models were evaluated using "Root Mean Square Error (MSE)" and then lists MSE and MAE. The acronym RMSЕ is not defined, and it is unclear whether Table 2 reports MSE or RMSE, since the equations and captions are inconsistent.
- [Section 3] There are several typos and inconsistencies: "LLOC" should be "LOOCV", "EMSE" should be "MSE", "Absolye" should be "Absolute", and "Tabel" should be "Table". These should be corrected throughout.
- [Section 2.5] The ADPD formula y = x − αz ∙ x is ambiguous because of operator precedence. Please write it as y = x − α · (z · x) or y = x · (1 − αz), with a clear statement of which form is intended.
- [Abstract] The phrase "these Ridge Regression values were between 36% and 24%" is unclear. It would be better to report the actual R2 values and the absolute or relative improvements with a clear notation, e.g., "increasing R2 from 0.44 to 0.60 (a 36% relative increase)".
- [Section 2.6] The statement "This ensures that no information from the valid data leaked into the training process" appears to contain a typo: "valid" should be "validation" or "test" data.
Circularity Check
Model selection and evaluation share the same LOOCV loop, so the reported TBD/ADPD gains are partly fitted values rather than independent predictions.
-
fitted input called prediction
[Section 3 'Results and discussion', Table 1 and Table 2; see also Sections 2.4-2.5 for TBD/ADPD parameters]
"Using LLOC, I identified the hyperparameters for each model, with their ranges displayed in Table 1. Additionally, I have included the ranges for both TBD and ADPD in Table."
The LOOCV loop that produces the Table 2 metrics is the same loop used to select the TBD threshold τ, the ADPD α, the PCA component count (1–20), the Ridge α, and the SVR C/kernel/ε (Table 1). Tuning these parameters by minimizing MSE on the same 46 samples and then reporting LOOCV MSE/MAE/R2 of the chosen configuration turns the reported 'predictions' into optimized fits rather than out-of-sample predictions. Configurations that exploit sample-specific idiosyncrasies will look better in this LOOCV than on new spectra, so the claimed R2 gains (36% Ridge, 27% SVR) are at least partly selection artifacts. No nested CV or independent test set is provided to separate tuning from evaluation.
full rationale
The paper's central derivation—TBD/ADPD preprocessing plus PCA plus Ridge/SVR—is self-contained and does not rest on self-citations or on a prior theorem. The TBD and ADPD formulas are new combinations of absorbance and derivative, and the reported improvements are not definitional identities. The circularity is statistical: the claim 'TBD and ADPD significantly outperform conventional methods' is supported by LOOCV metrics, but the LOOCV loop was also used to choose the preprocessing thresholds, PCA dimensionality, and regression hyperparameters. The paper explicitly states 'Using LLOC, I identified the hyperparameters for each model' and that PCA component count was adjusted 'within the hyperparameter tuning process' to optimize MSE. Because the same 46-sample folds are used for both selection and evaluation, the selected configuration is optimized on the evaluation criterion, so Table 2's metrics are not unbiased estimates of generalization. This is fitted-input-called-prediction rather than full definitional circularity, and the authors' own limitation note only mentions small dataset size and MIR focus, not the selection-evaluation overlap. Score 6 reflects partial circularity: the reported gains are partly fitted values, but the method itself has independent algorithmic content.
Assumptions & free parameters
free parameters (7)
- TBD threshold tau =
not reported, tuning range 0.02-0.3
- ADPD scaling alpha =
not reported, tuning range 0-70
- Savitzky-Golay window size =
100
- Derivative scaling factor =
100
- PCA component count =
not reported, range 1-20
- Ridge regularization alpha =
not reported, tuning range 10-100
- SVR hyperparameters C, epsilon, kernel =
C 0-2, epsilon 0.1-0.5, kernel linear/RBF/poly
assumptions (6)
- domain assumption Absorbance conversion A = -log10(T) and rubber-band, min-max, and Savitzky-Golay preprocessing preserve glucose-related signal while removing baseline and noise.
- domain assumption Reference blood glucose values from a standard glucometer are accurate enough to serve as training labels and clinical ground truth.
- domain assumption The 46 retained samples from five healthy subjects aged 21-28 with glucose 72-125 mg/dL are representative enough to support clinical accuracy claims.
- domain assumption LOOCV with hyperparameter selection on the same 46 samples gives an unbiased estimate of generalization performance.
- domain assumption PCA dimensionality reduction from 1 to 20 components can be chosen by minimizing MSE within the same LOOCV without leaking test information.
- standard math Standard mathematical machinery of Ridge regression, SVR, and Clarke/Parkes error grids is used as published.
Cite this review
Pith. "Pith review of Derivative-Based Mir Spectroscopy for Blood Glucose Estimation Using Pca-Driven Regression Models." pith.science (2026). https://pith.science/paper/CTMV3NA3
@misc{pith2026241207821,
  author       = {Pith},
  title        = {Pith review of: Derivative-Based Mir Spectroscopy for Blood Glucose Estimation Using Pca-Driven Regression Models},
  year         = {2026},
  howpublished = {\url{https://pith.science/paper/CTMV3NA3}},
  note         = {Machine review of arXiv:2412.07821}
}
read the original abstract
In this study, we presented two innovative methods, which are Threshold-Based Derivative (TBD) and Adaptive Derivative Peak Detection(ADPD), that enhance the accuracy of Learning models for blood glucose estimation using Mid-Infrared (MIR) spectroscopy. In these presented methods, we have enhanced the model's accuracy by integrating absorbance data and its differentiation with critical points. Blood samples were characterized with Fourier Transform Infrared (FTIR) spectroscopy and advanced preprocessing steps. The learning models were Ridge Regression and Support Vector Regression(SVR) using Leave-One-out Cross-Validation. Results exhibited that TBD and ADPD significantly outperform basic used methods. For SVR, the TBD increased the r2 score by around 27%, and ADPD increased it by around 10%. these Ridge Regression values were between 36% and 24%. In addition, Results demonstrate that TBD and ADPD significantly outperform conventional methods, achieving lower error rates and improved clinical accuracy, validated through Clarke and Parkes Error Grid Analysis.
Figures


Figures from the paper (3 more)


Reference graph
Works this paper leans on
-
[1]
Mid-infrared photonic chip for label-free glucose sensing
Pao Lin. Mid-infrared photonic chip for label-free glucose sensing. page JW3A.11, 01 2018
work page 2018
-
[2]
Jiming Sa, Yuyan Song, Hanwen Gu, and Zhushanying Zhang. Mid -infrared spectroscopy with an effective variable selection method based on mpa for glucose detection. Chemometrics and Intelligent Laboratory Systems, 233:104731, 2023
work page 2023
-
[3]
Noor Nazurah Mohd Yatim, Z ainiharyati Mohd Zain, Mohd Zuli Jaafar, Zalhan Md Yusof, Abdur Rehman Laili, Muhammad Hafiz Laili, and Mohd Hafizulfika Hisham. Noninvasive glucose level determination using diffuse reflectance near infrared spectroscopy and chemometrics analysis based on in vitro sample and human skin. pages 30–35, 2014
work page 2014
-
[4]
Peura, Günther Janatsch, Jürgen D
Prashant Bhandare, Yitzhak Mendelson, Robert A. Peura, Günther Janatsch, Jürgen D. Kruse -Jarres, Ralf Marbach, and H. Michael Heise. Multivariate determination of glucose in whole blood using partial leas t- squares and artificial neural networks based on mid -infrared spectroscopy. Appl. Spectrosc., 47(8):1214–1221, Aug 1993
work page 1993
-
[5]
Guang Han, Siqi Chen, Xiaoyan Wang, Jinhai Wang, Huiquan Wang, and Zhe Zhao. Noninvasive blood glucose sensing by near -infrared spectr oscopy based on plsr combines sae deep neural network approach. Infrared Physics Technology, 113:103620, 2021
work page 2021
-
[6]
Bitewulign Kassa Mekonnen, Webb Yang, Tung -Han Hsieh, Shien -Kuei Liaw, and Fu -Liang Yang. Accurate prediction of glucose concentration and identi fication of major contributing features from hardly distinguishable near-infrared spectroscopy. Biomedical Signal Processing and Control, 59:101923, 2020
work page 2020
-
[7]
Non-invasive blood glucose measurement based on mid-infrared spectroscopy
Yang Chen, Jiang Liu, Zhenni Pan, and Shirgeru Shimamoto. Non-invasive blood glucose measurement based on mid-infrared spectroscopy. pages 1–5, 2020
work page 2020
-
[8]
Douglas Carvalho Caixeta, Cassio Lima, Yun Xu, Marco Guevara -Vega, Foued Salmen Espindola, Royston Goodacre, Denise Maria Zezell, and Robinson Sabino -Silva. Monitoring glucose levels in urine using ftir spectroscopy combined with univariate and multivariate statistical methods. Spectrochimica Acta Part A: Molecular and Biomolecular Spectroscopy, 290:122...
work page 2023
Show all 28 references
-
[9]
Mayerhöfer, Harald Mutschke, and Jürgen Popp
Thomas G. Mayerhöfer, Harald Mutschke, and Jürgen Popp. Employing theories far beyond their limits —the case of the (boguer-) beer–lambert law. ChemPhysChem, 17(13):1948–1955, 2016
1948
-
[10]
Study on baseline correction methods for the fourier transform infrared spectra with different signal -to-noise ratios
Xianchun Shen, Shubin Ye, Liang Xu, Rong Hu, Ling Jin, Hanyang Xu, Jianguo Liu, and Wenqing Liu. Study on baseline correction methods for the fourier transform infrared spectra with different signal -to-noise ratios. Applied Optics, 57(20):5794–5799, 2018
2018
-
[11]
Abraham Savitzky and M. J. E. Golay. Smoothing and differentiation of data by simplified least squares procedures. Analytical Chemistry, 36(8):1627–1639, 1964
1964
-
[12]
Jian Zhang and Abdul M. Mouazen. Fractional -order savitzky–golay filter for pre -treatment of on -line vis–nir spectra to predict phosphorus in soil. Infrared Physics Technology, 131:104720, 2023
2023
-
[13]
Abdul Rohman and Y. B. Che Man. Determination of extra virgin olive oil in quaternary mixture using ftir spectroscopy and multivariate calibration. Journal of Spectroscopy, 26(3):471376, 2011
2011
-
[14]
Detection of orange essential oil, isopropyl myristate, and benzyl alcohol in lemon essential oil by ftir spectroscopy combined with chemometrics
Nur Cebi, Osman Taylan, Mona Abusurrah, and Osman Sagdic. Detection of orange essential oil, isopropyl myristate, and benzyl alcohol in lemon essential oil by ftir spectroscopy combined with chemometrics. Foods, 10(1), 2021
2021
-
[15]
Garcia Martinez and Ihtesham Ur Rehman
Zanyar Movasaghi Shazza Rehman Abdullah Chandra Sekhar Talari, Marcela A. Garcia Martinez and Ihtesham Ur Rehman. Advances in fourier transform infrared (ftir) spectroscopy of biological tissues. Applied Spectroscopy Reviews, 52(5):456–506, 2017
2017
-
[16]
A single wavelen gth mid -infrared photoacoustic spectroscopy for noninvasive glucose detection using machine learning
Abdulrahman Aloraynan, Shazzad Rassel, Chao Xu, and Dayan Ban. A single wavelen gth mid -infrared photoacoustic spectroscopy for noninvasive glucose detection using machine learning. Biosensors, 12(3), 2022
2022
-
[17]
Impact of uas image orientation on´ accuracy of forest inventory attributes
Luka Jurjevic, Mateo Gašparovi´ c, Anita Simic Milas, and Ivan Balenovi´ c. Impact of uas image orientation on´ accuracy of forest inventory attributes. Remote Sensing, 12(3), 2020
2020
-
[18]
Application of near infrared spectroscopy combined with partial least squares in quantitative analysis of polysaccharide in irpex lacteus fr
Jia Song, Lin -na Du, Hong -bin Wang, Jia -hui Lu, and Wei Han. Application of near infrared spectroscopy combined with partial least squares in quantitative analysis of polysaccharide in irpex lacteus fr. mycelia. In 2010 International Conference on Artificial Intelligence an...
2010
-
[20]
Willmott and Kenji Matsuura
Cort J. Willmott and Kenji Matsuura. Advantages of the mean absolute error (mae) over the root mean square error (rmse) in assessing average model performance. Climate Research, 30(1):79–82, 2005
2005
-
[21]
Michael A. Babyak. What you see may not be what you get: a brief, nontechnical introduction to overfitting in regression-type models. Psychosomatic Medicine, 66(3):411–421, May-Jun 2004
2004
-
[22]
Ridge regression: Biased estimation for nonorthogonal problems
Arthur E Hoerl and Robert W Kennard. Ridge regression: Biased estimation for nonorthogonal problems. Technometrics, 12(1):55–67, 1970
1970
-
[23]
Thissen, M
U. Thissen, M. Pepers, B. Üstün, W.J. Melssen, and L.M.C. Buydens. Comparing support vector machines to pls for spectral regression applications. Chemometrics and Intelligent Laboratory Systems, 73(2):169–179, 2004
2004
-
[24]
Support vector method for function approximation, regression estimation and signal processing
Vladimir Vapnik, Steven Golowich, and Alex Smola. Support vector method for function approximation, regression estimation and signal processing. 9, 1996
1996
-
[25]
Support vector regression machines
Harris Drucker, Christopher JC Burges, Lind a Kaufman, Alexander Smola, and Vladimir Vapnik. Support vector regression machines. In Advances in neural information processing systems, volume 9, pages 155–161, 1997
1997
-
[26]
Determination of protein and glucose of tuber and root flours using nir and mir spectroscopy
Retno Endah Masithoh, Heru Zaki Amanah, Woo-Sik Yoon, et al. Determination of protein and glucose of tuber and root flours using nir and mir spectroscopy. Infrared Physics & Technology, 113:103577, 2020
2020
-
[27]
W. L. Clarke, D. Cox, L. A. Gonder-Frederick, W. Carter, and S. L. Pohl. Evaluating clinical accuracy of systems for self-monitoring of blood glucose. Diabetes Care , 10(5):622 –628, Sep -Oct 1987. Comparative Study, Journal Article, Research Support, U.S. Gov’t, P.H.S. 13
1987
-
[28]
J. L. Parkes, S. L. Slatin, S. Pardo, and B. H. Ginsberg. A new consensus error grid to evaluate the clinical significance of inaccuracies in the measurement of blood glucose. Diabetes Care, 23(8):1143–1148, Aug 2000. Clinical Trial, Comparative Study, Journal Article
2000
-
[29]
Technical aspects of the parkes error grid
Andreas Pfützner, David C Klonoff, Scott Pardo, and Joan L Parkes. Technical aspects of the parkes error grid. Journal of Diabetes Science and Technology, 7(5):1275–1281, Sep 1 2013. © 2013 Diabetes Technology Society
2013
Reviewed August 11, 2026 · model on record in the stance chip above.
Discussion (0). Continue with ORCID to comment.