Time-dependent weighted directed networks of cryptocurrency interaction from high-frequency returns
Pith reviewed 2026-06-25 19:55 UTC · model grok-4.3
The pith
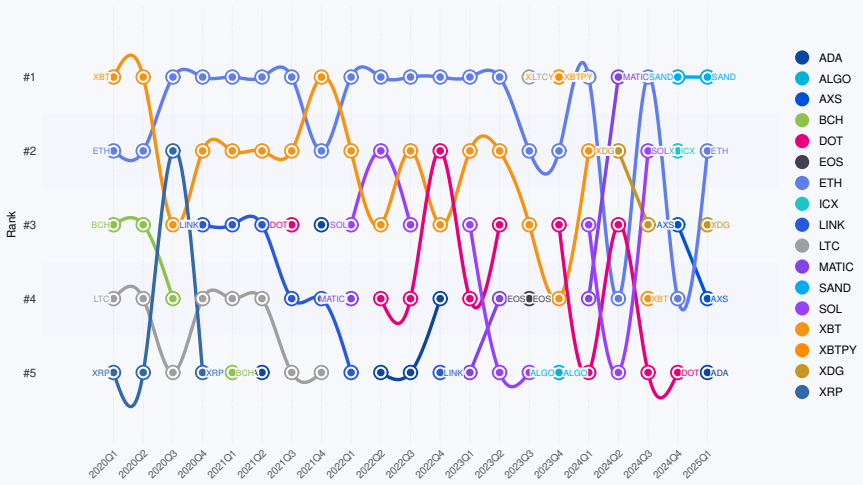
Granger-causality networks from high-frequency returns show Ethereum as the most influential cryptocurrency while Bitcoin's relative importance declines steadily from 2020 to 2025.
A machine-rendered reading of the paper's core claim, the machinery that carries it, and where it could break.
Core claim
Directed and weighted networks constructed from statistically significant Granger causal relationships between cryptocurrency log-returns reveal a dynamically evolving hierarchy of influence in which Ethereum consistently ranks as the most influential asset, Bitcoin exhibits a gradual decline in relative importance, and the ranking structure shows substantial temporal variability with multiple cryptocurrencies entering and exiting top positions.
What carries the argument
Directed weighted networks whose edges are statistically significant Granger causal links between log-returns, with nodal out-strength serving as the measure of influence.
If this is right
- A small subset of cryptocurrencies accounts for a disproportionate share of directed influence in the market.
- Market leadership is non-stable, with frequent changes in which assets occupy the highest ranks.
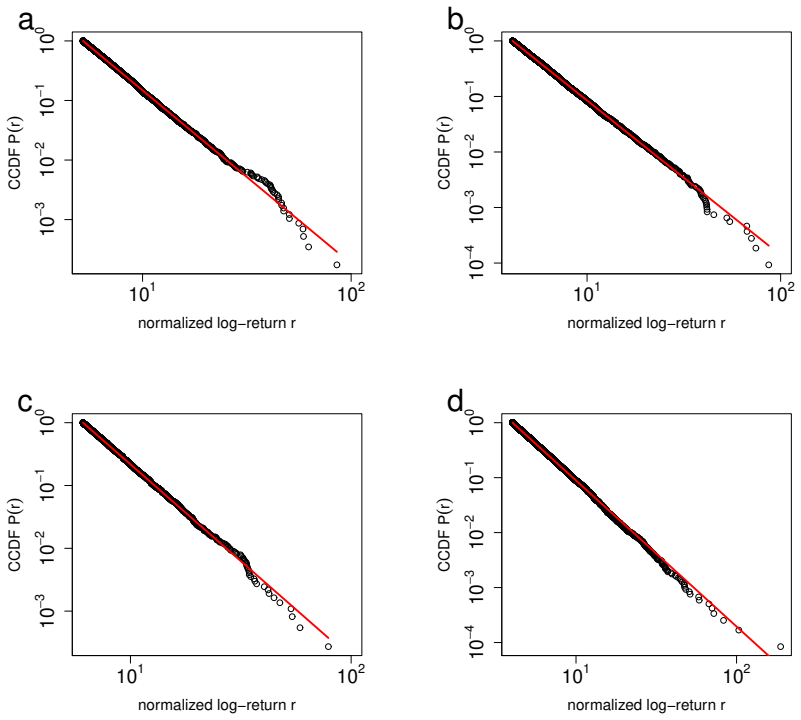
- Normalized returns remain heavy-tailed even after network construction, consistent with known financial stylized facts.
- The organization of the cryptocurrency ecosystem is competitive rather than dominated by any permanent leader.
- Out-strength rankings derived from these networks provide a quantitative description of evolving influence flows.
Where Pith is reading between the lines
- The observed temporal variability implies that any static snapshot of influence would quickly become outdated for monitoring or risk purposes.
- If the networks capture genuine predictive structure, they could be used to test whether influence measured this way improves forecasts of volatility spillovers between assets.
- The concentration of out-strength in a few nodes raises the question of how resilient the overall market remains when those central assets experience large shocks.
- Extending the same Granger-network construction to include traditional financial assets would show whether crypto influence remains internally driven or couples to broader markets.
Load-bearing premise
Statistically significant Granger causal relationships between log-returns accurately quantify the flow of influence across assets without being driven by common external shocks, microstructure noise, or multiple-testing artifacts.
What would settle it
If the detected Granger causalities and the resulting out-strength rankings vanish or reorder after the returns are orthogonalized to common market factors or after microstructure noise is removed, the claimed influence hierarchy would be falsified.
Figures


read the original abstract
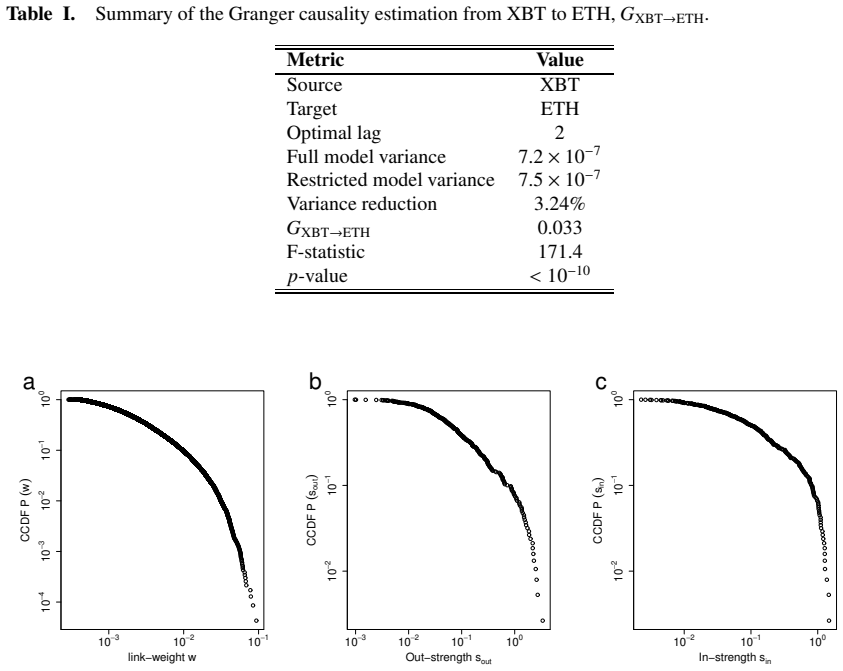
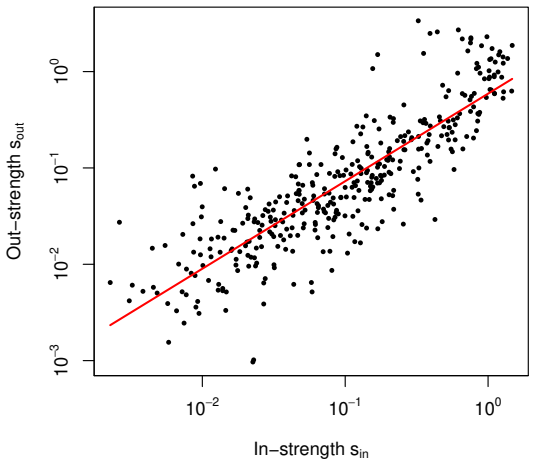
We investigate the evolving structure of interactions in cryptocurrency markets using a network-based framework constructed from high-frequency price data spanning 2020-2025. Directed and weighted networks are constructed from statistically significant Granger causal relationships between cryptocurrency log-returns, enabling us to quantify the flow of influence across assets. We find that normalized returns exhibit heavy-tailed distributions, consistent with the presence of large intermittent fluctuations and in line with stylized facts of financial markets. The resulting networks display pronounced heterogeneity in link weights and nodal strengths, indicating that a small subset of cryptocurrencies contributes disproportionately to market dynamics. By ranking cryptocurrencies based on their nodal out-strength, we uncover a dynamically evolving hierarchy of influence. Ethereum consistently emerges as the most influential asset, while Bitcoin shows a gradual decline in its relative importance. The ranking structure exhibits substantial temporal variability, with multiple cryptocurrencies entering and exiting the top positions over time. Our findings reveal a highly competitive and non-stable organization of the cryptocurrency ecosystem.
Editorial analysis
A structured set of objections, weighed in public.
Referee Report
Summary. The manuscript constructs time-dependent directed weighted networks from high-frequency cryptocurrency log-returns (2020-2025) by retaining only statistically significant Granger-causal links. It reports heavy-tailed normalized returns, heterogeneous link weights and nodal strengths, and a ranking of assets by out-strength that identifies Ethereum as consistently most influential, Bitcoin as declining in relative importance, and substantial temporal variability in the top ranks, concluding that the ecosystem exhibits a competitive, non-stable organization.
Significance. If the Granger-causality links can be shown to isolate directed influence rather than common shocks or testing artifacts, the work would supply a concrete, time-resolved hierarchy of influence in cryptocurrency markets and document its instability, which is of interest for both market microstructure and systemic-risk studies.
major comments (2)
- [Abstract] Abstract: the central claim that out-strength rankings yield a reliable hierarchy rests on pairwise Granger tests performed across many asset pairs, lags, and rolling windows, yet the text supplies no indication of multiple-testing correction (FDR or Bonferroni) or of the exact test count; without this, the reported temporal variability and specific rankings (Ethereum dominant, Bitcoin declining) cannot be distinguished from false-positive artifacts.
- [Abstract] Abstract: the networks are built from raw log-returns without any reported orthogonalization to a latent market factor or first principal component; in cryptocurrency data dominated by common shocks, significant pairwise links can arise from shared exposure rather than direct causation, directly undermining the interpretation of out-strength as a measure of influence flow.
minor comments (1)
- [Abstract] Abstract: the phrase 'normalized returns exhibit heavy-tailed distributions' is stated without reference to the normalization procedure or the specific tail index estimated, which would help readers assess consistency with known financial stylized facts.
Simulated Author's Rebuttal
We thank the referee for their constructive comments, which highlight important methodological considerations for strengthening the interpretation of our Granger-causality networks. We respond to each major comment below.
read point-by-point responses
-
Referee: [Abstract] Abstract: the central claim that out-strength rankings yield a reliable hierarchy rests on pairwise Granger tests performed across many asset pairs, lags, and rolling windows, yet the text supplies no indication of multiple-testing correction (FDR or Bonferroni) or of the exact test count; without this, the reported temporal variability and specific rankings (Ethereum dominant, Bitcoin declining) cannot be distinguished from false-positive artifacts.
Authors: We agree that multiple testing is a critical issue given the scale of pairwise tests across assets, lags, and rolling windows. The original manuscript does not report any correction procedure or the exact test count. In the revised version we will apply FDR correction at the conventional 5% level and explicitly document the total number of tests performed per window, allowing readers to assess whether the reported rankings and temporal variability remain robust. revision: yes
-
Referee: [Abstract] Abstract: the networks are built from raw log-returns without any reported orthogonalization to a latent market factor or first principal component; in cryptocurrency data dominated by common shocks, significant pairwise links can arise from shared exposure rather than direct causation, directly undermining the interpretation of out-strength as a measure of influence flow.
Authors: The referee correctly notes that common shocks can induce spurious pairwise Granger links. Our current construction follows the direct application of Granger causality to raw log-returns, which is standard in several existing cryptocurrency network studies. To address the concern, the revision will add a robustness section in which returns are first orthogonalized to the first principal component (or a market-factor proxy) before re-estimating the networks; we will then compare the resulting out-strength rankings and temporal variability with the original results. revision: yes
Circularity Check
No significant circularity; derivation is data-driven from observed returns
full rationale
The paper constructs directed networks directly from statistically significant Granger causal links on log-returns, then computes out-strength rankings; no equations, fitted parameters, or self-citations are shown that would make the hierarchy or temporal variability equivalent to the inputs by construction. The abstract and description indicate an empirical pipeline without self-definitional steps, fitted-input predictions, or ansatz smuggling.
Axiom & Free-Parameter Ledger
axioms (1)
- domain assumption Granger causality on log-returns captures directed influence between assets
Reference graph
Works this paper leans on
-
[1]
Easwaran, M
S. Easwaran, M. Dixit and S. Sinha, Bitcoin dynamics: the inverse square law of price fluctuatio ns and other stylized facts , in Econophysics and data driven modelling of market dynamics , Cham: Springer International Publishing (2015), 121-128
2015
-
[2]
Beguˇ si´ c, Z
S. Beguˇ si´ c, Z. Kostanjˇ car, H.E. Stanley and B. Podobnik, Physica A: Statistical Mechanics and its Appli- cations, 510, 400 (2018)
2018
-
[3]
Kakinaka and K
S. Kakinaka and K. Umeno, Journal of the Physical Society of Japan, 89(2), 024802 (2020)
2020
-
[4]
Scagliarini, G
T. Scagliarini, G. Pappalardo,A. E. Biondo, A. Pluchino , A. Rapisarda, and S. Stramaglia, Scientific Re- ports 12 (1), 18483 (2022)
2022
-
[5]
Chakraborty, T
A. Chakraborty, T. Hatsuda and Y . Ikeda Scientific Report s 13, 4718 (2023)
2023
-
[6]
Chakraborty, T
A. Chakraborty, T. Hatsuda and Y . Ikeda Physica A: Statis tical Mechanics and its Applications, 639, 129686 (2024)
2024
-
[7]
Chakraborty, T
A. Chakraborty, T. Hatsuda and Y . Ikeda JPS Conf. Proc. 40, 011003 (2023)
2023
-
[8]
Chakraborty and Y
A. Chakraborty and Y . Ikeda JPS Conf. Proc. 43, 011010 (2024)
2024
-
[9]
Ikeda and A Chakraborty, JPS Conf
Y . Ikeda and A Chakraborty, JPS Conf. Proc. 40, 011004 (2023)
2023
-
[10]
Laloux, P
L. Laloux, P . Cizeau, J. P . Bouchaud, and M Potters, PRL 83, 1467 (1999)
1999
-
[11]
Plerou, P
V . Plerou, P . Gopikrishnan, B. Rosenow, L. A. N. Amaral, and H. E. Stanley, PRL 83, 1471 (1999)
1999
-
[12]
Chakraborty, S
A. Chakraborty, S. Easwaran, and S. Sinha, Phys. A: Stat . Mech. its Appl. 509, 599 (2018)
2018
-
[13]
Chakraborty, S
A. Chakraborty, S. Easwaran, and S. Sinha, Acta Phys. Po lonica A 138, 105 (2020)
2020
-
[14]
Hamilton, J. D. (2020). Time series analysis. Princeto n university press
2020
-
[15]
C. W . J. Granger, Econometrica 37, 424 (1969)
1969
-
[16]
Ghoshal and A
G. Ghoshal and A. L. Barab´ asi, Nature communications 2(1), 394 (2011)
2011
- [17]
-
[18]
Dickey and W .A
D.A. Dickey and W .A. Fuller, Journal of the American Sta tistical Association 74, 427 (1979)
1979
-
[19]
Schwarz, The annals of statistics 461 (1978)
G. Schwarz, The annals of statistics 461 (1978)
1978
-
[20]
Benjamini, and Y
Y . Benjamini, and Y . Hochberg, J. Roy. Statist. Soc. Ser. B 57(1) 289 (1995)
1995
-
[21]
Gopikrishnan, M
P . Gopikrishnan, M. Meyer, L. N. Amaral and H. E. Stanley, The European Physical Journal B-Condensed Matter and Complex Systems 3(2) 139 (1998)
1998
-
[22]
R. K. Pan and S. Sinha, Physica A: Statistical Mechanics and Its Applications 387, 2055 (2008). 11
2055
discussion (0)
Sign in with ORCID, Apple, or X to comment. Anyone can read and Pith papers without signing in.