Forecasting threshold exceedance of atmospheric variables at a specific location
Pith reviewed 2026-06-28 20:04 UTC · model grok-4.3
The pith
Modeling the full conditional distribution outperforms direct binary classification when forecasting rare threshold exceedances of atmospheric variables.
A machine-rendered reading of the paper's core claim, the machinery that carries it, and where it could break.
Core claim
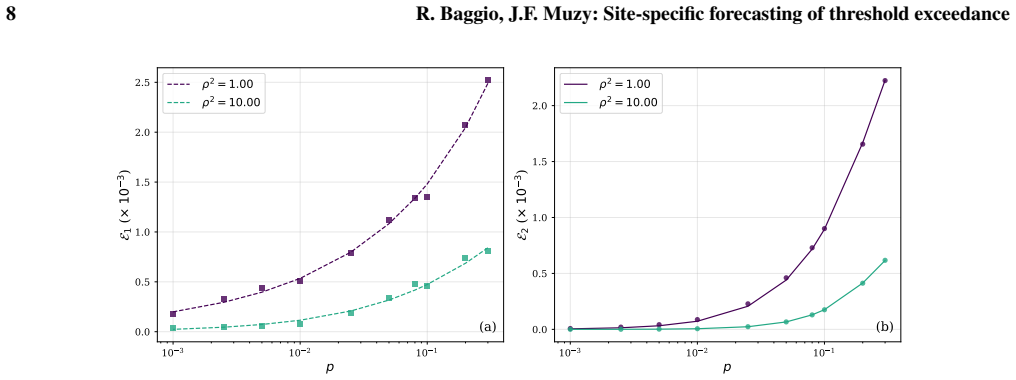
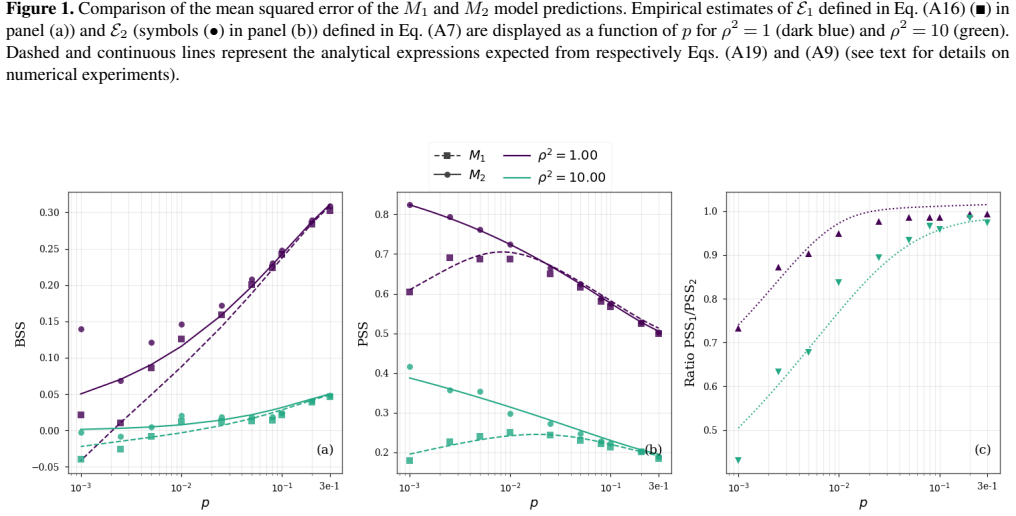
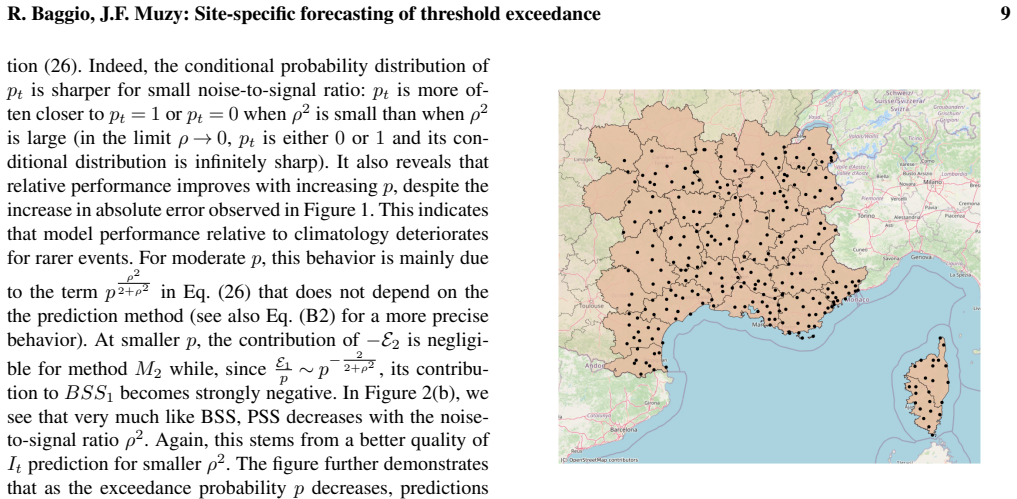
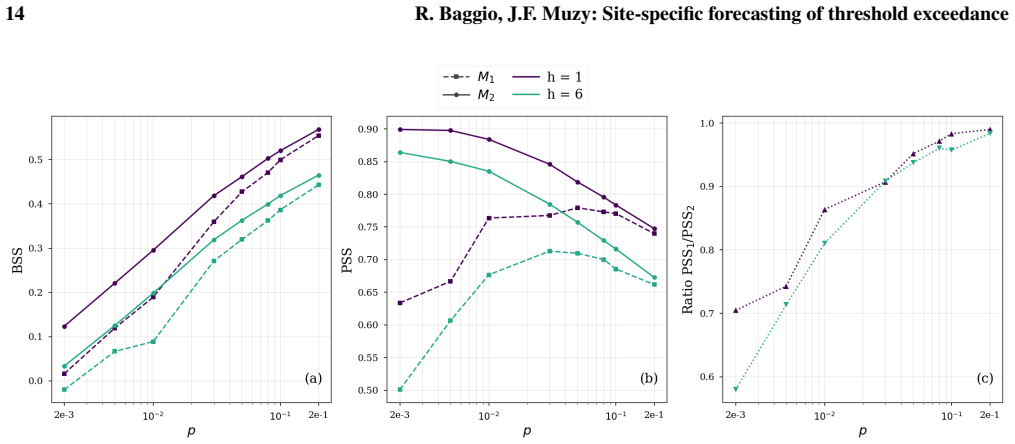
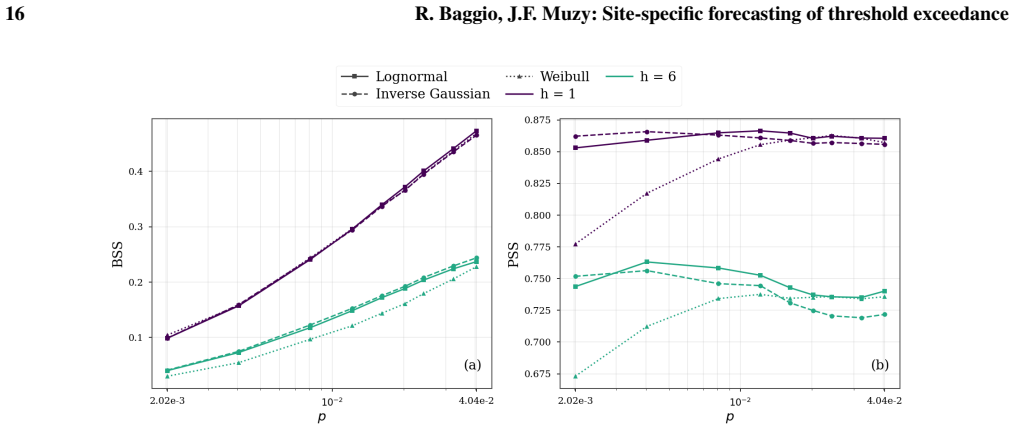
The full distribution approach consistently outperforms the direct method for rare, extreme events. This advantage arises because the full distribution approach effectively learns the parameters of the conditional distribution from moderate and mild intensity events, thereby achieving better calibration and discrimination in the tails. The specific parametric shape of the chosen distribution plays a secondary role compared to accurately capturing predictable shifts in its bulk properties (mean and variance). This empirical indistinguishability suggests that extreme exceedances are primarily driven by significant conditional displacements of the entire distribution rather than by unpredictabl
What carries the argument
The full conditional probability distribution of the atmospheric variable, from which exceedance probabilities are obtained after fitting its parameters to observed conditions.
If this is right
- The performance gain appears in both proper scoring rules such as Brier score and logarithmic score and in deterministic skill scores such as Peirce Skill Score, CSI and HSS.
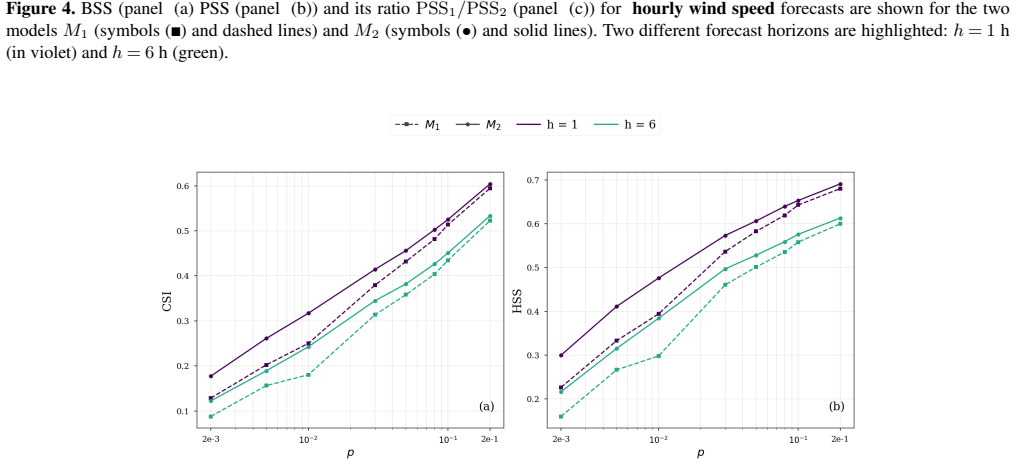
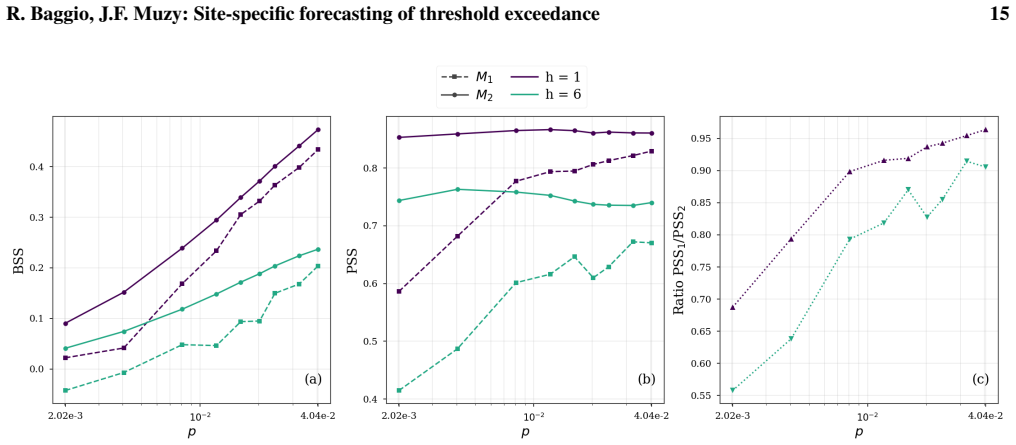
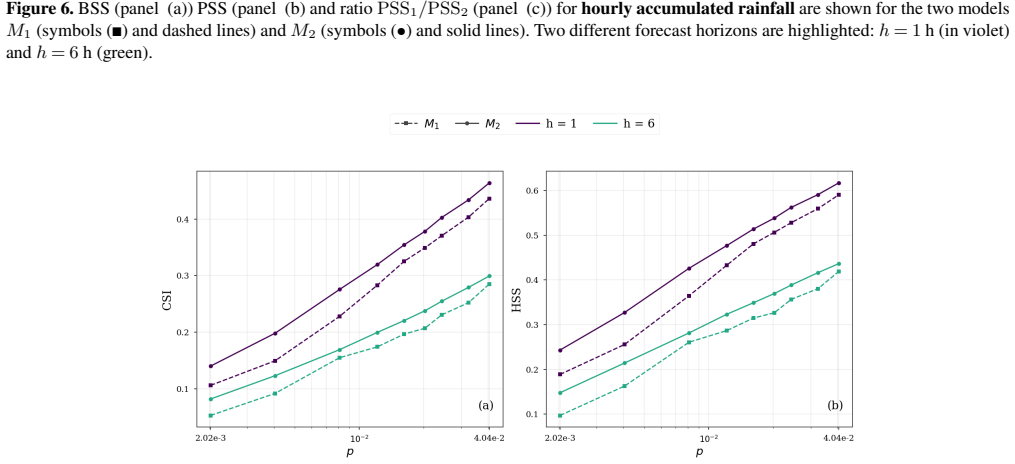
- The same pattern holds for strong surface wind speeds and for intense hourly rainfall.
- Capturing conditional shifts in mean and variance matters more for tail accuracy than the precise functional form of the distribution.
- Extreme events are generated mainly by bulk displacements of the conditional distribution rather than by rare, unpredictable tail anomalies.
Where Pith is reading between the lines
- Operational forecasting centers could adopt full-distribution models as the default even when the operational need is only for exceedance probabilities.
- The result suggests that climate-model output should be post-processed by shifting entire distributions rather than by applying separate tail corrections.
- The approach could be tested on other variables or regions by checking whether moderate-event statistics alone suffice to predict tail frequencies.
Load-bearing premise
Predictable shifts in the mean and variance of the conditional distribution fully explain tail exceedances, with no substantial contribution from unpredictable fat-tailed anomalies within a static climatology.
What would settle it
A verification dataset in which the observed frequency of extreme exceedances deviates systematically from the rates predicted by fitting a distribution to moderate events and shifting only its mean and variance.
Figures
read the original abstract
This study compares two methodological approaches for predicting, at a given site, threshold exceedances of atmospheric variables such as temperature and wind speed: (i) direct probabilistic methods, which treat exceedance as a binary classification problem, and (ii) full distribution probabilistic methods, which model the complete conditional probability law of the target variable. Using theoretical analysis and numerical simulations on a toy model, alongside real-world data from the MeteoNet dataset (2016--2018) for southeastern France, we demonstrate that the full distribution approach consistently outperforms the direct method for rare, extreme events. This advantage arises because the full distribution approach effectively learns the parameters of the conditional distribution from moderate and mild intensity events, thereby achieving better calibration and discrimination in the tails. We find that the specific parametric shape of the chosen distribution plays a secondary role compared to accurately capturing predictable shifts in its bulk properties (i.e., mean and variance). This empirical indistinguishability is also informative about the physical mechanics driving atmospheric extremes, suggesting that extreme exceedances are primarily driven by significant conditional displacements of the entire distribution rather than by unpredictable, fat-tailed anomalies within a static climatology. Our results are validated for both strong surface wind speeds and intense hourly rainfall, with performance evaluated using proper scoring rules (Brier score, logarithmic score) and deterministic skill scores (Peirce Skill Score, CSI, HSS). These findings highlight the critical importance of modeling the full probability distribution for rare-event forecasting and provide practical guidance for improving extreme weather prediction in operational meteorology.
Editorial analysis
A structured set of objections, weighed in public.
Referee Report
Summary. This paper compares two approaches for site-specific forecasting of threshold exceedances in atmospheric variables (e.g., wind speed, rainfall): direct probabilistic methods that frame the problem as binary classification versus full-distribution methods that model the entire conditional law. Through theoretical analysis, toy-model simulations, and empirical validation on the MeteoNet dataset (southeastern France, 2016–2018), it claims that full-distribution methods consistently outperform direct methods for rare extremes because they learn conditional parameters more efficiently from bulk data. The paper further concludes that the specific parametric family is secondary to accurate capture of mean/variance shifts, implying that extremes arise primarily from predictable conditional displacements rather than from unpredictable fat-tailed anomalies in a static climatology. Results are assessed with proper scores (Brier, logarithmic) and deterministic skill scores (PSS, CSI, HSS).
Significance. If the empirical performance comparison holds, the work would supply practical guidance for operational extreme-weather forecasting by favoring full-distribution modeling. The use of proper scoring rules, toy-model controls, and real-data validation on two variables strengthens the central performance claim. The additional physical-mechanism interpretation could influence how conditional distributions are specified in meteorological models, provided the tail-adequacy assumptions are verified.
major comments (1)
- [abstract, final paragraph] Abstract, final paragraph: the claim that the results are 'also informative about the physical mechanics driving atmospheric extremes' (i.e., that exceedances are 'primarily driven by significant conditional displacements of the entire distribution rather than by unpredictable, fat-tailed anomalies within a static climatology') rests on the untested premise that the chosen parametric families are adequate in the tails. No tail-specific calibration diagnostics, quantile-quantile checks, or comparisons against heavier-tailed alternatives are described for the MeteoNet wind/rainfall cases; without these, the physical inference is not load-bearing on the reported experiments.
Simulated Author's Rebuttal
We thank the referee for the constructive feedback on our manuscript. The core empirical and theoretical results comparing full-distribution versus direct classification methods remain unchanged and are supported by the experiments. We agree that the physical-mechanics interpretation requires qualification, as it was not buttressed by explicit tail diagnostics, and we will revise the abstract accordingly.
read point-by-point responses
-
Referee: [abstract, final paragraph] Abstract, final paragraph: the claim that the results are 'also informative about the physical mechanics driving atmospheric extremes' (i.e., that exceedances are 'primarily driven by significant conditional displacements of the entire distribution rather than by unpredictable, fat-tailed anomalies within a static climatology') rests on the untested premise that the chosen parametric families are adequate in the tails. No tail-specific calibration diagnostics, quantile-quantile checks, or comparisons against heavier-tailed alternatives are described for the MeteoNet wind/rainfall cases; without these, the physical inference is not load-bearing on the reported experiments.
Authors: We concur that the physical interpretation advanced in the final paragraph of the abstract is not directly load-bearing on the reported experiments. The performance advantage of full-distribution modeling, the toy-model analysis, and the scoring-rule comparisons hold under the parametric families employed (normal for wind speed, gamma for rainfall) without requiring tail-specific validation. However, the stronger claim that this indistinguishability informs the physical mechanism—i.e., that extremes arise mainly from conditional mean/variance shifts rather than static fat tails—does presuppose that the chosen families adequately describe the upper tail. Because we did not include QQ diagnostics, tail-calibration plots, or comparisons against heavier-tailed alternatives (e.g., GEV or log-normal), the inference should be presented as a hypothesis rather than a direct conclusion. We will therefore revise the abstract to remove or substantially qualify the physical-mechanics sentence, limiting the discussion to the methodological performance results. This revision will appear in the next manuscript version. revision: yes
Circularity Check
No circularity detected in the derivation chain
full rationale
The paper's central results consist of an empirical performance comparison between direct binary classification and full-distribution modeling on held-out MeteoNet data (2016-2018) plus toy-model simulations, evaluated with independent proper scoring rules (Brier, log score) and skill scores. The claim that full-distribution methods outperform for extremes because they learn bulk parameters from moderate events is a direct statistical outcome on external test data, not a quantity defined in terms of itself. The physical-mechanism interpretation (conditional mean/variance shifts vs. fat tails) is presented as an inference from the observed empirical indistinguishability of parametric families, without any self-definitional equation, fitted-input prediction, or load-bearing self-citation. No steps match the enumerated circularity patterns.
Axiom & Free-Parameter Ledger
axioms (1)
- domain assumption The conditional distribution of the target variable admits a parametric form whose bulk parameters (mean, variance) are predictable from covariates.
Reference graph
Works this paper leans on
- [1]
-
[2]
Baggio, R. and Muzy, J.-F.: Improving probabilistic wind speed forecasting using M-Rice distribution and spa- tial data integration, Applied Energy, 360, 122 840, https://doi.org/10.1016/j.apenergy.2024.122840,
- [3]
-
[4]
Baïle, R., Muzy, J. F., and Poggi, P.: An M-Rice wind speed frequency distribution, Wind Energy, 14, 735–748, https://doi.org/10.1002/we.454,
-
[5]
Bauer, P., Thorpe, A., and Brunet, G.: The quiet revolu- tion of numerical weather prediction, Nature, 525, 47–55, https://doi.org/10.1038/nature14956,
-
[6]
Baïle, R., Muzy, J. F., and Poggi, P.: Short-term forecasting of sur- face layer wind speed using a continuous random cascade model, Wind Energy, 14, 719–734, https://doi.org/10.1002/we.452,
-
[7]
Bojinski, S., Blaauboer, D., Calbet, X., De Coning, E., Debie, F., Montmerle, T., Nietosvaara, V ., Norman, K., Bañón Peregrín, L., Schmid, F., et al.: Towards nowcasting in Europe in 2030, Mete- orological applications, 30, e2124,
2030
-
[8]
Bouallègue, Z. B., Clare, M. C. A., Magnusson, L., Gascón, E., Maier-Gerber, M., Janoušek, M., Rodwell, M., Pinault, F., Dram- sch, J. S., Lang, S. T. K., Raoult, B., Rabier, F., Chevallier, M., Sandu, I., Dueben, P., Chantry, M., and Pappenberger, F.: The Rise of Data-Driven Weather Forecasting: A First Statistical As- sessment of Machine Learning–Based ...
-
[9]
Bouttier, F. and Marchal, H.: Probabilistic short-range forecasts of high-precipitation events: optimal decision thresholds and predictability limits, Natural Hazards and Earth System Sci- ences, 24, 2793–2816, https://doi.org/10.5194/nhess-24-2793- 2024,
-
[10]
Gneiting, T., Raftery, A. E., III, A. H. W., and Goldman, T.: Cal- ibrated Probabilistic Forecasting Using EMOS and Minimum CRPS Estimation, Monthly Weather Review, 133, 1098–1118, https://doi.org/10.1175/MWR2904.1,
-
[11]
S., and North, G
Kedem, B., Chiu, L. S., and North, G. R.: Estimation of mean rain rate: Application to satellite observations, Journal of Geophysi- cal Research: Atmospheres, 95, 1965–1972,
1965
-
[12]
Lam, R., Sanchez-Gonzalez, A., Willson, M., Wirnsberger, P., For- tunato, M., Alet, F., Ravuri, S., Ewalds, T., Eaton-Rosen, Z., Hu, W., Merose, A., Hoyer, S., Battaglia, P., Vinyals, O., Stott, D., Pritzel, A., Kavukcuoglu, K., and Brandstetter, J.: GraphCast: Learning skillful medium-range global weather forecasting, Sci- ence, 382, 1416–1421, https://d...
-
[13]
Leutbecher, M. and Palmer, T. N.: Ensemble forecast- ing, Journal of Computational Physics, 227, 3515–3539, https://doi.org/10.1016/j.jcp.2007.02.014,
-
[15]
L., Gagne, D
McGovern, A., Elmore, K. L., Gagne, D. J., Haupt, S. E., Karstens, C. D., Lagerquist, R., Smith, T., and Williams, J. K.: Using artifi- cial intelligence to improve real-time decision-making for high- impact weather, Bulletin of the American Meteorological Soci- ety, 98, 2073–2090,
2073
-
[16]
Vishny, D., Morzfeld, M., Gwirtz, K., Bach, E., Dunbar, O
Murphy, A. H.: A new vector partition of the probability score, Journal of Applied Meteorol- ogy, 12, 595–600, https://doi.org/10.1175/1520- 0450(1973)012<0595:ANVPOT>2.0.CO;2,
-
[17]
and Baggio, R.: saphir_predict, https://doi.org/10.5281/zenodo.20327672,
Muzy, J.-F. and Baggio, R.: saphir_predict, https://doi.org/10.5281/zenodo.20327672,
-
[18]
Pang, G., He, J., Huang, Y ., and Zhang, L.: A binary logistic regres- sion model for severe convective weather with numerical model data, Advances in Meteorology, 2019, 6127 281,
2019
-
[19]
Pathak, J., Subramanian, S., Harrington, P., Raja, S., Chattopad- hyay, A., Mardani, M., Kurth, T., Hall, D., Li, Z., Azizzade- nesheli, K., Hassanzadeh, P., Kashinath, K., and Anand, A.: Four- CastNet: Accelerating global high-resolution weather forecast- ing using adaptive Fourier neural operators, npj Climate and At- mospheric Science, 7, 245, https://...
- [20]
-
[21]
Ravuri, S., Lenc, K., Willson, M., Kangin, D., Lam, R., Mirowski, P., Fitzsimons, M., Athanassiadou, M., Kashem, S., Madge, S., Prudden, R., Mandhane, A. S., Clark, A., Brock, A., Simonyan, K., Hadsell, R., Robinson, N., Clancy, E., Are- nas, A., and Pritzel, A.: Skilful precipitation nowcasting us- ing deep generative models of radar, Nature, 597, 672–67...
-
[22]
Schlosser, L., Hothorn, T., Stauffer, R., and Zeileis, A.: Distribu- tional regression forests for probabilistic precipitation forecast- ing in complex terrain, The Annals of Applied Statistics, 13, 1564–1589, https://doi.org/10.1214/19-AOAS1247,
-
[23]
G., Betancourt, C., Gong, B., Kleinert, F., Langguth, M., Leufen, L
Schultz, M. G., Betancourt, C., Gong, B., Kleinert, F., Langguth, M., Leufen, L. H., Mozaffari, A., and Stadtler, S.: Can deep learning beat numerical weather prediction?, Philosoph- ical Transactions of the Royal Society A, 379, 20200 097, https://doi.org/10.1098/rsta.2020.0097,
-
[24]
Seity, Y ., Brousseau, P., Malardel, S., Hello, G., Bénard, P., Bouttier, F., Lac, C., and Masson, V .: The AROME-France Convective- Scale Operational Model, Monthly Weather Review, 139, 976 – 991, https://doi.org/10.1175/2010MWR3425.1,
- [25]
-
[26]
Sukrutha, A., Dyuthi, S. R., and Desai, S.: Multimodel response assessment for monthly rainfall distribution in some selected In- dian cities using best-fit probability as a tool, Applied Water Sci- ence, 8, https://doi.org/10.1007/s13201-018-0789-4,
-
[27]
S.: Statistical methods in the atmospheric sciences, vol
Wilks, D. S.: Statistical methods in the atmospheric sciences, vol. 100, Academic press, 2011
2011
discussion (0)
Sign in with ORCID, Apple, or X to comment. Anyone can read and Pith papers without signing in.