REVIEW 6 major objections 4 minor 32 references
Physics-Informed Machine Learning with Adaptive Grids for Optical Microrobot Depth Estimation
T0 review · 6 major / 4 minor · reviewed 2026-08-05 · deepseek-v4-flash
Pith's one-line read Adding physics-based focus cues on an adaptive grid cuts optical-microrobot depth estimation error by over 60 percent, the paper reports.
desk verdict A plausible incremental method for microrobot depth estimation, but the abstract's headline 'over 60% MSE reduction' only holds for one of three robots and needs correction before the paper is trustworthy. read the letter →
The pith
A machine-rendered reading of the paper's core claim, the machinery that carries it, and where it could break.
The reading
What carries the argument
Adaptive-grid physics-feature module: six focus metrics (entropy, Laplacian of Gaussian, Tenengrad, Brenner measure, grey-level variance, and maximum absolute gradient) are computed per cell of a 6×6 grid over the segmented microrobot and a 4×4 grid over the background, then concatenated with ResNet-50 features before the regression layer. This mechanism carries the argument by translating an optical fact—depth changes alter blur, edge clarity, and intensity spread—into local features that are more learnable and more stable under small training sets.
What would settle it
Occlude or add background clutter so the largest detected contour is no longer the microrobot, then compare depth MSE with and without the physics module; if the module's advantage disappears or reverses whenever segmentation is wrong, the reported gain depends on segmentation reliability rather than on the physics features themselves.
Extended reading notes
Core claim
The paper's central claim is that physically interpretable focus measurements become a powerful depth signal for transparent microrobots when they are computed on a content-adaptive grid and fused with deep features. Rather than treating the whole image uniformly, the method first localizes the microrobot by Gaussian blurring and Otsu thresholding, then tiles the robot's bounding box with a 6×6 grid and the background with a 4×4 grid. Six descriptors—entropy, Laplacian of Gaussian, Tenengrad, Brenner measure, grey-level variance, and maximum absolute gradient—are extracted per cell, concatenated into a global physics feature vector, and concatenated with ResNet-50 features just before the re
Load-bearing premise
The method assumes the Gaussian-blur-plus-Otsu step always isolates the microrobot as the largest detected contour, so the adaptive grid is centered where the depth information actually lives; if segmentation fails under low contrast or clutter, the physics features are computed on the wrong pixels.
Editorial extensions
If this is right
- Depth estimation for optical-tweezer microrobots could become practical with only hundreds of annotated frames rather than thousands, lowering the cost of closed-loop control.
- The plug-and-play feature module can be attached to other convolutional backbones, potentially improving their depth accuracy without retraining them from scratch.
- Because the added features are physically interpretable, prediction errors can be traced to focus or segmentation behavior rather than treated as an opaque network failure.
- Coarse grids over the background reduce computation in uninformative regions, which matters for real-time microscopy during micromanipulation.
- The reported data-efficiency advantage suggests physics-informed priors can substitute for dataset scale in other transparent-object depth tasks.
Reading between the lines
- The same adaptive-grid focus-feature idea likely transfers to other transparent objects such as cells, droplets, or micro-lenses, since defocus blur is a generic depth cue rather than a microrobot-specific one.
- A direct test of the mechanism would be training on one robot's images and testing on another: if the physics features encode general depth cues, the model should transfer better than feature-matched baselines.
- The method's reliance on fixed thresholds for segmentation and grid placement suggests an attention-based or learned segmentation module could extend the gains to cluttered scenes, as the authors themselves note as future work.
- The reported 20%-data result should be read together with the segmentation assumption: in images where the microrobot is not the largest detected contour, the physics features are computed on the wrong region and the advantage may shrink.
Editorial analysis
A structured set of objections, weighed in public.
Referee Report
Summary. This paper proposes a physics-informed depth estimation method for transparent optical microrobots. The method first detects the microrobot via Gaussian blurring, Otsu thresholding, and the largest contour, then constructs an adaptive grid: a 6×6 fine grid over the microrobot region and a 4×4 coarse grid over the background. For each grid cell, six classical focus metrics are computed (entropy, Laplacian of Gaussian, Tenengrad, Brenner measure, grey-level variance, maximum absolute gradient), and the resulting feature vector is concatenated with ResNet-50 features before the final regression layer. The authors report results on three microrobot types, comparing against CNN, ResNet18, and ResNet50 baselines in terms of MSE and R², with ablations over grid granularity and training-set size. The central claims are that the method reduces MSE by over 60%, improves R² across all test cases, and outperforms a full-data ResNet50 when trained on only 20% of the data.
Significance. If the claims are validated, the proposed framework offers a simple, plug-and-play way to inject classical focus cues into a learned depth regressor, with potential to reduce annotation burden in microrobotic perception. The authors provide code, which is a concrete step toward reproducibility, and the adaptive-grid idea is sensible and easy to transfer to other backbones. The experiments span multiple robots and include ablations. However, the headline quantitative claims are not consistent with the paper's own table: the 'over 60% MSE reduction' holds only for Robot 1, not across all test cases, and the data-efficiency result is shown only for Robot 1. The absence of uncertainty estimates, a fully specified baseline, and a robustness check on segmentation further limit the strength of the conclusions as currently stated.
major comments (6)
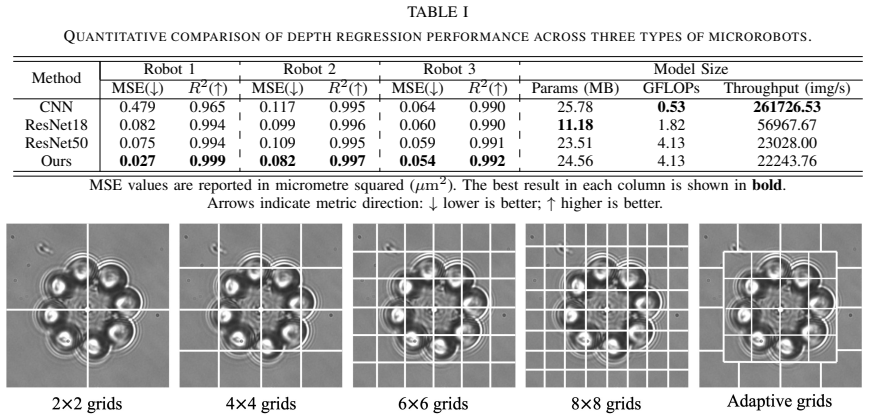
- [Abstract / Table I] The abstract states 'reduces mean squared error (MSE) by over 60%' without qualification. From Table I, the relative MSE reduction versus ResNet50 is 64% for Robot 1 (0.075→0.027), but only about 25% for Robot 2 (0.109→0.082) and 8.5% for Robot 3 (0.059→0.054), for an average of roughly 32%. The R² improvement does hold for all three robots, but the 60% MSE figure is only accurate for the best case. Please either report per-robot reductions or an average with an explicit statement that the 'over 60%' claim refers to Robot 1 only.
- [Table I / Section III-A] No error bars, confidence intervals, or repeated runs are provided for any result. The differences on Robot 3 are small (MSE 0.059 vs 0.054, R² 0.991 vs 0.992) and may be within run-to-run variability. Without uncertainty quantification, the claim that the method 'consistently outperforms' the baselines is not statistically established. Please report means and standard deviations over multiple training runs or at least provide error bars for the main comparison.
- [Table I / Section III-A] The 'CNN' baseline is not defined: the manuscript gives no architecture, input resolution, training regime, or number of parameters for it, and its Robot 1 MSE (0.479) is much larger than the other baselines. In addition, the train/test split is not described for any of the three robots, and dataset sizes are only given for Robot 1 in the data-efficiency experiment. Without these details, the comparison is difficult to reproduce and the relative improvements cannot be independently assessed.
- [Section II-B] The adaptive grid is built from the largest contour detected after Gaussian blurring and Otsu thresholding, with a fixed expansion ratio (1.2) and fixed grid sizes. The Discussion acknowledges that the implementation relies on manually defined thresholds and fixed grid sizes. This is a load-bearing assumption: if segmentation fails under low contrast, clutter, or partial occlusion, the physics features are computed on the wrong regions and the stated advantage may disappear. The manuscript contains no segmentation robustness experiments or failure analysis. Please quantify the segmentation success rate on the test images and show sensitivity to the expansion ratio or threshold settings.
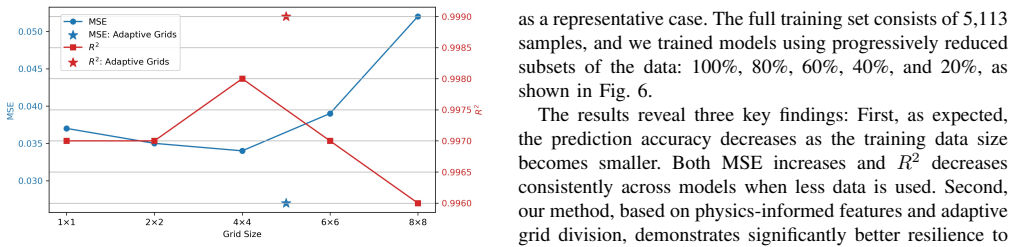
- [Section III-F] The data-efficiency experiment is explicitly performed 'using Robot 1 as a representative case.' Therefore the abstract's claim that 'even when trained on only 20% of the available data, our model outperforms ResNet50 trained on the full dataset' is only demonstrated for one robot, not as a general property across all test cases. Please either add analogous experiments for Robots 2 and 3 or revise the claim to be explicitly Robot-1-specific.
- [Table I / Section III-A] The reported throughput values are physically implausible for a single NVIDIA A100 with FP32 precision. For example, the CNN baseline reports 261,726 images/s at 0.53 GFLOPs; using the A100's approximate FP32 peak of 19.5 TFLOPS, the theoretical upper bound is about 37,000 images/s, so the reported value exceeds the hardware limit by a factor of roughly 7. Similarly, ResNet18 at 56,967 images/s with 1.82 GFLOPs would require over 100 TFLOPS. Please re-measure the throughput, report the measurement methodology more carefully, and clarify whether physics-feature extraction time is included in the GFLOPs and throughput figures.
minor comments (4)
- [Section III-D] The text says 'lowest MSE ... (0.027 µm, 0.999)', but Table I states MSE is in micrometres squared (µm²). Please make the units consistent.
- [Section II-B] The description of how the 6×6 foreground grid and 4×4 background grid are combined is ambiguous. The text says the image is 'divided into two spatial regions' and then 'zero-padding' is used to maintain a fixed number of patches, but it is not clear how patches of different sizes are aligned or concatenated, especially when the bounding-box size varies. Please provide a more precise definition or a pseudocode snippet.
- [Figures 5 and 6] The grid ablation (Fig. 5) and data-size experiments (Fig. 6) are both conducted on Robot 1 only. The figure captions should state this clearly so readers do not generalize the results to all robots.
- [Section III-C] GFLOPs is defined as 'floating point operations per second,' but GFLOPs is a measure of operation count, not throughput. The intended meaning appears to be GFLOP per inference; please correct the terminology.
Circularity Check
No significant circularity: the central regression uses independent physics-based focus features and ground-truth depth; self-citations are not load-bearing.
full rationale
The derivation chain is a supervised regression: depth labels are physical displacements imposed by a piezoelectric stage, and the input features are standard focus metrics (entropy, LoG, Tenengrad, Brenner, variance, max gradient) computed on adaptively partitioned image patches. These features are not defined in terms of the depth labels, nor is any parameter fitted to the test set. The adaptive grid is obtained from Otsu-based segmentation of the microrobot, independent of the training targets. The paper's own Table I provides a direct, self-contained comparison against CNN, ResNet18, and ResNet50, so the central claim does not reduce to a self-citation. References [16], [28], and [29] are prior/companion works by the authors; [29] supplies data-collection details and a benchmark comparison mentioned in the Discussion, but the main quantitative result is supported in this paper's experiments, so the self-citations are not load-bearing. The abstract's 'over 60% MSE reduction' is not supported by Table I for Robots 2 and 3 (about 25% and 8%, respectively), and the 20%-data claim is demonstrated only for Robot 1; however, this is a correctness/overstatement issue, not circularity.
Assumptions & free parameters
free parameters (5)
- bounding box expansion ratio =
1.2
- foreground grid size =
6x6
- background grid size =
4x4
- learning rate =
0.001
- training epochs =
20
assumptions (4)
- domain assumption Defocus blur magnitude correlates monotonically with distance from the focal plane.
- domain assumption The largest contour detected via Otsu thresholding corresponds to the microrobot.
- domain assumption Standard focus metrics (entropy, LoG, Tenengrad, Brenner, variance, max gradient) are sufficient discriminative features for depth.
- domain assumption ResNet-50 pretrained on ImageNet provides useful features for microscopy images.
Cite this review
Pith. "Pith review of Physics-Informed Machine Learning with Adaptive Grids for Optical Microrobot Depth Estimation." pith.science (2026). https://pith.science/paper/DJOY57UW
@misc{pith2026250902343,
  author       = {Pith},
  title        = {Pith review of: Physics-Informed Machine Learning with Adaptive Grids for Optical Microrobot Depth Estimation},
  year         = {2026},
  howpublished = {\url{https://pith.science/paper/DJOY57UW}},
  note         = {Machine review of arXiv:2509.02343}
}
read the original abstract
Optical microrobots actuated by optical tweezers (OT) offer great potential for biomedical applications such as cell manipulation and microscale assembly. These tasks demand accurate three-dimensional perception to ensure precise control in complex and dynamic biological environments. However, the transparent nature of microrobots and low-contrast microscopic imaging challenge conventional deep learning methods, which also require large annotated datasets that are costly to obtain. To address these challenges, we propose a physics-informed, data-efficient framework for depth estimation of optical microrobots. Our method augments convolutional feature extraction with physics-based focus metrics, such as entropy, Laplacian of Gaussian, and gradient sharpness, calculated using an adaptive grid strategy. This approach allocates finer grids over microrobot regions and coarser grids over background areas, enhancing depth sensitivity while reducing computational complexity. We evaluate our framework on multiple microrobot types and demonstrate significant improvements over baseline models. Specifically, our approach reduces mean squared error (MSE) by over 60% and improves the coefficient of determination (R^2) across all test cases. Notably, even when trained on only 20% of the available data, our model outperforms ResNet50 trained on the full dataset, highlighting its robustness under limited data conditions. Our code is available at: https://github.com/LannWei/CBS2025.
Figures


Figures from the paper (3 more)

Reference graph
Works this paper leans on
-
[16]
Data-driven microscopic pose and depth estimation for optical microrobot manipulation,
D. Zhang, F. P.-W. Lo, J.-Q. Zheng, W. Bai, G.-Z. Yang, and B. Lo, “Data-driven microscopic pose and depth estimation for optical microrobot manipulation,” ACS Photonics, vol. 7, no. 11, pp. 3003– 3014, 2020
work page 2020
-
[1]
Advanced medical micro-robotics for early diagnosis and therapeutic interventions,
D. Zhang, T. E. Gorochowski, L. Marucci, H.-T. Lee, B. Gil, B. Li, S. Hauert, and E. Yeatman, “Advanced medical micro-robotics for early diagnosis and therapeutic interventions,” Frontiers in Robotics and AI, vol. 9, p. 1086043, 2023
work page 2023
-
[2]
Fast and globally convergent pose estimation from video images,
C.-P. Lu, G. D. Hager, and E. Mjolsness, “Fast and globally convergent pose estimation from video images,” IEEE transactions on pattern analysis and machine intelligence , vol. 22, no. 6, pp. 610–622, 2000
work page 2000
-
[3]
Magnetic microrobots for in vivo cargo delivery: A review,
J. Lin, Q. Cong, and D. Zhang, “Magnetic microrobots for in vivo cargo delivery: A review,”Micromachines, vol. 15, no. 5, p. 664, 2024
2024
-
[4]
Fabrication and optical manipulation of micro-robots for biomedical applications,
D. Zhang, Y . Ren, A. Barbot, F. Seichepine, B. Lo, Z.-C. Ma, and G.-Z. Yang, “Fabrication and optical manipulation of micro-robots for biomedical applications,” Matter, vol. 5, no. 10, pp. 3135–3160, 2022
work page 2022
-
[5]
3d printing of functional microrobots,
J. Li and M. Pumera, “3d printing of functional microrobots,” Chem- ical Society Reviews , vol. 50, no. 4, pp. 2794–2838, 2021
work page 2021
-
[6]
N. Rayabphand, N. Wijewardhane, N.-J. Prendergast, J. P. Armstrong, D. Zhang, and S. Hauert, “Magni-dome: An open platform for high- resolution light-based and magnetic contactless fabrication of active microstructures,” in 2025 International Conference on Manipulation, Automation and Robotics at Small Scales (MARSS) . IEEE, 2025, pp. 1–7
work page 2025
-
[7]
Indirect pushing based automated micromanipulation of bi- ological cells using optical tweezers,
A. Thakur, S. Chowdhury, P. Švec, C. Wang, W. Losert, and S. K. Gupta, “Indirect pushing based automated micromanipulation of bi- ological cells using optical tweezers,” The International Journal of Robotics Research, vol. 33, no. 8, pp. 1098–1111, 2014
work page 2014
Show all 32 references
-
[8]
Stereoscopic images in confocal (tandem scanning) mi- croscopy,
A. Boyde, “Stereoscopic images in confocal (tandem scanning) mi- croscopy,” Science, vol. 230, no. 4731, pp. 1270–1272, 1985
1985
-
[9]
Deep optics for monocular depth es- timation and 3d object detection,
J. Chang and G. Wetzstein, “Deep optics for monocular depth es- timation and 3d object detection,” in Proceedings of the IEEE/CVF International Conference on Computer Vision , 2019, pp. 10 193– 10 202
2019
-
[10]
Distributed force control for microrobot manipulation via planar multi-spot optical tweezer,
D. Zhang, A. Barbot, B. Lo, and G.-Z. Yang, “Distributed force control for microrobot manipulation via planar multi-spot optical tweezer,” Advanced Optical Materials , vol. 8, no. 21, p. 2000543, 2020
2020
-
[11]
Image-guided nanopositioning scheme for sem,
N. Marturi, B. Tamadazte, S. Dembélé, and N. Piat, “Image-guided nanopositioning scheme for sem,” IEEE Transactions on Automation Science and Engineering , vol. 15, no. 1, pp. 45–56, 2018
2018
-
[12]
Full 3d rotation estima- tion in scanning electron microscope,
A. V . Kudryavtsev, S. Dembélé, and N. Piat, “Full 3d rotation estima- tion in scanning electron microscope,” in 2017 IEEE/RSJ International Conference on Intelligent Robots and Systems (IROS) . IEEE, 2017, pp. 1134–1139
2017
-
[13]
Visual servoing- based depth-estimation technique for manipulation inside sem,
N. Marturi, B. Tamadazte, S. Dembélé, and N. Piat, “Visual servoing- based depth-estimation technique for manipulation inside sem,” IEEE Transactions on Instrumentation and Measurement, vol. 65, no. 8, pp. 1847–1855, 2016
2016
-
[14]
Depth estimation of optically transparent laser-driven microrobots,
M. Grammatikopoulou, L. Zhang, and G.-Z. Yang, “Depth estimation of optically transparent laser-driven microrobots,” in 2017 IEEE/RSJ International Conference on Intelligent Robots and Systems (IROS) . IEEE, 2017, pp. 2994–2999
2017
-
[15]
Three-dimensional pose estimation of optically transparent microrobots,
M. Grammatikopoulou and G.-Z. Yang, “Three-dimensional pose estimation of optically transparent microrobots,” IEEE Robotics and Automation Letters, vol. 5, no. 1, pp. 72–79, 2019
2019
-
[17]
Physics- informed machine learning for reliability and systems safety appli- cations: State of the art and challenges,
Y . Xu, S. Kohtz, J. Boakye, P. Gardoni, and P. Wang, “Physics- informed machine learning for reliability and systems safety appli- cations: State of the art and challenges,” Reliability Engineering & System Safety, vol. 230, p. 108900, 2023
2023
-
[18]
Scale-adaptive con- volutions for scene parsing,
R. Zhang, S. Tang, Y . Zhang, J. Li, and S. Yan, “Scale-adaptive con- volutions for scene parsing,” in Proceedings of the IEEE International Conference on Computer Vision , 2017, pp. 2031–2039
2017
-
[19]
Deep residual learning for image recognition,
K. He, X. Zhang, S. Ren, and J. Sun, “Deep residual learning for image recognition,” in Proceedings of the IEEE conference on computer vision and pattern recognition , 2016, pp. 770–778
2016
-
[20]
Entropy and contrast enhancement of infrared thermal images using the multiscale top-hat transform,
J. C. Mello Román, J. L. Vázquez Noguera, H. Legal-Ayala, D. P. Pinto-Roa, S. Gomez-Guerrero, and M. García Torres, “Entropy and contrast enhancement of infrared thermal images using the multiscale top-hat transform,” Entropy, vol. 21, no. 3, p. 244, 2019
2019
-
[21]
A generalized laplacian of gaussian filter for blob detection and its applications,
H. Kong, H. C. Akakin, and S. E. Sarma, “A generalized laplacian of gaussian filter for blob detection and its applications,” IEEE transactions on cybernetics , vol. 43, no. 6, pp. 1719–1733, 2013
2013
-
[22]
A comparative study and analysis of contrast enhancement algorithms for mri brain image sequences,
K. Srinivasan and N. Muthu, “A comparative study and analysis of contrast enhancement algorithms for mri brain image sequences,” in 2018 9th International Conference on Computing, Communication and Networking Technologies (ICCCNT). IEEE, 2018, pp. 1–7
2018
-
[23]
Building reconstruction from images and laser scanning,
C. Brenner, “Building reconstruction from images and laser scanning,” International Journal of Applied Earth Observation and Geoinforma- tion, vol. 6, no. 3-4, pp. 187–198, 2005
2005
-
[24]
Image segmentation by pixel classification in (gray level, edge value) space,
Panda and Rosenfeld, “Image segmentation by pixel classification in (gray level, edge value) space,” IEEE transactions on computers , vol. 100, no. 9, pp. 875–879, 1978
1978
-
[25]
Investigation on the effect of a gaussian blur in image filtering and segmentation,
E. S. Gedraite and M. Hadad, “Investigation on the effect of a gaussian blur in image filtering and segmentation,” in Proceedings ELMAR-
-
[26]
A multi-scale 3d otsu thresholding algorithm for medical image segmentation,
Y . Feng, H. Zhao, X. Li, X. Zhang, and H. Li, “A multi-scale 3d otsu thresholding algorithm for medical image segmentation,” Digital Signal Processing, vol. 60, pp. 186–199, 2017
2017
-
[27]
Torchvision: Pytorch’s computer vision library
“Torchvision: Pytorch’s computer vision library.” [Online]. Available: https://github.com/pytorch/vision
-
[28]
Micro-object pose estimation with sim-to-real transfer learning using small dataset,
D. Zhang, A. Barbot, F. Seichepine, F. P.-W. Lo, W. Bai, G.-Z. Yang, and B. Lo, “Micro-object pose estimation with sim-to-real transfer learning using small dataset,” Communications Physics, vol. 5, no. 1, p. 80, 2022
2022
-
[29]
A dataset and benchmarks for deep learning-based optical microrobot pose and depth perception,
L. Wei and D. Zhang, “A dataset and benchmarks for deep learning-based optical microrobot pose and depth perception,” 2025. [Online]. Available: https://arxiv.org/abs/2505.18303
2025 arXiv
-
[30]
Two-dimensional signal and image processing,
J. S. Lim, “Two-dimensional signal and image processing,” Englewood Cliffs, 1990
1990
-
[31]
A computational approach to edge detection,
J. Canny, “A computational approach to edge detection,” IEEE Trans- actions on pattern analysis and machine intelligence , no. 6, pp. 679– 698, 1986
1986
-
[2011]
IEEE, 2011, pp. 393–396
2011
Reviewed August 5, 2026 · model on record in the stance chip above.
Discussion (0). Sign in to comment.