REVIEW 4 major objections 3 minor 33 references
Unsupervised Out-of-Distribution Detection by Maximum Classifier Discrepancy
T0 review · 4 major / 3 minor · reviewed 2026-08-14 · deepseek-v4-flash
Pith's one-line read The paper claims that a two-head classifier fine-tuned on unlabeled test data, including out-of-distribution images, separates OOD from in-distribution inputs with AUROC above 99% on most benchmarks.
desk verdict The proposed transductive OOD detector is clearly explained and the idea is worth exploring, but the reported near-perfect results are an artifact of fine-tuning on the same test images used for evaluation. read the letter →
The pith
A machine-rendered reading of the paper's core claim, the machinery that carries it, and where it could break.
The reading
What carries the argument
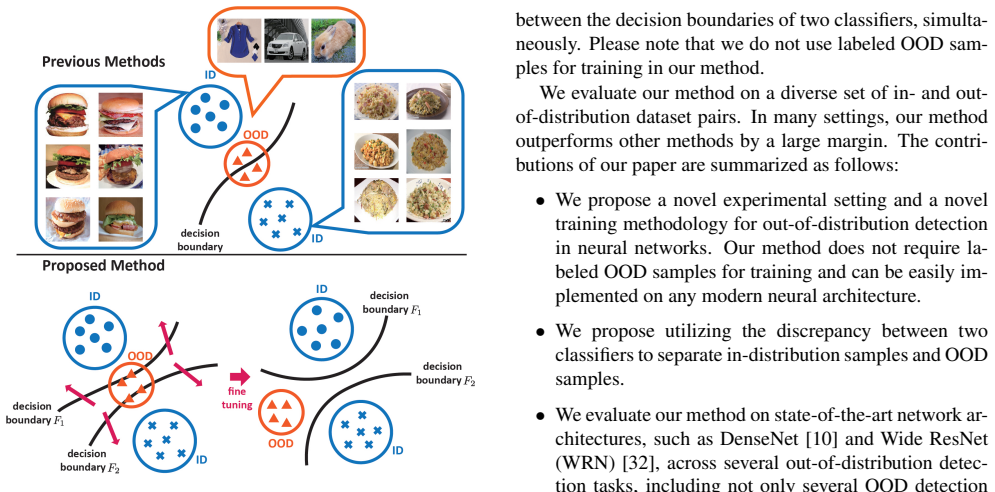
The central object is a two-head CNN: a shared feature extractor plus two classifier heads, $F_1$ and $F_2$, trained with a margin-based discrepancy loss $d(p_1, p_2) = H(p_1) - H(p_2)$. The margin $m$ in the unsupervised loss prevents overfitting by stopping optimization once the average discrepancy exceeds $m$. The machinery works by using the unlabeled set $X_{ul}$ (the test split) to maximize the gap between the decision boundaries of the two heads, effectively relocating OOD samples outside the ID manifold. At test time, the L1 distance between the two softmax outputs is the OOD score.
What would settle it
Evaluate on OOD classes that never appear in the unlabeled fine-tuning set (e.g., use only half the TinyImageNet classes in $X_{ul}$ and test on the other half); if AUROC drops substantially from the near-perfect values, the detector is exploiting the specific OOD images rather than a general notion of being out-of-distribution.
Extended reading notes
Core claim
The central discovery is that maximizing the discrepancy between two classifiers on unlabeled data, most of it drawn from the test split, separates ID from OOD samples. The paper defines the discrepancy loss as the difference in entropy between the two softmax outputs, $H(p_1) - H(p_2)$, and during fine-tuning alternately trains the network to classify labeled ID images correctly and to maximize this discrepancy on unlabeled images. This pushes OOD images toward high-entropy predictions from one head and low-entropy from the other, while ID images remain tightly classified by both. At inference, an input is flagged OOD if the L1 distance between the two softmax vectors exceeds a threshold. The paper demonstrates near-perfect separation on standard benchmark pairs and on simulated food and fashion applications, with a simple interpretable threshold near 1.0.
Load-bearing premise
The method uses the test split, including the OOD test images, as the unlabeled data for fine-tuning, and then evaluates on that same split, so the near-perfect scores may reflect seeing the test OOD data rather than a generalizable OOD detector.
Editorial extensions
If this is right
- OOD detection can be performed without any labeled OOD samples, using only unlabeled data, which is easy to obtain.
- The method works even when the unlabeled set contains few OOD samples (e.g., 500 OOD among 9,000 ID), as shown in ablation studies.
- The method generalizes when the OOD dataset used in fine-tuning differs from the OOD dataset used for evaluation (e.g., fine-tune on TinyImageNet-crop, test on LSUN-crop).
- The approach can be dropped onto existing architectures (DenseNet, Wide ResNet) with minimal modification.
- A single threshold near 1.0 separates ID from OOD, unlike earlier methods requiring careful threshold tuning.
Reading between the lines
- A natural test is to fine-tune on an unlabeled set containing only ID images (no OOD at all) and then evaluate on OOD test images; a large AUROC drop would indicate the method relies on seeing OOD samples during fine-tuning.
- The transductive setup means the reported near-perfect AUROC should be read as an upper bound for a system that must generalize to future OOD inputs; a fair comparison with methods that do not see test data would require a separate unlabeled set disjoint from the evaluation OOD set.
- The discrepancy principle might transfer to non-image modalities where unlabeled data is abundant, though the paper only evaluates images; this remains an open empirical question.
Signed reviews
Editorial analysis
A structured set of objections, weighed in public.
Referee Report
Summary. The paper proposes a two-head CNN with a shared feature extractor and two classifiers for out-of-distribution (OOD) detection. The method first trains the network on labeled in-distribution (ID) data, then fine-tunes it using unlabeled data while maximizing the discrepancy between the two classifiers' softmax outputs, defined as H(p1) - H(p2). At inference, a sample is declared OOD when the L1 distance between the two classifiers' probability vectors exceeds a threshold. The authors report near-perfect AUROC values on CIFAR-10/CIFAR-100 benchmarks, real-world food and fashion simulations, and ablation studies. The central claim is that this 'unsupervised' fine-tuning on test data is both legitimate and highly effective, significantly outperforming prior methods that only use labeled ID training data.
Significance. If the empirical evaluation were sound, the idea of using two classifiers and maximizing their discrepancy on unlabeled data would be a meaningful contribution, and the reported AUROC values of 99.6-100.0 on several benchmarks would be a large improvement over prior art. The paper also provides a clear description of the method, extensive ablations, and two real-world simulation cases. However, the evaluation protocol is fundamentally invalid: the unlabeled data used for fine-tuning is the same test data used for evaluation, including the OOD test images. The loss in Eq. (5) explicitly maximizes the discrepancy on those exact test images, so the results are fitted, not predicted. This invalidates the head-to-head comparison with ODIN and ELOC, which do not see the test data during training, and makes the reported performance uninterpretable as a measure of OOD detection generalization.
major comments (4)
- [Section 4.1.3 and Section 3.4] The evaluation is contaminated because the unlabeled set Xul used for fine-tuning is the same set on which the method is evaluated. Section 4.1.3 states that the remaining test images, including OOD images, were used as Xul for unsupervised training and evaluation, and Section 3.4 says 'we use the test data as the unlabeled data.' Since Step B (Eq. (5)) directly maximizes the discrepancy on these exact test images, the AUROC values in Table 2 are fitted values, not measures of detection performance on unseen OOD inputs. The comparison with ODIN and ELOC, which do not use test data during training, is therefore not a fair comparison.
- [Section 4.1.7, Table 3 and Table 4] The ablation studies do not resolve the leakage problem. In Table 3, the 9,000 ID and 9,000 OOD samples used for testing are the same samples that constitute Xul, so the claim that 'totally unseen samples were included during evaluation' is misleading. In Table 4, even when the OOD dataset used for testing is different from the OOD dataset in Xul, the ID test images are still the same as the ID images in Xul, so there remains ID-side leakage. No setting in the paper evaluates on a test set disjoint from Xul.
- [Section 3.5 and Eq. (6)] The inference rule uses an L1-distance threshold delta, but the paper does not explain how delta is selected or whether it is tuned on the validation split. If delta is tuned on the validation set, it is not independent of the fine-tuned model because the model was trained on Xul, which shares the same distribution as the validation set. More importantly, the evaluation on Xul means that the threshold and the model are both adapted to the evaluation data, further inflating the reported metrics.
- [Section 4.1.5 and Figure 5] The histogram in Figure 5a, showing that a simple threshold of 1.0 separates ID and OOD samples, is computed on Xul, the same data used for fine-tuning. This visualization therefore demonstrates that the model has fitted the specific OOD test set, not that it has learned a generalizable separation. The same issue applies to the claim that the two classifiers' maximum softmax scores for ID and OOD are cleanly separated after fine-tuning.
minor comments (3)
- [Section 3.3, Eq. (1)] The discrepancy term H(p1) - H(p2) is asymmetric with respect to the two classifiers, but the training procedure treats F1 and F2 symmetrically in Eq. (2). The paper should explain why this asymmetry is justified and whether the roles of F1 and F2 matter.
- [Section 4.1.1] The description of the fair-comparison modification for ODIN and ELOC is unclear: the paper says 'we used two classifiers and calculated the average score of these two classifiers as final output in the other methods,' but it is not specified how ODIN's temperature scaling and input preprocessing are applied in this ensemble setting.
- [Figure 4] Figure 4 is described as a histogram of 'the discrepancy (L1 distance)' between the two classifiers' outputs, but Section 3.3 defines discrepancy as H(p1) - H(p2). The paper should clarify which quantity is plotted in Figure 4.
Circularity Check
Reported AUROC is a transductive fit: the model is fine-tuned on the same test images (Xul) that are later scored, so the central 'prediction' is forced by construction.
-
fitted input called prediction
[Section 3.4 (Training Procedure), Section 4.1.3 (Out-of-Distribution), Eq. (5), Table 2]
""In principle, we use the test data as the unlabeled data." ... "the remaining test images containing unlabeled ID or OOD samples were used as Xul for unsupervised training and evaluation." Eq. (5): "Lunsup = max (m − (1/|Xul|) Σ_{xul∈Xul} d(p1(y|xul), p2(y|xul)), 0).""
The discrepancy loss in Eq. (5) is minimized by increasing the average classifier discrepancy on Xul, and Xul is exactly the remaining test set on which Table 2 computes AUROC, FPR, and detection error. Thus the optimization directly pushes the OOD test images' discrepancy scores above the margin, and the reported 99.6–100.0 AUROC measures how well the model fit the evaluation set, not how well it predicts OOD on unseen inputs. Since ODIN and ELOC are never fine-tuned on test images, the comparison is not on equal footing, and the headline 'prediction' reduces to a fitted outcome.
-
fitted input called prediction
[Section 4.1.7 (Ablation Studies), Table 3]
""Even when 9,000 ID samples and 500 OOD samples are included in Xul, our method still have better performance than [16, 26]... Please notice that we used all 9,000 ID samples and 9,000 OOD samples for testing, which means totally unseen samples were included during evaluation.""
In the ablation row with 9,000 ID and 9,000 OOD samples in Xul, the paper then uses all 9,000 ID and 9,000 OOD samples for testing, so the evaluation images coincide with the unsupervised training images. The statement that 'totally unseen samples were included during evaluation' is contradicted by the table, which shows the tested samples were used as Xul. The low detection error in that setting is therefore a transductive fit on the evaluation set, not evidence of generalization to unseen OOD data.
full rationale
The core methodological contribution, maximizing classifier discrepancy on unlabeled data, is a reasonable training objective whose internal math is self-consistent. The circularity is not in the loss derivation but in the evaluation protocol: Section 3.4 says 'we use the test data as the unlabeled data,' and Section 4.1.3 confirms that the remaining test images are 'used as Xul for unsupervised training and evaluation.' Equation (5) then optimizes the discrepancy exactly on those same ID and OOD test images, and Table 2 reports AUROC on them. This makes the central claim, state-of-the-art OOD detection, a fitted-input-called-prediction result rather than a predictive one. Table 4 provides some partial relief by testing on OOD datasets different from those in Xul in two rows, but the ID test images used for evaluation are still drawn from the same Xul pool, so ID-side leakage remains. There is no self-citation chain or imported uniqueness theorem; the problem is entirely the same-split train/evaluation design. The paper even acknowledges the split in its data-preparation text, so the reduction is explicit and quotable. The appropriate score is 8: the headline numbers are forced by construction with respect to the evaluation set, while the underlying discrepancy mechanism retains independent methodological content.
Assumptions & free parameters
free parameters (4)
- margin m =
1.2
- fine-tuning learning rate =
0.1
- number of fine-tuning epochs =
10
- inference threshold delta =
threshold swept for metrics; simple threshold 1.0 visualized
assumptions (3)
- domain assumption The unlabeled data Xul is drawn from the same distribution as the test data, and using it for fine-tuning does not invalidate the evaluation.
- domain assumption Two classifiers trained on ID data with random initializations will have different decision boundaries for OOD samples but agree on ID samples.
- ad hoc to paper Maximizing the discrepancy loss (H(p1)-H(p2)) on unlabeled data pushes OOD samples outside the support of ID samples without harming ID classification too much.
Cite this review
Pith. "Pith review of Unsupervised Out-of-Distribution Detection by Maximum Classifier Discrepancy." pith.science (2026). https://pith.science/paper/DOFBEBK6
@misc{pith2026190804951,
  author       = {Pith},
  title        = {Pith review of: Unsupervised Out-of-Distribution Detection by Maximum Classifier Discrepancy},
  year         = {2026},
  howpublished = {\url{https://pith.science/paper/DOFBEBK6}},
  note         = {Machine review of arXiv:1908.04951}
}
read the original abstract
Since deep learning models have been implemented in many commercial applications, it is important to detect out-of-distribution (OOD) inputs correctly to maintain the performance of the models, ensure the quality of the collected data, and prevent the applications from being used for other-than-intended purposes. In this work, we propose a two-head deep convolutional neural network (CNN) and maximize the discrepancy between the two classifiers to detect OOD inputs. We train a two-head CNN consisting of one common feature extractor and two classifiers which have different decision boundaries but can classify in-distribution (ID) samples correctly. Unlike previous methods, we also utilize unlabeled data for unsupervised training and we use these unlabeled data to maximize the discrepancy between the decision boundaries of two classifiers to push OOD samples outside the manifold of the in-distribution (ID) samples, which enables us to detect OOD samples that are far from the support of the ID samples. Overall, our approach significantly outperforms other state-of-the-art methods on several OOD detection benchmarks and two cases of real-world simulation.
Figures


Figures from the paper (3 more)


Reference graph
Works this paper leans on
-
[1]
Towards open world recognition
Abhijit Bendale and Terrance Boult. Towards open world recognition. In CVPR, 2015
2015
-
[2]
Towards open set deep networks
Abhijit Bendale and Terrance E Boult. Towards open set deep networks. In CVPR, 2016
2016
-
[3]
Food-101 – mining discriminative components with random forests
Lukas Bossard, Matthieu Guillaumin, and Luc Van Gool. Food-101 – mining discriminative components with random forests. In ECCV, 2014
work page 2014
-
[4]
Imagenet: A large-scale hierarchical image database
Jia Deng, Wei Dong, Richard Socher, Li-Jia Li, Kai Li, and Li Fei-Fei. Imagenet: A large-scale hierarchical image database. In CVPR, 2009
2009
-
[5]
Bert: Pre-training of deep bidirectional transformers for language understanding
Jacob Devlin, Ming-Wei Chang, Kenton Lee, and Kristina Toutanova. Bert: Pre-training of deep bidirectional transformers for language understanding. arXiv preprint arXiv:1810.04805, 2018
arXiv 2018
-
[6]
Generative openmax for multi-class open set clas- sification
Zongyuan Ge, Sergey Demyanov, Zetao Chen, and Rahil Garnavi. Generative openmax for multi-class open set clas- sification. In BMVC, 2017
work page 2017
-
[7]
Ian Goodfellow, Jean Pouget-Abadie, Mehdi Mirza, Bing Xu, David Warde-Farley, Sherjil Ozair, Aaron Courville, and Yoshua Bengio. Generative adversarial nets. In NIPS, 2014
work page 2014
-
[8]
Deep residual learning for image recognition
Kaiming He, Xiangyu Zhang, Shaoqing Ren, and Jian Sun. Deep residual learning for image recognition. In CVPR, 2016
2016
Show all 33 references
-
[9]
A baseline for detect- ing misclassified and out-of-distribution examples in neural networks
Dan Hendrycks and Kevin Gimpel. A baseline for detect- ing misclassified and out-of-distribution examples in neural networks. In ICLR, 2017
2017
-
[10]
Densely connected convolutional net- works
Gao Huang, Zhuang Liu, Laurens Van Der Maaten, and Kil- ian Q Weinberger. Densely connected convolutional net- works. In CVPR, 2017
2017
-
[11]
Delta divergence: A novel de- cision cognizant measure of classifier incongruence
Josef Kittler and Cemre Zor. Delta divergence: A novel de- cision cognizant measure of classifier incongruence. IEEE Transactions on Cybernetics, 2019
2019
-
[12]
Error sensitivity analysis of delta diver- gence - a novel measure for classifier incongruence detec- tion
Josef Kittler, Cemre Zor, Ioannis Kaloskampis, Yulia Hicks, and Wenwu Wang. Error sensitivity analysis of delta diver- gence - a novel measure for classifier incongruence detec- tion. Pattern Recognition, 2017
2017
-
[13]
Learning multiple layers of features from tiny images
Alex Krizhevsky. Learning multiple layers of features from tiny images. Technical report, 2009
2009
-
[14]
Training confidence-calibrated classifiers for detecting out- of-distribution samples
Kimin Lee, Honglak Lee, Kibok Lee, and Jinwoo Shin. Training confidence-calibrated classifiers for detecting out- of-distribution samples. In ICLR, 2018
2018
-
[15]
A simple unified framework for detecting out-of-distribution samples and adversarial attacks
Kimin Lee, Kibok Lee, Honglak Lee, and Jinwoo Shin. A simple unified framework for detecting out-of-distribution samples and adversarial attacks. In NIPS, 2018
2018
-
[16]
Shiyu Liang, Yixuan Li, and R. Srikant. Enhancing the re- liability of out-of-distribution image detection in neural net- works. In ICLR, 2018
2018
-
[17]
Sphereface: Deep hypersphere embedding for face recognition
Weiyang Liu, Yandong Wen, Zhiding Yu, Ming Li, Bhiksha Raj, and Le Song. Sphereface: Deep hypersphere embedding for face recognition. In CVPR, 2017
2017
-
[18]
Deepfashion: Powering robust clothes recognition and retrieval with rich annotations
Ziwei Liu, Ping Luo, Shi Qiu, Xiaogang Wang, and Xiaoou Tang. Deepfashion: Powering robust clothes recognition and retrieval with rich annotations. In CVPR, 2016
2016
-
[19]
Automatic differentiation in pytorch
Adam Paszke, Sam Gross, Soumith Chintala, Gregory Chanan, Edward Yang, Zachary DeVito, Zeming Lin, Al- ban Desmaison, Luca Antiga, and Adam Lerer. Automatic differentiation in pytorch. In NIPS-W, 2017
2017
-
[20]
Quintanilha, Roberto de M
Igor M. Quintanilha, Roberto de M. E. Filho, Jos Lezama, Mauricio Delbracio, and Leonardo O. Nunes. Detecting out- of-distribution samples using low-order deep features statis- tics. In Submitted to ICLR, 2019
2019
-
[21]
Rudd, Lalit P
Ethan M. Rudd, Lalit P. Jain, Walter J. Scheirer, and Ter- rance E. Boult. The extreme value machine. IEEE Transac- tions on Pattern Analysis and Machine Intelligence, 2018
2018
-
[22]
Maximum classifier discrepancy for unsuper- vised domain adaptation
Kuniaki Saito, Kohei Watanabe, Yoshitaka Ushiku, and Tat- suya Harada. Maximum classifier discrepancy for unsuper- vised domain adaptation. In CVPR, 2018
2018
-
[23]
Toward open set recogni- tion
Walter J Scheirer, Anderson de Rezende Rocha, Archana Sapkota, and Terrance E Boult. Toward open set recogni- tion. IEEE Transactions on Pattern Analysis and Machine Intelligence, 2013
2013
-
[24]
Prob- ability models for open set recognition
Walter J Scheirer, Lalit P Jain, and Terrance E Boult. Prob- ability models for open set recognition. IEEE Transactions on Pattern Analysis and Machine Intelligence, 2014
2014
-
[25]
Out-of- distribution detection using multiple semantic label represen- tations
Gabi Shalev, Yossi Adi, and Joseph Keshet. Out-of- distribution detection using multiple semantic label represen- tations. In NIPS, 2018
2018
-
[26]
Out-of- distribution detection using an ensemble of self supervised leave-out classifiers
Apoorv Vyas, Nataraj Jammalamadaka, Xia Zhu, Dipankar Das, Bharat Kaul, and Theodore L Willke. Out-of- distribution detection using an ensemble of self supervised leave-out classifiers. In ECCV, 2018
2018
-
[27]
Be- yond novelty detection: Incongruent events, when general and specific classifiers disagree
Daphna Weinshall, Alon Zweig, Hynek Hermansky, Ste- fan Kombrink, Frank W Ohl, J ¨orn Anem¨uller, J¨org-Hendrik Bach, Luc Van Gool, Fabian Nater, Tomas Pajdla, et al. Be- yond novelty detection: Incongruent events, when general and specific classifiers disagree. IEEE Transaction...
2012
-
[28]
Sun database: Large-scale scene recognition from abbey to zoo
Jianxiong Xiao, James Hays, Krista A Ehinger, Aude Oliva, and Antonio Torralba. Sun database: Large-scale scene recognition from abbey to zoo. In CVPR, 2010
2010
-
[29]
Turkergaze: Crowdsourcing saliency with webcam based eye tracking
Pingmei Xu, Krista A Ehinger, Yinda Zhang, Adam Finkel- stein, Sanjeev R Kulkarni, and Jianxiong Xiao. Turkergaze: Crowdsourcing saliency with webcam based eye tracking. arXiv preprint arXiv:1504.06755, 2015
2015 arXiv
-
[30]
Classification- reconstruction learning for open-set recognition
Ryota Yoshihashi, Wen Shao, Rei Kawakami, Shaodi You, Makoto Iida, and Takeshi Naemura. Classification- reconstruction learning for open-set recognition. In CVPR, 2019
2019
-
[31]
Construction of a large- scale image dataset using deep learning with humans in the loop
Fisher Yu, Ari Seff, Yinda Zhang, Shuran Song, Thomas Funkhouser, and Jianxiong Xiao. Construction of a large- scale image dataset using deep learning with humans in the loop. arXiv preprint arXiv: 1506.03365, 2015
2015 arXiv
-
[32]
Wide residual net- works
Sergey Zagoruyko and Nikos Komodakis. Wide residual net- works. In BMVC, 2016
2016
-
[33]
Understanding deep learning re- quires rethinking generalization
Chiyuan Zhang, Samy Bengio, Moritz Hardt, Benjamin Recht, and Oriol Vinyals. Understanding deep learning re- quires rethinking generalization. In ICLR, 2017. 9
2017
Reviewed August 14, 2026 · model on record in the stance chip above.
Discussion (0). Continue with ORCID to comment.