REVIEW 3 major objections 5 minor 1 cited by
Systematic Variations of CO Gas Abundance with Radius in Gas-rich Protoplanetary Disks
T0 review · 3 major / 5 minor · reviewed 2026-08-14 · deepseek-v4-flash
Pith's one-line read This paper finds that CO gas abundance in planet-forming disks varies by at least an order of magnitude with radius, so constant-abundance CO-based disk mass and radius estimates are biased.
desk verdict First radially resolved CO abundance profiles in four disks show order-of-magnitude variation, but the size of the claim depends on an untested gas surface density shape and an unfinished plot caption. read the letter →
The pith
A machine-rendered reading of the paper's core claim, the machinery that carries it, and where it could break.
The reading
What carries the argument
The method is an abundance-rescaling comparison: for each disk a two-dimensional thermo-chemical model with time-dependent chemistry and line radiative transfer is calibrated to known disk and stellar parameters, then the model's CO abundance is multiplied by a radius-independent rescaling factor for each annulus until the predicted C18O line surface brightness matches the observed deprojected radial profile; that factor defines the depletion. The interpretive machinery is pebble transport: CO freezes outside the mid-plane snowline, icy grains grow, settle, and drift inward, releasing vapor inside the snowline and leaving a depleted intermediate zone that recovers in the outer disk. A second candidate, cosmic-ray-driven chemical conversion, is tested but fails because the depletion occurs too deep.
What would settle it
Resolved maps of a rarer CO isotopologue such as C17O, using a known isotopologue ratio, would settle the claim: if C17O emission falls as steeply as the rescaled C18O models require, the abundance variation is real; if C17O tracks a constant interstellar ratio, the depletion is an optical-depth artifact. Alternatively, resolved HD line observations of true gas surface density at the same annuli would directly compare gas column to CO-derived column.
Extended reading notes
Core claim
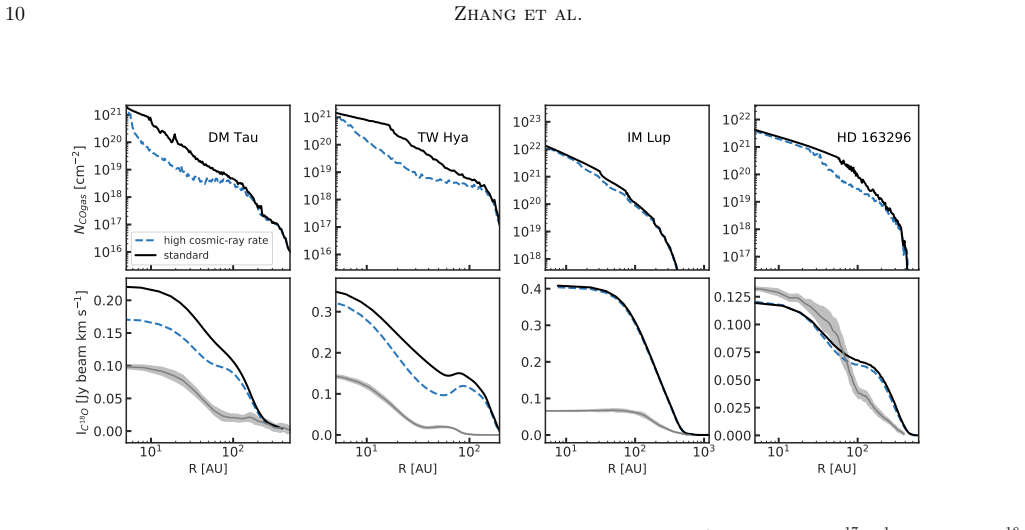
The central claim is that the CO gas abundance in the warm molecular layer is not constant but varies strongly with radius in all four disks: DM Tau, TW Hya, HD 163296, and IM Lup. The derived profiles show an order-of-magnitude range within each disk, with TW Hya's outer disk depleted by factors of 100-300. The paper compares these profiles with two candidate mechanisms. Chemical processing with an interstellar cosmic-ray ionization rate can convert enough CO, but mostly in the deep disk, leaving the observable layer nearly unchanged. Dust evolution, in which CO-ice-coated grains grow, settle, and drift inward, predicts the right radial pattern - modest enhancement inside the snowline, peak depletion just beyond it, and recovery outward - but underestimates the depletion magnitude. The paper concludes that a coupled chemical-dynamical treatment is needed and that the CO abundance profile is a record of volatile transport.
Load-bearing premise
The derivation assumes that C18O emission (and TW Hya 13CO beyond 70 AU) is optically thin and that multiplying the model's CO abundance by a constant factor at each radius accurately represents the true abundance; if optical depth or isotope-selective photodissociation contributes to the faint emission, the derived order-of-magnitude radial variation could be partly a brightness effect.
Editorial extensions
If this is right
- Disk masses and radii derived from CO lines under a constant abundance will carry a radius-dependent systematic error, not just a uniform offset.
- Radial CO depletion profiles become a practical probe of dust evolution: the location and depth of the depletion zone locate where pebble growth and inward drift have stripped volatile ice.
- Predictions for planet-forming volatile inventories must couple chemistry with the dynamical transport of icy grains, since either alone underpredicts the depletion.
- The extreme outer CO deficit in TW Hya implies either severe CO removal or actual gas depletion beyond 100 au, which changes interpretations of its outer disk.
- In HD 163296 the CO enhancement just inside its snowline is a signpost for icy pebbles crossing the snowline and vaporizing there.
Reading between the lines
- If the derived profiles are correct, resolved images of a rarer isotopologue such as C17O should show the same radial swing; if not, the C18O depletion would be partly an optical-depth artifact.
- A testable extension is that disks with more evolved dust, inferred from stronger millimeter continuum or larger grain sizes, should show deeper CO depletion in the intermediate zone with the depletion peak shifting outward.
- Comparing other carbon-bearing molecules, such as C2H, at the same radii could reveal whether the pattern reflects a general elemental carbon depletion rather than a CO-specific process.
- Resolved hydrogen-deuteride gas surface density measurements would convert brightness-derived depletion factors into true abundances.
Signed reviews
Editorial analysis
A structured set of objections, weighed in public.
Referee Report
Summary. The paper uses spatially resolved ALMA C18O (and, for TW Hya, 13CO) observations of four protoplanetary disks — DM Tau, TW Hya, HD 163296, and IM Lup — together with the RAC2D thermo-chemical code and parametric disk structures to infer how the CO gas abundance in the warm molecular layer varies with radius. For each disk, the authors compute a standard constant-abundance chemical model, generate synthetic line images, and then rescale the model CO abundance by a radius-dependent constant factor to match the observed radial line brightness profiles. They report that CO is depleted by an order of magnitude or more relative to the interstellar ratio, that the depletion varies by at least an order of magnitude within individual disks, and that the radial depletion patterns in three of the four disks qualitatively resemble predictions from dust-evolution models that include pebble formation, settling, and drift. They also argue that chemical processing alone, even with a high cosmic-ray ionization rate, cannot explain the weak CO isotopologue emission because the depletion occurs too deep in the disk.
Significance. If the central claim holds, it would be an important result: constant-abundance CO-based estimates of disk mass, disk radius, and gas-to-dust ratio would be systematically biased, and the derived radial depletion profiles would provide a new observational constraint on dust evolution and volatile transport. The paper has notable strengths: a homogeneous four-disk framework, detailed physical-chemical modeling, explicit tests of the cosmic-ray ionization rate and of the surface-density power-law index, and a clear statement that the total gas mass normalization is not the dominant uncertainty. The use of optically thin C18O and 13CO lines is appropriate in principle, and the comparison to Krijt et al. (2018) is useful even if qualitative. However, the derivation rests on several assumptions — the shape of the gas surface density profile, optically thin emission, and fixed isotopologue ratios — that are not fully stress-tested, and the key Figure 8 presents depletion factors without propagated uncertainties. These issues are addressable, but they are load-bearing for the order-of-magnitude claim.
major comments (3)
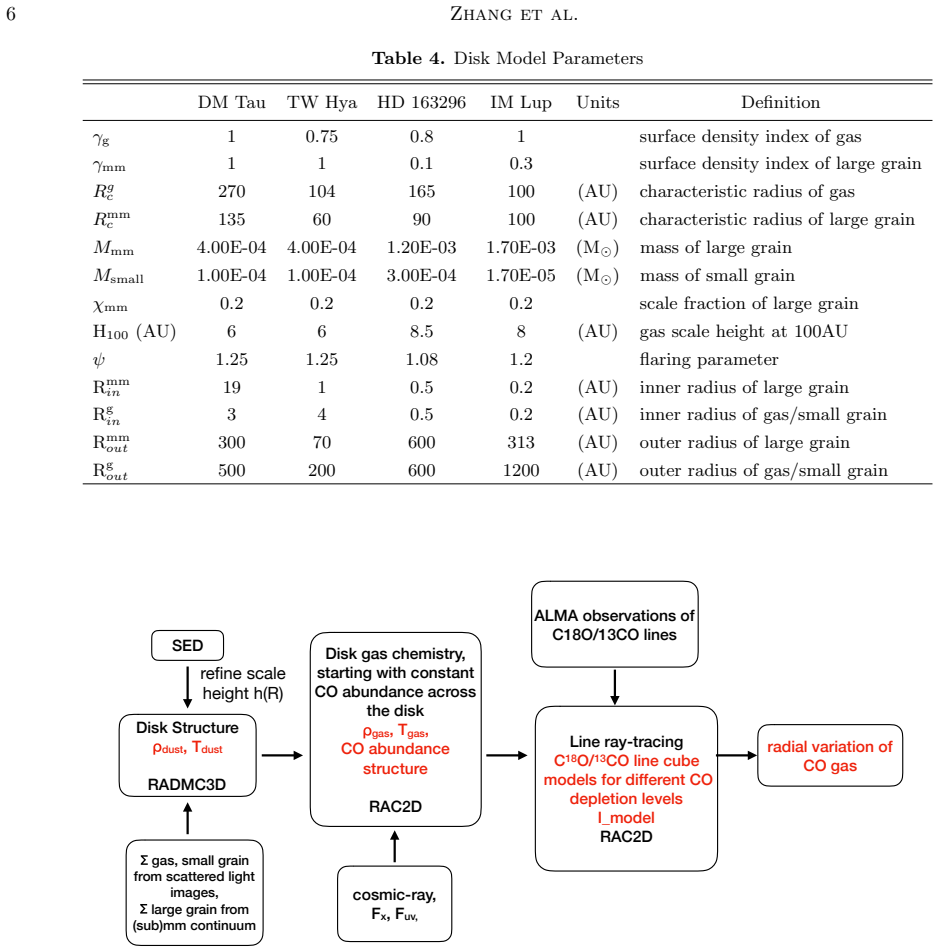
- [§4.4, eq. (1), Table 4] The radial CO abundance profile is derived by comparing observed line brightness to a single model per disk with a fixed parametric gas surface density shape. The paper varies only the power-law index γ by ±0.2 (§4.3) and keeps the characteristic radius R_c and the outer exponential taper fixed. This is a concern because the inversion compares I_CO to the model's assumed gas column: any mismatch in the assumed density shape is absorbed into the inferred abundance variation. The concern is concrete for DM Tau, where R_c = 270 AU is set 'based on the extent of C18O (3-2) emission' (Table 4). If the true gas surface density has a smaller R_c or a steeper outer taper, the constant-abundance model is fainter in the outer disk, and the inferred rise of CO abundance with radius would be reduced or disappear. The statement that total gas mass normalization is not crucial does not address the shape of the profile. Please vary R_c and the outer taper (or justify them with independent constraints) and quantify how much of the inferred order-of-magnitude variation in Figure 8 survives.
- [§3.3 and §4.4] The inversion assumes that the observed C18O surface brightness is proportional to the CO column in the emitting layer, and that fixed interstellar isotopologue ratios (CO/13CO = 69, CO/C18O = 570) apply at all radii. If C18O emission is not fully optically thin in the regions where depletion factors are derived, or if isotope-selective photodissociation changes the local C18O/CO ratio, the derived abundance variation would partly be a brightness variation. The text cites previous work supporting the optical thinness of TW Hya 13CO beyond 70 AU, but for the other disks the C18O optical depth is asserted rather than demonstrated. Please include a per-radius check — for example, model optical depth profiles or a comparison of C18O J = 2-1 and 3-2 where available — to verify that I_line ∝ N_CO holds at the radii used in Figure 8.
- [Figure 8 and §4.4] The central quantitative claim — at least an order-of-magnitude radial variation in CO abundance — is presented without propagated uncertainties. The observed radial profiles in Figure 7 have 1σ error bars and the flux calibration uncertainty is stated as 10%, but the depletion factors in Figure 8 have no error bars or shaded ranges. The γ test in §4.3 shows that line brightness changes by less than 30%, but a 30% brightness change can translate into a substantially larger change in depletion factor because the mapping is nonlinear and because the depletion factor is normalized to a model that itself depends on other disk parameters. Please add uncertainty ranges to the four panels of Figure 8, or otherwise quantify how robust the radial gradient is to noise, calibration, and the adopted disk structure parameters.
minor comments (5)
- [Figure 8 caption] The caption contains placeholder text ('Lorem ipsum') and a stray fragment ('ebea'); these should be removed before publication.
- [Abstract and §5.1.3] There are typos: 'V ariations' in the title line should be 'Variations', and 'Shakura-Sunyeav' in §5.1.3 should be 'Shakura-Sunyaev'.
- [Table 4] The row labeled 'H100 (AU)' lists no numerical values; the adopted gas scale heights at 100 AU should be given explicitly for all four disks.
- [§3.3] The text says 'φ from 1 to 1.3' when describing the flaring-parameter grid; this should be ψ to match eq. (3).
- [§5.1.2] The statement that observed depletions are 'a factor of few higher' than the Krijt et al. (2018) simulations is vague; please give the actual ranges (for example, factor of 10 or larger observed versus factor of 2-6 predicted).
Circularity Check
No circularity: CO abundance profiles are observational inferences; comparison models are independent and not used to fit.
full rationale
The central inference (Section 4.4) is a data-constrained derivation, not a prediction forced by inputs. Observed C18O/13CO radial brightness profiles are compared to thermo-chemical models that assume a constant CO abundance, and the CO abundance is then rescaled at each radius by the factor needed to match the observed surface brightness. This is a model-to-data inference: the output abundance profile is a residual of observed emission relative to a constant-abundance model, so the order-of-magnitude radial variation is not an input assumption. The paper explicitly tests the sensitivity of the brightness profiles to ±0.2 changes in the gas surface-density exponent and finds <30% changes (Section 4.3), showing the inferred variations are not trivially set by the density slope. The R_c and flaring choices are taken from independent literature constraints (scattered light, SED, continuum); the DM Tau R_c is admittedly based on the C18O emission extent, which is a limitation for the absolute pattern at the outermost radii, but it is not a redefinition of the abundance result. The comparison to Krijt et al. (2018) and Schwarz et al. (2018) involves co-authors and is qualitative; these models are not used to fit the observed CO profiles, and the paper reports that the predicted depletion is a factor of a few lower than observed, so the conclusion is not imported by self-citation. The thermo-chemical code RAC2D and radiative transfer code RADMC3D are independent numerical tools. No equation or parameter is defined in terms of the claimed radial abundance variation, and no fitted parameter is renamed as a prediction. Hence no circular step can be exhibited.
Assumptions & free parameters
free parameters (5)
- h0 (gas scale height at 100 AU) =
DM Tau 6 AU; TW Hya 6 AU; HD 163296 8.5 AU; IM Lup 8 AU
- psi (flaring index) =
DM Tau 1.25; TW Hya 1.25; HD 163296 1.08; IM Lup 1.2
- Small-to-large dust mass split =
20% small / 80% large; IM Lup 1% small / 99% large
- Large grain settling parameter chi_mm =
0.2
- Radial CO depletion factor f_dep(R) =
Best-fit per radius, shown in Fig. 8; ranges roughly 0.1 to 300 across disks
assumptions (5)
- domain assumption Initial carbon is entirely in CO at abundance 1.4e-4 relative to H atoms
- domain assumption No CO isotopologue fractionation; fixed ISM ratios CO/13CO=69 and CO/C18O=570
- domain assumption C18O low-J emission is optically thin beyond about 30 AU, and TW Hya 13CO (3-2) is optically thin beyond 70 AU
- domain assumption Model disk density structures and stellar parameters adopted from the literature are accurate enough for the radial abundance inference
- domain assumption Static density structure with no vertical mixing during chemical evolution
Cite this review
Pith. "Pith review of Systematic Variations of CO Gas Abundance with Radius in Gas-rich Protoplanetary Disks." pith.science (2026). https://pith.science/paper/DOQVZA7N
@misc{pith2026190803267,
  author       = {Pith},
  title        = {Pith review of: Systematic Variations of CO Gas Abundance with Radius in Gas-rich Protoplanetary Disks},
  year         = {2026},
  howpublished = {\url{https://pith.science/paper/DOQVZA7N}},
  note         = {Machine review of arXiv:1908.03267}
}
read the original abstract
CO is the most widely used gas tracer of protoplanetary disks. Its abundance is usually assumed to be an interstellar ratio throughout the warm molecular layer of the disk. But recent observations of low CO gas abundance in many protoplanetary disks challenge our understanding of physical and chemical evolutions in disks. Here we investigate the CO abundance structures in four well-studied disks and compare their structures with predictions of chemical processing of CO and transport of CO ice-coated dust grains in disks. We use spatially resolved CO isotopologue line observations and detailed thermo-chemical models to derive CO abundance structures. We find that the CO abundance varies with radius by an order of magnitude in these disks. We show that although chemical processes can efficiently reduce the total column of CO gas within 1 Myr under an ISM level of cosmic-ray ionization rate, the depletion mostly occurs at the deep region of a disk. Without sufficient vertical mixing, the surface layer is not depleted enough to reproduce weak CO emissions observed. The radial profiles of CO depletion in three disks are qualitatively consistent with predictions of pebble formation, settling, and drifting in disks. But the dust evolution alone cannot fully explain the high depletion observed in some disks. These results suggest that dust evolution may play a significant role in transporting volatile materials and a coupled chemical-dynamical study is necessary to understand what raw materials are available for planet formation at different distances from the central star.
Figures


Figures from the paper (5 more)



Forward citations
Cited by 1 Pith paper
-
A Chemical Inventory of the Disk around the Class 0 Protostar L1527 IRS with ALMA
A comprehensive ALMA-based chemical inventory of the Class 0 protostar L1527 IRS finds 39 molecular species and a carbon-rich to oxygen-rich transition from envelope to disk.
Reference graph
Works this paper leans on
-
[1]
1999, A&A, 351, 233
Aikawa, Y., & Herbst, E. 1999, A&A, 351, 233
1999
-
[2]
Aikawa, Y., Umebayashi, T., Nakano, T., & Miyama, S. M. 1999, ApJ, 519, 705
work page 1999
-
[3]
2002, A&A, 386, 622 ALMA Partnership, Brogan, C
Herbst, E. 2002, A&A, 386, 622 ALMA Partnership, Brogan, C. L., P´ erez, L. M., et al. 2015, ApJL, 808, L3
work page 2002
-
[4]
M., Wilner, D
Andrews, S. M., Wilner, D. J., Espaillat, C., et al. 2011, ApJ, 732, 42
2011
-
[5]
Andrews, S. M., Wilner, D. J., Hughes, A. M., et al. 2012, ApJ, 744, 162
work page 2012
- [6]
-
[7]
Andrews, S. M., Huang, J., P´ erez, L. M., et al. 2018, ApJ, 869, L41 16 Zhang et al
work page 2018
-
[8]
P., van der Marel, N., et al
Ansdell, M., Williams, J. P., van der Marel, N., et al. 2016, ApJ, 828, 46
2016
Show all 71 references
-
[9]
P., Trapman, L., et al
Ansdell, M., Williams, J. P., Trapman, L., et al. 2018, ApJ, 859, 21
2018
-
[10]
A., Carpenter, J
Barenfeld, S. A., Carpenter, J. M., Ricci, L., & Isella, A. 2016, ApJ, 827, 142
2016
-
[11]
2014, Protostars and Planets VI, 691
Benz, W., Ida, S., Alibert, Y., Lin, D., & Mordasini, C. 2014, Protostars and Planets VI, 691
2014
-
[12]
A., Aikawa, Y., Blake, G
Bergin, E. A., Aikawa, Y., Blake, G. A., & van Dishoeck, E. F. 2007, in Protostars and Planets V, ed. B. Reipurth, D. Jewitt, & K. Keil, 751
2007
-
[13]
A., Cleeves, L
Bergin, E. A., Cleeves, L. I., Crockett, N., & Blake, G. A. 2014, Faraday Discussions, 168, 61
2014
-
[14]
A., Du, F., Cleeves, L
Bergin, E. A., Du, F., Cleeves, L. I., et al. 2016, ApJ, 831, 101
2016
-
[15]
A., & Williams, J
Bergin, E. A., & Williams, J. P. 2018, ArXiv e-prints, arXiv:1807.09631
2018 arXiv
-
[16]
A., Cleeves, L
Bergin, E. A., Cleeves, L. I., Gorti, U., et al. 2013, Nature, 493, 644
2013
-
[17]
B., Oberg, K
Bergner, J. B., Oberg, K. I., Bergin, E. A., et al. 2019, arXiv e-prints, arXiv:1904.09315
2019 arXiv
-
[18]
2012, A&A, 539, A148
Birnstiel, T., Klahr, H., & Ercolano, B. 2012, A&A, 539, A148
2012
-
[19]
D., Walsh, C., & van Dishoeck, E
Bosman, A. D., Walsh, C., & van Dishoeck, E. F. 2018, A&A, 618, A182
2018
-
[20]
S., Cranmer, S
Brickhouse, N. S., Cranmer, S. R., Dupree, A. K., Luna, G. J. M., & Wolk, S. 2010, ApJ, 710, 1835
2010
-
[21]
M., et al
Calvet, N., D’Alessio, P., Watson, D. M., et al. 2005, ApJL, 630, L185
2005
-
[22]
I., Adams, F
Cleeves, L. I., Adams, F. C., & Bergin, E. A. 2013, ApJ, 772, 5
2013
-
[23]
I., Bergin, E
Cleeves, L. I., Bergin, E. A., Qi, C., Adams, F. C., & ¨Oberg, K. I. 2015, ApJ, 799, 204
2015
-
[24]
I., ¨Oberg, K
Cleeves, L. I., ¨Oberg, K. I., Wilner, D. J., et al. 2016, ApJ, 832, 110 de Gregorio-Monsalvo, I., M´ enard, F., Dent, W., et al. 2013, A&A, 557, A133
2016
-
[25]
E., Evans, Neal J., I., Ramos, A., Yu, M., & Willacy, K
Dodson-Robinson, S. E., Evans, Neal J., I., Ramos, A., Yu, M., & Willacy, K. 2018, ApJ, 868, L37
2018
-
[26]
Du, F., & Bergin, E. A. 2014, ApJ, 792, 2
2014
-
[27]
P., & Dominik, C
Dullemond, C. P., & Dominik, C. 2004, A&A, 417, 159
2004
-
[28]
P., Juhasz, A., Pohl, A., et al
Dullemond, C. P., Juhasz, A., Pohl, A., et al. 2012, RADMC-3D: A multi-purpose radiative transfer tool, Astrophysics Source Code Library, , , ascl:1202.015
2012
-
[29]
Eistrup, C., Walsh, C., & van Dishoeck, E. F. 2016, A&A, 595, A83
2016
-
[30]
2018, A&A, 612, A104
Ovelar, M. 2018, A&A, 612, A104
2018
-
[31]
I., Bergin, E
Favre, C., Cleeves, L. I., Bergin, E. A., Qi, C., & Blake, G. A. 2013, ApJL, 776, L38
2013
-
[32]
M., Hughes, A
Flaherty, K. M., Hughes, A. M., Rosenfeld, K. A., et al. 2015, ApJ, 813, 99 Gaia Collaboration, Brown, A. G. A., Vallenari, A., et al. 2016, A&A, 595, A2 Gaia Collaboration, Brown, A. G. A., Vallenari, A., et al. 2018, A&A, 616, A1 G¨ unther, H. M., Matt, S. P., Schmitt, J. H....
2015
-
[33]
1981, PTPS, 70, 35
Hayashi, C. 1981, PTPS, 70, 35
1981
-
[34]
2010, ApJ, 714, 1511
Henning, T., Semenov, D., Guilloteau, S., et al. 2010, ApJ, 714, 1511
2010
-
[35]
2016, Physical Review Letters, 117, 251101
Isella, A., Guidi, G., Testi, L., et al. 2016, Physical Review Letters, 117, 251101
2016
-
[36]
F., et al
Kama, M., Bruderer, S., van Dishoeck, E. F., et al. 2016, A&A, 592, A83
2016
-
[37]
J., & Hartmann, L
Kenyon, S. J., & Hartmann, L. 1995, The Astrophysical Journal Supplement Series, 101, 117
1995
-
[38]
J., & Bergin, E
Krijt, S., Ciesla, F. J., & Bergin, E. A. 2016, ApJ, 833, 285
2016
-
[39]
R., Bergin, E
Krijt, S., Schwarz, K. R., Bergin, E. A., & Ciesla, F. J. 2018, ApJ, 864, 78
2018
-
[40]
2018, ApJL, 868, L5
Kudo, T., Hashimoto, J., Muto, T., et al. 2018, ApJL, 868, L5
2018
-
[41]
J., Pascucci, I., et al
Long, F., Herczeg, G. J., Pascucci, I., et al. 2017, ApJ, 844, 99
2017
-
[42]
Lynden-Bell, D., & Pringle, J. E. 1974, MNRAS, 168, 603
1974
-
[43]
F., Rosotti, G., Testi, L., et al
Manara, C. F., Rosotti, G., Testi, L., et al. 2016, A&A, 591, L3
2016
-
[44]
K., Bergin, E
McClure, M. K., Bergin, E. A., Cleeves, L. I., et al. 2016, ApJ, 831, 167
2016
-
[45]
2007, in Astronomical Society of the Pacific Conference Series, Vol
Golap, K. 2007, in Astronomical Society of the Pacific Conference Series, Vol. 376, Astronomical Data Analysis Software and Systems XVI, ed. R. A. Shaw, F. Hill, & D. J. Bell, 127
2007
-
[46]
Miotello, A., Bruderer, S., & van Dishoeck, E. F. 2014, A&A, 572, A96
2014
-
[47]
F., & Bruderer, S
Miotello, A., Facchini, S., van Dishoeck, E. F., & Bruderer, S. 2018, A&A, 619, A113
2018
-
[48]
F., Kama, M., & Bruderer, S
Miotello, A., van Dishoeck, E. F., Kama, M., & Bruderer, S. 2016, A&A, 594, A85
2016
-
[49]
F., Williams, J
Miotello, A., van Dishoeck, E. F., Williams, J. P., et al. 2017, A&A, 599, A113
2017
-
[50]
2017, ApJ, 849, 130
Molyarova, T., Akimkin, V., Semenov, D., et al. 2017, ApJ, 849, 130
2017
-
[51]
S., & Wilner, D
Natta, A., Testi, L., Neri, R., Shepherd, D. S., & Wilner, D. J. 2004, A&A, 416, 179 Radial variation of CO gas abundance 17 ¨Oberg, K. I., & Bergin, E. A. 2016, ApJ, 831, L19 ¨Oberg, K. I., Murray-Clay, R., & Bergin, E. A. 2011, ApJL, 743, L16 ¨Oberg, K. I., van Broekhuizen, ...
2004
-
[52]
L., M´ enard, F., et al
Pinte, C., Padgett, D. L., M´ enard, F., et al. 2008, A&A, 489, 633
2008
-
[53]
B., Hubickyj, O., Bodenheimer, P., et al
Pollack, J. B., Hubickyj, O., Bodenheimer, P., et al. 1996, Icarus, 124, 62
1996
-
[54]
I., Andrews, S
Qi, C., ¨Oberg, K. I., Andrews, S. M., et al. 2015, ApJ, 813, 128
2015
-
[55]
I., Wilner, D
Qi, C., ¨Oberg, K. I., Wilner, D. J., et al. 2013, Science, 341, 630
2013
-
[56]
2015, A&A, 579, A82
Dutrey, A. 2015, A&A, 579, A82
2015
-
[57]
A., Boogert, A
Salyk, C., Blake, G. A., Boogert, A. C. A., & Brown, J. M. 2009, ApJ, 699, 330
2009
-
[58]
R., Bergin, E
Schwarz, K. R., Bergin, E. A., Cleeves, L. I., et al. 2016, ApJ, 823, 91 —. 2018, ApJ, 856, 85 —. 2019, ApJ, 877, 131
2016
-
[59]
M., Birnstiel, T., Pani´ c, O., Dullemond, C
Stammler, S. M., Birnstiel, T., Pani´ c, O., Dullemond, C. P., & Dominik, C. 2017, A&A, 600, A140
2017
-
[60]
A., Drake, J
Swartz, D. A., Drake, J. J., Elsner, R. F., et al. 2005, ApJ, 628, 811
2005
-
[61]
F., & Bruderer, S
Trapman, L., Miotello, A., Kama, M., van Dishoeck, E. F., & Bruderer, S. 2017, A&A, 605, A69
2017
-
[62]
1981, Publications of the Astronomical Society of Japan, 33, 617 van Boekel, R., Henning, T., Menu, J., et al
Umebayashi, T., & Nakano, T. 1981, Publications of the Astronomical Society of Japan, 33, 617 van Boekel, R., Henning, T., Menu, J., et al. 2017, ApJ, 837, 132 van der Marel, N., Dong, R., di Francesco, J., Williams, J., & Tobin, J. 2019, arXiv e-prints, arXiv:1901.03680
1981 arXiv
-
[63]
P., & Best, W
Williams, J. P., & Best, W. M. J. 2014, ApJ, 788, 59
2014
-
[64]
P., & Cieza, L
Williams, J. P., & Cieza, L. A. 2011, Annual Review of Astronomy and Astrophysics, 49, 67
2011
-
[65]
P., & McPartland, C
Williams, J. P., & McPartland, C. 2016, ApJ, 830, 32
2016
-
[66]
Wilson, T. L. 1999, Reports on Progress in Physics, 62, 143
1999
-
[67]
2017, ApJ, 835, 162
Xu, R., Bai, X.-N., & ¨Oberg, K. 2017, ApJ, 835, 162
2017
-
[68]
E., Turner, N
Yu, M., Willacy, K., Dodson-Robinson, S. E., Turner, N. J., & Evans, II, N. J. 2016, ApJ, 822, 53
2016
-
[69]
A., Blake, G
Zhang, K., Bergin, E. A., Blake, G. A., et al. 2016, ApJL, 818, L16
2016
-
[70]
Schwarz, K. R. 2017, Nature Astronomy, 1, 0130
2017
-
[71]
M., & Blake, G
Zhang, K., Isella, A., Carpenter, J. M., & Blake, G. A. 2014, ApJ, 791, 42
2014
Reviewed August 14, 2026 · model on record in the stance chip above.
Discussion (0). Continue with ORCID to comment.