HyperCap: Hyperspectral Land Cover Captioning Dataset for Vision Language Models
Pith reviewed 2026-05-22 15:11 UTC · model grok-4.3
The pith
HyperCap pairs hyperspectral images with pixel-wise text captions to improve land cover understanding in remote sensing.
A machine-rendered reading of the paper's core claim, the machinery that carries it, and where it could break.
Core claim
HyperCap is constructed from four benchmark datasets and annotated through a hybrid automated and manual process to produce accurate pixel-wise textual descriptions; when paired with state-of-the-art encoders and diverse fusion techniques, it yields significant improvements in hyperspectral land cover classification performance.
What carries the argument
The HyperCap dataset itself, which supplies pixel-wise textual annotations alongside hyperspectral spectral data to support semantic tasks in vision-language models.
If this is right
- Vision-language models gain the ability to perform classification and feature extraction directly on hyperspectral data using textual guidance.
- Remote sensing pipelines can incorporate language-based queries for land cover analysis instead of purely spectral methods.
- Future work can build larger models or benchmarks on top of this combined spectral-textual resource.
Where Pith is reading between the lines
- The same annotation approach could be tested on multispectral or SAR imagery to check whether textual captions transfer across sensor types.
- If the captions prove stable, the dataset might support zero-shot or few-shot land cover mapping in new geographic regions.
- Integration with temporal hyperspectral sequences could enable change detection described in natural language.
Load-bearing premise
The hybrid automated and manual annotation process produces accurate and consistent pixel-wise textual descriptions that meaningfully capture land cover semantics.
What would settle it
Independent expert re-annotation of a random sample of pixels that finds frequent mismatches between the provided captions and actual land cover types would show the annotations do not reliably capture semantics.
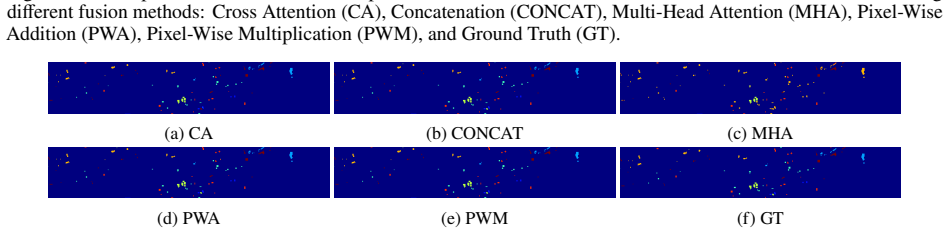
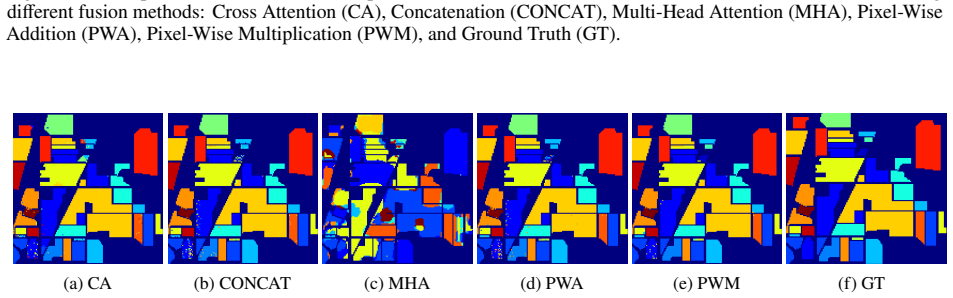
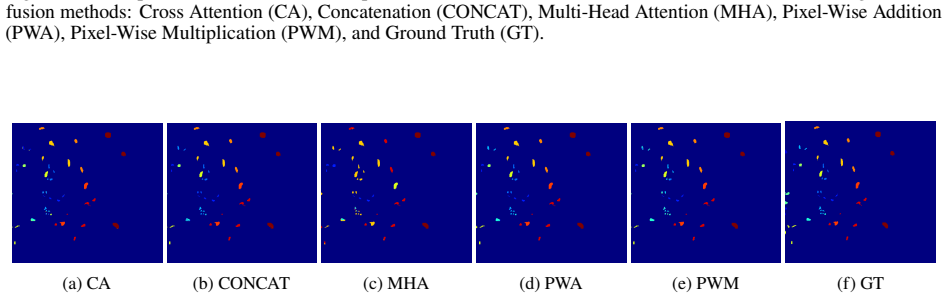
Figures


read the original abstract
We introduce HyperCap, the first large-scale hyperspectral captioning dataset designed to enhance model performance and effectiveness in remote sensing applications. Unlike traditional hyperspectral imaging (HSI) benchmarks, HyperCap integrates spectral data with pixel-wise textual annotations, enabling deeper semantic understanding. This dataset enhances model performance in tasks like classification and feature extraction, providing a valuable resource for advanced remote sensing applications. HyperCap is constructed from four benchmark datasets and annotated through a hybrid approach combining automated and manual methods to ensure accuracy and consistency. Empirical evaluations using state-of-the-art encoders and diverse fusion techniques demonstrate significant improvements in classification performance. These results underscore the potential of vision-language learning in HSI and position HyperCap as a foundational dataset for future research in the field. The code and dataset are available at https://github.com/arya-domain/HyperCap.
Editorial analysis
A structured set of objections, weighed in public.
Referee Report
Summary. The manuscript introduces HyperCap, the first large-scale hyperspectral captioning dataset for vision-language models in remote sensing. Constructed from four existing HSI benchmark datasets, it provides pixel-wise textual annotations generated via a hybrid automated-plus-manual process. The central claim is that empirical evaluations with state-of-the-art encoders and diverse fusion techniques yield significant improvements in land-cover classification performance, positioning the dataset as foundational for multimodal HSI research. The code and dataset are released publicly.
Significance. If the pixel-wise captions prove semantically faithful and the classification gains are reproducible with proper controls, HyperCap could meaningfully advance vision-language approaches in hyperspectral remote sensing by supplying paired spectral-textual data at scale. The public release of code and data is a clear strength that supports reproducibility and community follow-up work.
major comments (2)
- [Dataset Construction] Dataset Construction section: the hybrid automated and manual annotation process is described but supplies no quantitative validation metrics such as inter-annotator agreement, caption-error rates, or expert-verification statistics. This is load-bearing for the central claim because any observed classification improvements could be driven by label noise or semantic drift rather than the intended multimodal signal.
- [Empirical Evaluations] Empirical Evaluations / Abstract: the claim of 'significant improvements in classification performance' using state-of-the-art encoders and diverse fusion techniques is asserted without reporting specific quantitative metrics, baseline comparisons, error bars, data-split details, or statistical tests. This leaves the headline empirical result unsupported from the provided text.
minor comments (2)
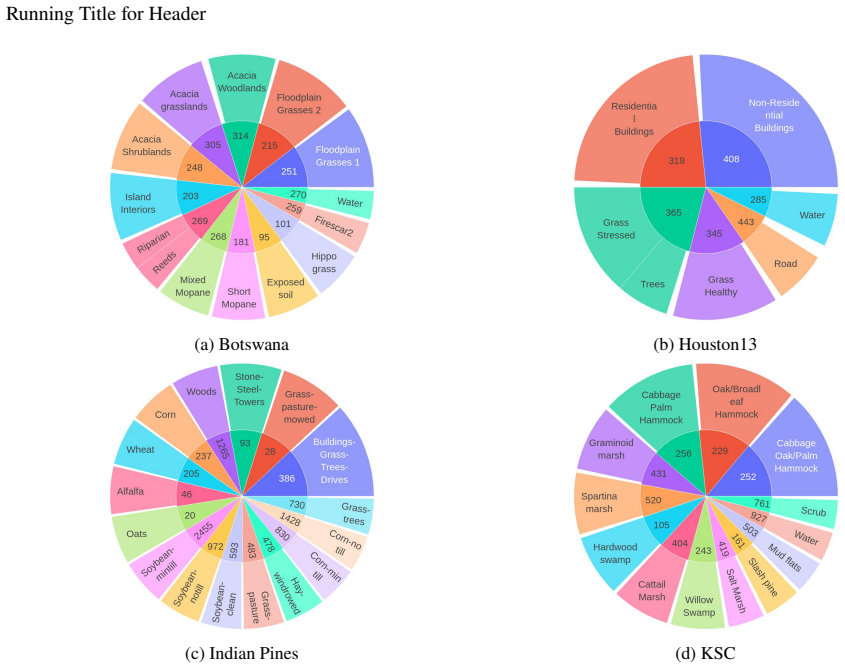
- [Abstract] Abstract: the four source HSI datasets are referenced generically; explicitly naming them (e.g., Indian Pines, Salinas) would improve clarity and allow readers to assess coverage immediately.
- [Notation and figures] Notation and figures: ensure consistent capitalization of 'HSI' and 'VLM' after first use, and verify that any result tables include standard deviation or confidence intervals for the reported metrics.
Simulated Author's Rebuttal
We thank the referee for the constructive feedback on our manuscript. We address each major comment below and indicate where revisions will be made to improve clarity and support for our claims.
read point-by-point responses
-
Referee: [Dataset Construction] Dataset Construction section: the hybrid automated and manual annotation process is described but supplies no quantitative validation metrics such as inter-annotator agreement, caption-error rates, or expert-verification statistics. This is load-bearing for the central claim because any observed classification improvements could be driven by label noise or semantic drift rather than the intended multimodal signal.
Authors: We agree that quantitative validation metrics for the annotation process would strengthen the manuscript. The current text describes the hybrid automated-manual workflow but does not report inter-annotator agreement, error rates, or expert verification statistics. In the revised version we will add a new paragraph in the Dataset Construction section that includes these metrics, computed on a representative sample of captions, to demonstrate semantic fidelity and rule out substantial label noise. revision: yes
-
Referee: [Empirical Evaluations] Empirical Evaluations / Abstract: the claim of 'significant improvements in classification performance' using state-of-the-art encoders and diverse fusion techniques is asserted without reporting specific quantitative metrics, baseline comparisons, error bars, data-split details, or statistical tests. This leaves the headline empirical result unsupported from the provided text.
Authors: The Empirical Evaluations section of the full manuscript contains tables with accuracy numbers, baseline comparisons, and data-split descriptions. However, we acknowledge that the abstract and high-level claims do not explicitly include error bars or statistical tests. We will revise the abstract to report key quantitative improvements with standard deviations and will add a brief statement on statistical testing in the main text to make the empirical results fully transparent. revision: partial
Circularity Check
No circularity detected in derivation or claims
full rationale
This is a dataset-construction paper that assembles HyperCap from four existing HSI benchmarks via a hybrid automated-plus-manual annotation pipeline and then runs standard empirical evaluations with off-the-shelf encoders and fusion methods. No equations, fitted parameters, predictions, or uniqueness theorems appear; the central claim is simply that the new captions improve downstream classification when used with existing vision-language techniques. All reported results are therefore independent of any self-referential reduction and rest on external benchmarks and models.
Axiom & Free-Parameter Ledger
Lean theorems connected to this paper
-
IndisputableMonolith/Foundation/RealityFromDistinction.leanreality_from_one_distinction unclear?
unclearRelation between the paper passage and the cited Recognition theorem.
We introduce HyperCap, the first large-scale hyperspectral captioning dataset... annotated through a hybrid approach combining automated and manual methods... Empirical evaluations using state-of-the-art encoders and diverse fusion techniques demonstrate significant improvements in classification performance.
-
IndisputableMonolith/Cost/FunctionalEquation.leanwashburn_uniqueness_aczel unclear?
unclearRelation between the paper passage and the cited Recognition theorem.
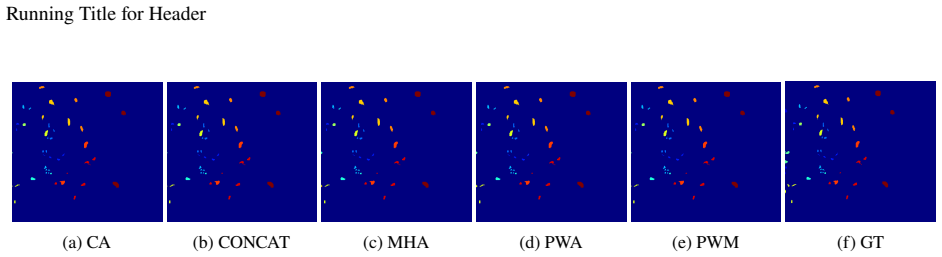
Tables 3-4 report OA/Precision/Kappa/F1 gains from text fusion on Botswana, Houston13, Indian Pines, KSC.
What do these tags mean?
- matches
- The paper's claim is directly supported by a theorem in the formal canon.
- supports
- The theorem supports part of the paper's argument, but the paper may add assumptions or extra steps.
- extends
- The paper goes beyond the formal theorem; the theorem is a base layer rather than the whole result.
- uses
- The paper appears to rely on the theorem as machinery.
- contradicts
- The paper's claim conflicts with a theorem or certificate in the canon.
- unclear
- Pith found a possible connection, but the passage is too broad, indirect, or ambiguous to say the theorem truly supports the claim.
Reference graph
Works this paper leans on
-
[1]
Deep learning techniques for hyperspectral image analysis in agriculture: A review,
M. F. Guerri, C. Distante, P. Spagnolo, F. Bougourzi, and A. Taleb-Ahmed, “Deep learning techniques for hyperspectral image analysis in agriculture: A review,”ISPRS Open Journal of Photogrammetry and Remote Sensing, vol. 12, p. 100062, 2024
work page 2024
-
[2]
Deep learning for hyperspectral image classification: An overview,
S. Li, W. Song, L. Fang, Y. Chen, P. Ghamisi, and J. A. Benediktsson, “Deep learning for hyperspectral image classification: An overview,”IEEE Transactions on Geoscience and Remote Sensing, vol. 57, no. 9, pp. 6690–6709, 2019
work page 2019
-
[3]
Integration of remote sensing and crowdsourced data for fine-grained urban flood detection,
Z. Liu, J. Li, L. Wang, and A. Plaza, “Integration of remote sensing and crowdsourced data for fine-grained urban flood detection,”IEEE Journal of Selected Topics in Applied Earth Observations and Remote Sensing, vol. 17, pp. 13523–13532, 2024
work page 2024
-
[4]
A survey: Deep learning for hyperspectral image classification with few labeled samples,
S. Jia, S. Jiang, Z. Lin, N. Li, M. Xu, and S. Yu, “A survey: Deep learning for hyperspectral image classification with few labeled samples,”Neurocomputing, vol. 448, pp. 179–204, 2021
work page 2021
-
[5]
Hyperspectral image super resolution with real unaligned rgb guidance,
Z. Lai, Y. Fu, and J. Zhang, “Hyperspectral image super resolution with real unaligned rgb guidance,”IEEE Transactions on Neural Networks and Learning Systems, vol. 36, no. 2, pp. 2999–3011, 2025
work page 2025
-
[6]
A new cnn training approach with application to hyperspectral image classification,
S. Kutluk, K. Kayabol, and A. Akan, “A new cnn training approach with application to hyperspectral image classification,” Digital Signal Processing, vol. 113, p. 103016, 2021
work page 2021
-
[7]
Attention-based adaptive spectral–spatial kernel resnet for hyperspectral image classification,
S. K. Roy, S. Manna, T. Song, and L. Bruzzone, “Attention-based adaptive spectral–spatial kernel resnet for hyperspectral image classification,”IEEE Transactions on Geoscience and Remote Sensing, vol. 59, no. 9, pp. 7831–7843, 2020
work page 2020
-
[8]
Hyperspectral image transformer classification networks,
X. Yang, W. Cao, Y. Lu, and Y. Zhou, “Hyperspectral image transformer classification networks,”IEEE Transactions on Geoscience and Remote Sensing, vol. 60, pp. 1–15, 2022
work page 2022
-
[9]
Multimodal fusion transformer for remote sensing image classification,
S. K. Roy, A. Deria, D. Hong, B. Rasti, A. Plaza, and J. Chanussot, “Multimodal fusion transformer for remote sensing image classification,”IEEE Transactions on Geoscience and Remote Sensing, vol. 61, pp. 1–20, 2023
work page 2023
-
[10]
Spectral–spatial morphological attention transformer for hyperspectral image classification,
S. K. Roy, A. Deria, C. Shah, J. M. Haut, Q. Du, and A. Plaza, “Spectral–spatial morphological attention transformer for hyperspectral image classification,”IEEE Transactions on Geoscience and Remote Sensing, vol. 61, pp. 1–15, 2023
work page 2023
-
[11]
L. He, J. Li, C. Liu, and S. Li, “Recent advances on spectral–spatial hyperspectral image classification: An overview and new guidelines,”IEEE Transactions on Geoscience and Remote Sensing, vol. 56, no. 3, pp. 1579–1597, 2018
work page 2018
-
[12]
Ai-driven hsi: Multimodality, fusion, challenges, and the deep learning revolution,
D. S. Bhatti, Y. Choi, R. S. Wahidur, M. Bakhtawar, S. Kim, S. Lee, Y. Lee, and H.-N. Lee, “Ai-driven hsi: Multimodality, fusion, challenges, and the deep learning revolution,”arXiv preprint arXiv:2502.06894, 2025
-
[13]
L. Zhao, W. Luo, Q. Liao, S. Chen, and J. Wu, “Hyperspectral image classification with contrastive self-supervised learning under limited labeled samples,”IEEE Geoscience and Remote Sensing Letters, vol. 19, pp. 1–5, 2022
work page 2022
-
[14]
A semisupervised siamese network for hyperspectral image classification,
S. Jia, S. Jiang, Z. Lin, M. Xu, W. Sun, Q. Huang, J. Zhu, and X. Jia, “A semisupervised siamese network for hyperspectral image classification,”IEEE Transactions on Geoscience and Remote Sensing, vol. 60, pp. 1–17, 2022
work page 2022
-
[15]
Towards explainable ai for hyperspectral image classification in edge computing environments,
G. De Lucia, M. Lapegna, and D. Romano, “Towards explainable ai for hyperspectral image classification in edge computing environments,”Computers and Electrical Engineering, vol. 103, p. 108381, 2022
work page 2022
-
[16]
Progressive semantic-visual mutual adaption for generalized zero-shot learning,
M. Liu, F. Li, C. Zhang, Y. Wei, H. Bai, and Y. Zhao, “Progressive semantic-visual mutual adaption for generalized zero-shot learning,”inProceedingsoftheIEEE/CVFConferenceonComputerVisionandPatternRecognition(CVPR) ,pp.15337–15346, June 2023
work page 2023
-
[17]
Geochat: Grounded large vision-language model for remote sensing,
K. Kuckreja, M. S. Danish, M. Naseer, A. Das, S. Khan, and F. S. Khan, “Geochat: Grounded large vision-language model for remote sensing,” inProceedings of the IEEE/CVF Conference on Computer Vision and Pattern Recognition (CVPR), pp. 27831–27840, June 2024
work page 2024
-
[18]
Recurrent attention and semantic gate for remote sensing image captioning,
Y. Li, X. Zhang, J. Gu, C. Li, X. Wang, X. Tang, and L. Jiao, “Recurrent attention and semantic gate for remote sensing image captioning,”IEEE Transactions on Geoscience and Remote Sensing, vol. 60, pp. 1–16, 2022
work page 2022
-
[19]
Attention multisource fusion-based deep few-shot learning for hyperspectral image classification,
X. Liang, Y. Zhang, and J. Zhang, “Attention multisource fusion-based deep few-shot learning for hyperspectral image classification,”IEEE Journal of Selected Topics in Applied Earth Observations and Remote Sensing, vol. 14, pp. 8773–8788, 2021
work page 2021
-
[20]
High-resolutionremotesensingimagecaptioningbasedonstructuredattention,
R.Zhao,Z.Shi,andZ.Zou,“High-resolutionremotesensingimagecaptioningbasedonstructuredattention,” IEEETransactions on Geoscience and Remote Sensing, vol. 60, pp. 1–14, 2022
work page 2022
-
[21]
P. Ghamisi, B. Rasti, N. Yokoya, Q. Wang, B. Hofle, L. Bruzzone, F. Bovolo, M. Chi, K. Anders, R. Gloaguen, P. M. Atkinson, and J. A. Benediktsson, “Multisource and multitemporal data fusion in remote sensing: A comprehensive review of the state of the art,”IEEE Geoscience and Remote Sensing Magazine, vol. 7, no. 1, pp. 6–39, 2019
work page 2019
-
[22]
220 band aviris hyperspectral image data set: June 12, 1992 indian pine test site 3,
M. Baumgardner, L. Biehl, and D. Landgrebe, “220 band aviris hyperspectral image data set: June 12, 1992 indian pine test site 3,”https://purr.purdue.edu/publications/1947/1, 2015
work page 1992
-
[23]
Contrastivemultiviewsubspaceclusteringofhyperspectral images based on graph convolutional networks,
R.Guan,Z.Li,W.Tu,J.Wang,Y.Liu,X.Li,C.Tang,andR.Feng,“Contrastivemultiviewsubspaceclusteringofhyperspectral images based on graph convolutional networks,”IEEE Transactions on Geoscience and Remote Sensing, vol. 62, pp. 1–14, 2024
work page 2024
-
[24]
Enhanced multiscale feature fusion network for hsi classification,
J. Yang, C. Wu, B. Du, and L. Zhang, “Enhanced multiscale feature fusion network for hsi classification,”IEEE Transactions on Geoscience and Remote Sensing, vol. 59, no. 12, pp. 10328–10347, 2021. 20 Running Title for Header
work page 2021
-
[25]
Adaptive hybrid attention network for hyperspectral image classification,
S. Pande and B. Banerjee, “Adaptive hybrid attention network for hyperspectral image classification,”Pattern Recognition Letters, vol. 144, pp. 6–12, 2021
work page 2021
-
[26]
Anovelspatial–spectralpyramidnetworkforhyperspectralimageclassification,
J.Zhou,S.Zeng,G.Gao,Y.Chen,andY.Tang,“Anovelspatial–spectralpyramidnetworkforhyperspectralimageclassification,” IEEE Transactions on Geoscience and Remote Sensing, vol. 61, pp. 1–14, 2023
work page 2023
-
[27]
Hyperspectral image classification using 3d 2d cnn,
A. Diakite, G. Jiangsheng, and F. Xiaping, “Hyperspectral image classification using 3d 2d cnn,”IET Image Processing, vol. 15, no. 5, pp. 1083–1092, 2021
work page 2021
-
[28]
R. Yenni and P. Arun, “Semantic segmentation and spatial relationship modeling in hyperspectral imagery using deep learning and graph-based representations,” in2024 14th Workshop on Hyperspectral Imaging and Signal Processing: Evolution in Remote Sensing (WHISPERS), pp. 1–4, IEEE, 2024
work page 2024
-
[29]
Multispectral data mining: A focus on remote sensing satellite images,
S. L. Lim, J. Sreevalsan-Nair, and B. Daya Sagar, “Multispectral data mining: A focus on remote sensing satellite images,” Wiley Interdisciplinary Reviews: Data Mining and Knowledge Discovery, vol. 14, no. 2, p. e1522, 2024
work page 2024
-
[30]
Theharmonizedlandsat and sentinel-2 surface reflectance data set,
M.Claverie, J.Ju, J.G.Masek, J.L.Dungan, E.F.Vermote, J.-C.Roger, S.V.Skakun, andC.Justice, “Theharmonizedlandsat and sentinel-2 surface reflectance data set,”Remote sensing of environment, vol. 219, pp. 145–161, 2018
work page 2018
-
[31]
T.A.Lake, R.D.BriscoeRunquist, andD.A.Moeller, “Deeplearningdetectsinvasiveplantspeciesacrosscomplexlandscapes using worldview-2 and planetscope satellite imagery,”Remote Sensing in Ecology and Conservation, vol. 8, no. 6, pp. 875–889, 2022
work page 2022
-
[32]
X. Sun, P. Wang, Z. Yan, F. Xu, R. Wang, W. Diao, J. Chen, J. Li, Y. Feng, T. Xu,et al., “Fair1m: A benchmark dataset for fine-grained object recognition in high-resolution remote sensing imagery,”ISPRS Journal of Photogrammetry and Remote Sensing, vol. 184, pp. 116–130, 2022
work page 2022
-
[33]
A. Chen and M. Xu, “Remote sensing image scene classification based on mutual learning with complementary multi-features,” IEEE Access, vol. 13, pp. 33436–33454, 2025
work page 2025
-
[34]
Scene attention mechanism for remote sensing image caption generation,
S. Wu, X. Zhang, X. Wang, C. Li, and L. Jiao, “Scene attention mechanism for remote sensing image caption generation,” in 2020 International Joint Conference on Neural Networks (IJCNN), pp. 1–7, 2020
work page 2020
-
[35]
Direction-oriented visual–semantic embedding model for remote sensing image–text retrieval,
Q. Ma, J. Pan, and C. Bai, “Direction-oriented visual–semantic embedding model for remote sensing image–text retrieval,” IEEE Transactions on Geoscience and Remote Sensing, vol. 62, pp. 1–14, 2024
work page 2024
-
[36]
Nwpu-captions dataset and mlca-net for remote sensing image captioning,
Q. Cheng, H. Huang, Y. Xu, Y. Zhou, H. Li, and Z. Wang, “Nwpu-captions dataset and mlca-net for remote sensing image captioning,”IEEE Transactions on Geoscience and Remote Sensing, vol. 60, pp. 1–19, 2022
work page 2022
-
[37]
Object detection in aerial images using dota dataset: A survey,
Z. Chen, H. Wang, X. Wu, J. Wang, X. Lin, C. Wang, K. Gao, M. Chapman, and D. Li, “Object detection in aerial images using dota dataset: A survey,”International Journal of Applied Earth Observation and Geoinformation, vol. 134, p. 104208, 2024
work page 2024
-
[38]
Modality fusion vision transformer for hyperspectral and lidar data collaborative classification,
B. Yang, X. Wang, Y. Xing, C. Cheng, W. Jiang, and Q. Feng, “Modality fusion vision transformer for hyperspectral and lidar data collaborative classification,”IEEE Journal of Selected Topics in Applied Earth Observations and Remote Sensing, vol. 17, pp. 17052–17065, 2024
work page 2024
-
[39]
Aerorit: A new scene for hyperspectral image analysis,
A. Rangnekar, N. Mokashi, E. J. Ientilucci, C. Kanan, and M. J. Hoffman, “Aerorit: A new scene for hyperspectral image analysis,”IEEE Transactions on Geoscience and Remote Sensing, vol. 58, no. 11, pp. 8116–8124, 2020
work page 2020
-
[40]
Language-awaredomaingeneralizationnetworkforcross-scenehyperspectral image classification,
Y.Zhang,M.Zhang,W.Li,S.Wang,andR.Tao,“Language-awaredomaingeneralizationnetworkforcross-scenehyperspectral image classification,”IEEE Transactions on Geoscience and Remote Sensing, vol. 61, pp. 1–12, 2023
work page 2023
-
[41]
Z. Zhong, Y. Li, L. Ma, J. Li, and W.-S. Zheng, “Spectral–spatial transformer network for hyperspectral image classification: A factorized architecture search framework,”IEEE Transactions on Geoscience and Remote Sensing, vol. 60, pp. 1–15, 2022
work page 2022
-
[42]
Deep learning for classification of hyperspectral data: A comparative review,
N. Audebert, B. Le Saux, and S. Lefèvre, “Deep learning for classification of hyperspectral data: A comparative review,”IEEE Geoscience and Remote Sensing Magazine, vol. 7, pp. 159–173, June 2019
work page 2019
-
[43]
Y. Zhang, W. Li, M. Zhang, Y. Qu, R. Tao, and H. Qi, “Topological structure and semantic information transfer network for cross-scene hyperspectral image classification,”IEEE Transactions on Neural Networks and Learning Systems, pp. 1–14, 2021
work page 2021
-
[44]
Hyperspectral patterns with deep learning for classification for indian pines,
V. Vishwanath, K. Sreekanth, J. Prakash, A. Rajendran, and G. Gopakumar, “Hyperspectral patterns with deep learning for classification for indian pines,” in2024 15th International Conference on Computing Communication and Networking Technologies (ICCCNT), pp. 1–7, 2024
work page 2024
-
[45]
OpenAI, J. Achiam, S. Adler, S. Agarwal, L. Ahmad, I. Akkaya, F. L. Aleman, D. Almeida, J. Altenschmidt, S. Altman, S. Anadkat, R. Avila, I. Babuschkin, S. Balaji, V. Balcom, P. Baltescu, H. Bao, M. Bavarian, J. Belgum, I. Bello, J. Berdine, G. Bernadett-Shapiro, C. Berner, L. Bogdonoff, O. Boiko, M. Boyd, A.-L. Brakman, G. Brockman, T. Brooks, M. Brundag...
work page 2024
- [46]
- [47]
-
[48]
J. Li, D. Li, C. Xiong, and S. Hoi, “Blip: Bootstrapping language-image pre-training for unified vision-language understanding and generation,” inICML, 2022
work page 2022
-
[49]
GIT: A Generative Image-to-text Transformer for Vision and Language
J. Wang, Z. Yang, X. Hu, L. Li, K. Lin, Z. Gan, Z. Liu, C. Liu, and L. Wang, “Git: A generative image-to-text transformer for vision and language,”arXiv preprint arXiv:2205.14100, 2022
work page internal anchor Pith review Pith/arXiv arXiv 2022
-
[50]
mplug: Effective and effi- cient vision-language learning by cross-modal skip- connections
C. Li, H. Xu, J. Tian, W. Wang, M. Yan, B. Bi, J. Ye, H. Chen, G. Xu, Z. Cao,et al., “mplug: Effective and efficient vision-language learning by cross-modal skip-connections,”arXiv preprint arXiv:2205.12005, 2022
-
[51]
Vinvl: Revisiting visual representations in vision- language models,
P. Zhang, X. Li, X. Hu, J. Yang, L. Zhang, L. Wang, Y. Choi, and J. Gao, “Vinvl: Revisiting visual representations in vision- language models,” inProceedings of the IEEE/CVF conference on computer vision and pattern recognition, pp. 5579–5588, 2021
work page 2021
-
[52]
Visualbert: A simple and performant baseline for vision and language,
L. H. Li, M. Yatskar, D. Yin, C.-J. Hsieh, and K.-W. Chang, “Visualbert: A simple and performant baseline for vision and language,” 2019
work page 2019
-
[53]
Bert has more to offer: Bert layers combination yields better sentence embeddings,
M. Hosseini, M. Munia, and L. Khan, “Bert has more to offer: Bert layers combination yields better sentence embeddings,” in Findings of the Association for Computational Linguistics: EMNLP 2023, pp. 15419–15431, 2023
work page 2023
-
[54]
Microsoft COCO Captions: Data Collection and Evaluation Server
X. Chen, H. Fang, T.-Y. Lin, R. Vedantam, S. Gupta, P. Dollár, and C. L. Zitnick, “Microsoft coco captions: Data collection and evaluation server,”arXiv preprint arXiv:1504.00325, 2015
work page internal anchor Pith review Pith/arXiv arXiv 2015
-
[55]
Dbctnet: Double branch convolution-transformer network for hyperspectral image classification,
R. Xu, X.-M. Dong, W. Li, J. Peng, W. Sun, and Y. Xu, “Dbctnet: Double branch convolution-transformer network for hyperspectral image classification,”IEEE Transactions on Geoscience and Remote Sensing, vol. 62, pp. 1–15, 2024
work page 2024
-
[56]
Fahm: Frequency-awarehierarchicalmambaforhyperspectralimage classification,
P.Zhuang,X.Zhang,H.Wang,T.Zhang,L.Liu,andJ.Li,“Fahm: Frequency-awarehierarchicalmambaforhyperspectralimage classification,”IEEE Journal of Selected Topics in Applied Earth Observations and Remote Sensing, vol. 18, pp. 6299–6313, 2025
work page 2025
-
[57]
3d-convolution guided spectral-spatial transformer for hyperspectral image classification,
S. Varahagiri, A. Sinha, S. R. Dubey, and S. K. Singh, “3d-convolution guided spectral-spatial transformer for hyperspectral image classification,” in2024 IEEE Conference on Artificial Intelligence (CAI), pp. 8–14, IEEE, 2024
work page 2024
-
[58]
H. Jing, L. Wan, X. Xue, H. Zhang, and Y. Li, “3d-rcnet: Learning from transformer to build a 3d relational convnet for hyperspectral image classification,”arXiv preprint arXiv:2408.13728, 2024
-
[59]
Exploring the limits of transfer learning with a unified text-to-text transformer,
C. Raffel, N. Shazeer, A. Roberts, K. Lee, S. Narang, M. Matena, Y. Zhou, W. Li, and P. J. Liu, “Exploring the limits of transfer learning with a unified text-to-text transformer,”Journal of machine learning research, vol. 21, no. 140, pp. 1–67, 2020. 22
work page 2020
discussion (0)
Sign in with ORCID, Apple, or X to comment. Anyone can read and Pith papers without signing in.