REVIEW 4 major objections 6 minor 28 references
The emergence of critical stocks in market crash
T0 review · 4 major / 6 minor · reviewed 2026-08-14 · deepseek-v4-flash
Pith's one-line read Small stocks, not superspreaders, set the crash threshold
desk verdict Clean linear claim about price limits and market confidence, but the step from first-round failure to global collapse is asserted rather than proved; worth reviewing with major revision. read the letter →
The pith
A machine-rendered reading of the paper's core claim, the machinery that carries it, and where it could break.
The reading
What carries the argument
The load-bearing object is the weighted bipartite network of mutual fund companies and stocks, with edge weights equal to market value held. Contagion is governed by Eq. (2): an investor holding a failed stock sees a liquidity shock of size $\alpha A_{m,\tau+1}/A_{m,\tau}$; a stock fails when its accumulated loss reaches the down-limit $c$. The analytical core is the simplification in Eq. (5), which treats each initially failed stock's share of any investor's portfolio as negligible and turns the failure condition into a ratio of two parts of a neighboring stock's holdings: the part held by investors connected to the failed stock versus the part held by unconnected investors. From this ratio the paper defines nestedness (fraction of a stock's investors shared with another stock) and branching (degree of a stock relative to its largest investor's degree), which together identify the 'driving nodes' whose $\alpha_{ci}=1-c$ pins the phase boundary $\alpha_c=1-c$.
What would settle it
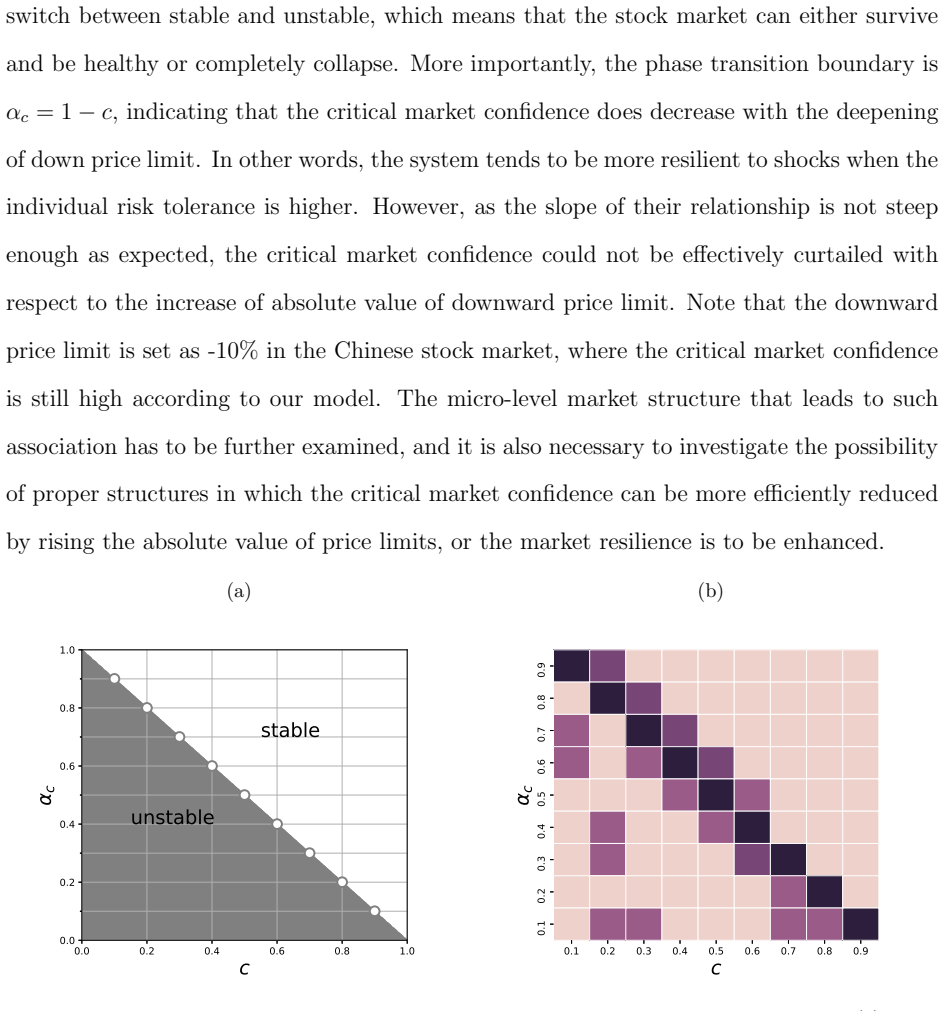
Look at the real ownership data behind Fig. S3(d) and evaluate the neglected ratio $\sum_{f\in F_\tau} w_{f,m,\tau=0}/A_m$ investor by investor, then recompute the neighbor thresholds $\alpha_{ci}$ from Eq. (4) instead of the simplified Eq. (5); if the median neglected ratio is not small, or if the largest $\alpha_{ci}$ no longer clusters on the diagonal $\alpha_{ci}=1-c$ in Fig. 2(b), the claimed phase boundary would not be the exact straight line. A direct experimental alternative: in the cascade model, remove all small stocks with nestedness equal to 1 on some shocked stock and check whether the boundary $\alpha_c = 1-c$ breaks; if the boundary persists, small driving nodes are not what sets it.
Extended reading notes
Core claim
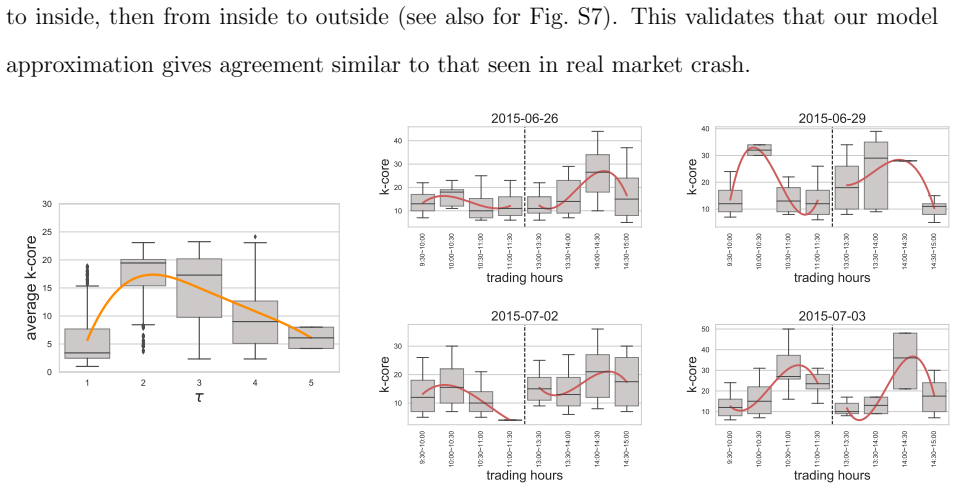
The central discovery is a parameter-free linear identity relating two quantities that previously had no established link: the critical market confidence $\alpha_c$ and the downward price limit $c$. In the bipartite stock-investor network, an initial stock failure reduces the portfolio values of all investors who hold it; those investors then sell other holdings, and the cascade continues if any stock's cumulative loss reaches the limit $c$. Through the model equations (Eqs. 3-5), the paper derives that a neighboring stock $i$ of the initially shocked stock requires at most $\alpha_{ci} = 1-c$ to avoid failure at the first step, and that the system-wide critical confidence is $\alpha_c = 1-c$. The derivation holds because the largest $\alpha_{ci}$ values belong to stocks fully nested in the shocked stock's investor neighborhood—small stocks whose investors also hold the shocked stock and are highly diversified. Empirically, the paper shows that these critical small stocks, with high nestedness and branching, appear at the periphery of the network, fail early, and pass the depression inward, matching the order of limit-down failures in the real 2015 Chinese market crash.
Load-bearing premise
The derivation of the exact boundary $\alpha_c = 1-c$ assumes that for every investor the market value of the initially failed stock is negligible compared with that investor's total holdings; if a failed stock is ever a meaningful share of someone's portfolio, the $\alpha_{ci}$ of its neighbors moves away from $1-c$ and the boundary shifts.
Editorial extensions
If this is right
- Raising the downward price limit lowers the critical market confidence only one-for-one; individual risk tolerance cannot buy large gains in system stability.
- A single driving node—one fully nested small stock next to the initially shocked stock—suffices to push the whole system into the unstable regime.
- Regulators protecting small-cap stocks with high nestedness and branching, rather than only the largest or most connected stocks, would directly address the collapse mechanism.
- Randomizing even a fraction of the investment network reduces nestedness and branching, steepens the phase boundary toward $\alpha_c = 1-2c$, and thereby improves market resilience.
- The model reproduces the observed 2015 crash sequencing—failures run from the network periphery to the core and then back out—so the contagion path could serve as an early-warning pattern.
Reading between the lines
- Our extension: the same $\alpha_c = 1-c$ logic should hold for any bipartite exposure network with a uniform loss limit—banks lending to overlapping firms, or exchanges and clearing members—so 'small nested peripheral nodes' may be a general signature of fragility, not a stock-market quirk.
- Our extension: the gap between the empirical slope $-1$ and the fully random slope $-2$ in Fig. 6 could be used as a measurable herding index; computing that slope from ownership data at different dates would yield a time-varying resilience score.
- Our extension: the derivation fixes market confidence $\alpha$ during the cascade; letting confidence decay as failures accumulate would likely steepen the boundary and sharpen the role of driving nodes, an assumption worth testing in the same data.
- Our extension: because the riskiest stocks are identified by topological features (nestedness and branching) available from ownership snapshots, an early-warning system could rank stocks by predicted $P_D$ before a crash and watch the tail of that distribution.
Signed reviews
Editorial analysis
A structured set of objections, weighed in public.
Referee Report
Summary. The paper studies cascading failures in a bipartite network between stocks and mutual-fund companies, parameterized by a price-limit c and a market-confidence alpha. It claims a critical market confidence alpha_c = 1 - c, derived analytically from a simplified failure condition and then 'verified' by simulations on a 2015 Chinese mutual-fund holding network, with supplementary evidence from four crash days in June-July 2015. The paper further argues that the boundary is set by small, fully nested 'driving nodes' rather than by high-degree superspreaders, and shows that randomizing the network changes the slope to -2, suggesting a policy intervention. The main theoretical derivation in Methods yields only a first-round neighbor-failure threshold, and the step from that local threshold to the global collapse boundary is asserted rather than proved.
Significance. If the global-collapse step were rigorously established, the paper would make a useful conceptual contribution: a simple linear phase boundary relating an individual risk-tolerance parameter to system resilience, and a structural mechanism (fully nested small stocks) that differs from the usual emphasis on hub nodes. The use of real holding data instead of synthetic networks and the data-availability statement are strengths. The local derivation of alpha_ci is clear, and the correlation analyses around PD, nestedness, and branching are suggestive. However, the central theoretical claim currently rests on an unproven equivalence between first-round neighbor failure and full-system collapse, so the significance is contingent on closing that gap.
major comments (4)
- [Results, 'Driving nodes' section; Methods, Eqs. (3)-(5)] The analytical derivation stops at the first-round threshold alpha_ci. Equation (4) gives the confidence at which a neighboring stock fails at tau=1; it does not establish that this failure propagates to all subsequent rounds. The sentence 'the initial shocks would cascade and cause the stock network collapses provided that there is at least one driving node' is an assertion, not a consequence of Eq. (4). A first-round failure can be contained if the next stocks are not fully nested in the enlarged failed set. Please provide a proof of the global-collapse criterion (e.g., an induction on a chain of fully nested stocks) or explicitly weaken the claim to a local necessary condition that is verified by simulation for this particular network.
- [Methods, 'Theoretical explanation', Eq. (5)] The simplification sum_{f in F_tau} w_{f,m,tau=0}/A_m approximately 0 is justified in the text only for tau=0 and only by Fig. S3(d), which shows single holding ratios. When F_tau contains many failed stocks, the ratio is the cumulative share of an investor's portfolio that has failed, and it need not remain small; hence Eq. (5) cannot be used without further justification to analyze later cascade rounds. This matters because the reported boundary alpha_c = 1 - c is claimed to be a system-wide property, not just a first-round property.
- [Results, 'Price limits and critical market confidence'; Abstract] Fig. 2(a) is a simulation of the proposed model itself on one network snapshot, not an independent test of the theoretical boundary. The real-crash analysis in Fig. 3(b) correlates PD with the timing of price-limit hits; it does not measure alpha_c. Please make explicit which claims are model predictions and which are supported by real market data; the abstract's phrase 'empirically verified' is too strong.
- [Results, 'Price limits and critical market confidence'] The procedure 'iterate over the stocks set to obtain the averaged outcomes' is ambiguous for a system-wide critical threshold. If alpha_c is the minimum confidence that guarantees stability for every possible initial shock, it should be the maximum, not the average, of the per-shock critical values. Please report the distribution or the worst-case value, and state the criterion used to decide that the system 'collapses' (e.g., fraction of stocks failed).
minor comments (6)
- [Methods, Step 2] There is a typo: 'Updata' should be 'Update'.
- [Results, 'Driving nodes' section] There are typos: 'empahsis' should be 'emphasizes', and in the Fig. 2(b) description 'diagnose' should be 'diagonal'.
- [Discussion] The phrase 'root case of the system collapse' should be 'root cause of the system collapse'.
- [Fig. 3(b) caption] The notation 'max( PD)' is awkward; please define it explicitly as the maximum of PD among the failed stocks in each time slot.
- [Model description] The terms 'system collapse' and 'the entire system' are used without an operational definition; specify the failure fraction or market-value threshold used to determine collapse in the simulations.
- [Fig. 5, left panel] The left panel contains visible '/uni0000...' character artifacts; the figure should be regenerated cleanly.
Circularity Check
No circular derivation: the alpha_c=1-c boundary is derived from the model equations; the only self-referential element is a non-load-bearing citation of the authors' earlier data-quality study.
full rationale
The core relation alpha_c = 1 - c is not a fit or a renamed input. It follows from the stated failure rule Eq. (1), the confidence-scaled devaluation Eq. (2), and the first-round boundary Eqs. (3)-(5); for a stock fully nested in the neighborhood of the initially shocked stock, the term sum_{m not in L} w_{i,m} vanishes and Eq. (5) yields alpha_ci = 1 - c. The phase diagram in Fig. 2(a) is a simulation of the same model on the empirical network, so it is a consistency check rather than an independent external test, but it is not used to fit the boundary. Real-crash evidence (Fig. 3b, k-core patterns in Fig. 5) provides an external check of the driving-node mechanism. The step from first-round driving-node failure to global collapse is asserted rather than proved; that is a modeling and rigor gap, not a circular reduction. The paper also acknowledges its own limited prediction power in the Discussion. The only self-reference is the citation of Lu et al. (2018) for the representativeness of the June 2015 ownership snapshot and for herding in Chinese funds; those claims support data quality and interpretation and do not enter the derivation of alpha_c = 1 - c. No equation in the paper is equivalent to its own input by construction.
Assumptions & free parameters
assumptions (6)
- domain assumption The market value of the initially failed stock held by an investor is negligible relative to that investor's total portfolio value (sum_{f in F_tau} w_{f,m,tau=0}/A_m ≈ 0).
- domain assumption Market confidence alpha is uniform across investors and fixed during the cascade.
- domain assumption Fire-sale contagion follows the proportional illiquidity rule: an investor's devaluation of all held stocks is scaled by alpha times the ratio of post-shock to pre-shock portfolio value (Eq. 2 and Methods Step 5).
- domain assumption The bipartite network built from mutual fund company holdings on June 30, 2015 represents the effective contagion channels of the whole Chinese stock market, including individual investors.
- domain assumption A stock fails (reaches limit down) when its cumulative loss from initial value reaches c, and failed stocks are removed as completely illiquid (Eq. 1 and Methods Steps 1-4).
- domain assumption The fully random network limit alpha_c = 1 - 2c assumes a dense network and equal holding probabilities for all investors.
Cite this review
Pith. "Pith review of The emergence of critical stocks in market crash." pith.science (2026). https://pith.science/paper/DQLT4KAU
@misc{pith2026190807244,
  author       = {Pith},
  title        = {Pith review of: The emergence of critical stocks in market crash},
  year         = {2026},
  howpublished = {\url{https://pith.science/paper/DQLT4KAU}},
  note         = {Machine review of arXiv:1908.07244}
}
read the original abstract
In complex systems like financial market, risk tolerance of individuals is crucial for system resilience.The single-security price limit, designed as risk tolerance to protect investors by avoiding sharp price fluctuation, is blamed for feeding market panic in times of crash.The relationship between the critical market confidence which stabilizes the whole system and the price limit is therefore an important aspect of system resilience. Using a simplified dynamic model on networks of investors and stocks, an unexpected linear association between price limit and critical market confidence is theoretically derived and empirically verified in this paper. Our results highlight the importance of relatively `small' but critical stocks that drive the system to collapse by passing the failure from periphery to core. These small stocks, largely originating from homogeneous investment strategies across the market, has unintentionally suppressed system resilience with the exclusive increment of individual risk tolerance. Imposing random investment requirements to mitigate herding behavior can thus improve the market resilience.
Figures


Figures from the paper (3 more)


Reference graph
Works this paper leans on
-
[1]
N. Anderson, L. Webber, J. Noss, D. Beale, and L. Crowley-Reidy . The resilience of financial market liquidity. Bank of England Financial Stability Paper, 34, 2015
work page 2015
-
[2]
N. Arinaminpathy, S. Kapadia, and R. M. May. Size and complexity in model financial systems. Proceedings of the National Academy of Sciences, 109 0 (45): 0 18338--18343, June 2012
work page 2012
-
[3]
M. Bardoscia, S. Battiston, F. Caccioli, and G. Caldarelli. Pathways towards instability in financial networks. Nature Communications, 8: 0 14416, Feb. 2017
work page 2017
-
[4]
R. Bildik and G. G\"ulay. Are price limits effective? Evidence from the Istanbul Stock Exchange . Journal of Financial Research, 29 0 (3): 0 383--403, 2006
work page 2006
-
[5]
J. Brugler, O. B. Linton, J. Noss, and L. Pedace. The cross-sectional spillovers of single stock circuit breakers. Bank of England Working Paper, 2018
work page 2018
-
[6]
F. Caccioli, M. Shrestha, C. Moore, and J. D. Farmer. Stability analysis of financial contagion due to overlapping portfolios. Journal of Banking & Finance, 46: 0 233--245, 2014
work page 2014
-
[7]
F. Caccioli, J. D. Farmer, N. Foti, and D. Rockmore. Overlapping portfolios, contagion, and financial stability. Journal of Economic Dynamics and Control, 51: 0 50--63, Feb. 2015
work page 2015
-
[8]
R. Cifuentes, G. Ferrucci, and H. S. Shin. Liquidity risk and contagion. Journal of the European Economic Association, 3 0 (2-3): 0 556--566, 2005
work page 2005
Show all 28 references
-
[9]
Cohen-Cole , A
E. Cohen-Cole , A. Kirilenko, and E. Patacchini. Trading networks and liquidity provision. Journal of Financial Economics, 113 0 (2): 0 235--251, Aug. 2014
2014
-
[10]
Corsi, S
F. Corsi, S. Marmi, and F. Lillo. When micro prudence increases macro risk: The destabilizing effects of financial innovation, leverage, and diversification. Operations Research, 64 0 (5): 0 1073--1088, 2016
2016
-
[11]
Coval and E
J. Coval and E. Stafford. Asset fire sales (and purchases) in equity markets. Journal of Financial Economics, 86 0 (2): 0 479--512, 2007
2007
-
[12]
Delpini, S
D. Delpini, S. Battiston, G. Caldarelli, and M. Riccaboni. Systemic risk from investment similarities. PLOS ONE, 14 0 (5): 0 1--15, 05 2019
2019
-
[13]
J. Gao, B. Barzel, and A.-L. Barab \'a si. Universal resilience patterns in complex networks. Nature, 530 0 (7590): 0 307--312, Feb. 2016
2016
-
[14]
Gao, H.-L
Y.-C. Gao, H.-L. Tang, S.-M. Cai, J.-J. Gao, and H. E. Stanley. The impact of margin trading on share price evolution: A cascading failure model investigation. Physica A: Statistical Mechanics and its Applications, 505: 0 69 -- 76, 2018
2018
-
[15]
A. G. Haldane and R. M. May. Systemic risk in banking ecosystems. Nature, 469: 0 351, Jan. 2011
2011
-
[16]
Huang, I
X. Huang, I. Vodenska, S. Havlin, and H. E. Stanley. Cascading failures in bi-partite graphs: model for systemic risk propagation. Scientific reports, 3: 0 1219--1219, Feb. 2013
2013
-
[17]
K. A. Kim and S. G. Rhee. Price limit performance: Evidence from the Tokyo Stock Exchange . the Journal of Finance, 52 0 (2): 0 885--901, 1997
1997
-
[18]
Kitsak, L
M. Kitsak, L. K. Gallos, S. Havlin, F. Liljeros, L. Muchnik, H. E. Stanley, and H. A. Makse. Identification of influential spreaders in complex networks. Nature Physics, 6 0 (11): 0 888--893, Nov. 2010
2010
-
[19]
X. Li, S. S. Wang, and X. Wang. Trust and stock price crash risk: Evidence from china. Journal of Banking & Finance, 76: 0 74 -- 91, 2017
2017
-
[20]
S. Lu, J. Zhao, H. Wang, and R. Ren. Herding boosts too-connected-to-fail risk in stock market of China . Physica A: Statistical Mechanics and its Applications, 505: 0 945--964, 2018
2018
-
[21]
R. M. May and N. Arinaminpathy. Systemic risk: The dynamics of model banking systems. Journal of the Royal Society Interface, 7 0 (46): 0 823--838, 2010
2010
-
[22]
Morone, G
F. Morone, G. Del Ferraro, and H. A. Makse. The k-core as a predictor of structural collapse in mutualistic ecosystems. Nature Physics, 15 0 (1): 0 95, 2019
2019
-
[23]
A. E. Motter. Cascade control and defense in complex networks. Physical Review Letters, 93 0 (9): 0 098701, 2004
2004
-
[24]
A. E. Motter and Y.-C. Lai. Cascade-based attacks on complex networks. Physical Review E, 66 0 (6): 0 065102, 2002
2002
-
[25]
Poledna, S
S. Poledna, S. Mart\'inez-Jaramillo , F. Caccioli, and S. Thurner. Quantification of systemic risk from overlapping portfolios in the financial system. arXiv preprint arXiv:1802.00311, 2018
2018 arXiv
-
[26]
Shen and B
S. Shen and B. Goh. China stock market freezing up as sell-off gathers pace. https://www.reuters.com/article/us-china-stocks-idUSKCN0PI04Q20150708, 2015. Reuters
2015
-
[27]
S. K. Stavroglou, A. A. Pantelous, H. E. Stanley, and K. M. Zuev. Hidden interactions in financial markets. Proceedings of the National Academy of Sciences, 116 0 (22): 0 10646--10651, 2019
2019
-
[28]
Tanizawa, G
T. Tanizawa, G. Paul, R. Cohen, S. Havlin, and H. E. Stanley. Optimization of network robustness to waves of targeted and random attacks. Physical Review E, 71 0 (4), Apr. 2005
2005
Reviewed August 14, 2026 · model on record in the stance chip above.
Discussion (0). Continue with ORCID to comment.