REVIEW 3 major objections 6 minor 2 cited by
Kinetic Simulations of Radiative Magnetic Reconnection in the Coronae of Accreting Black Holes
T0 review · 3 major / 6 minor · reviewed 2026-08-14 · deepseek-v4-flash
Pith's one-line read Radiative magnetic reconnection can power the hard-state emission of accreting black holes.
desk verdict Strong simulation paper on radiative reconnection with a clean central result, but the abstract overclaims the Cyg X-1 MeV tail explanation without a spectral calculation. read the letter →
The pith
A machine-rendered reading of the paper's core claim, the machinery that carries it, and where it could break.
The reading
What carries the argument
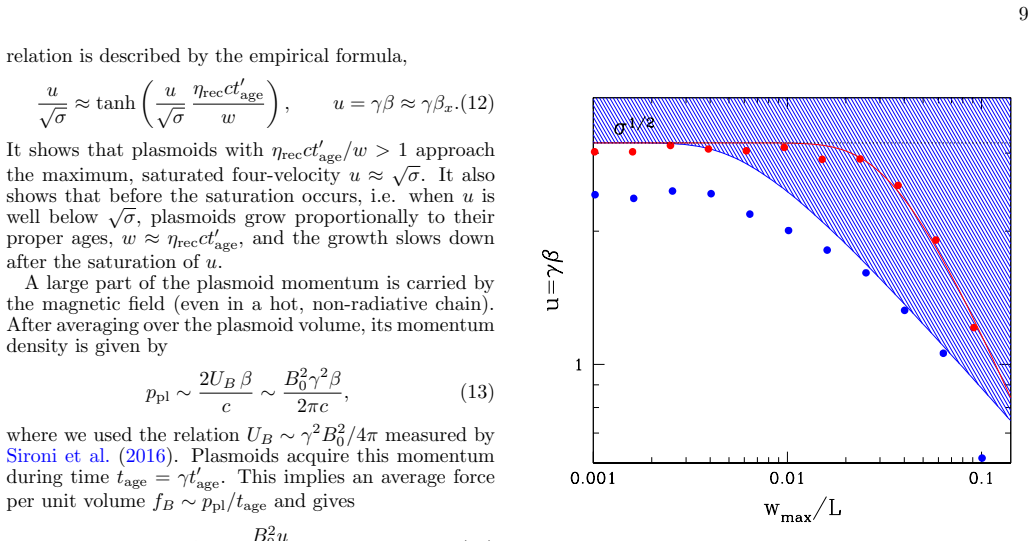
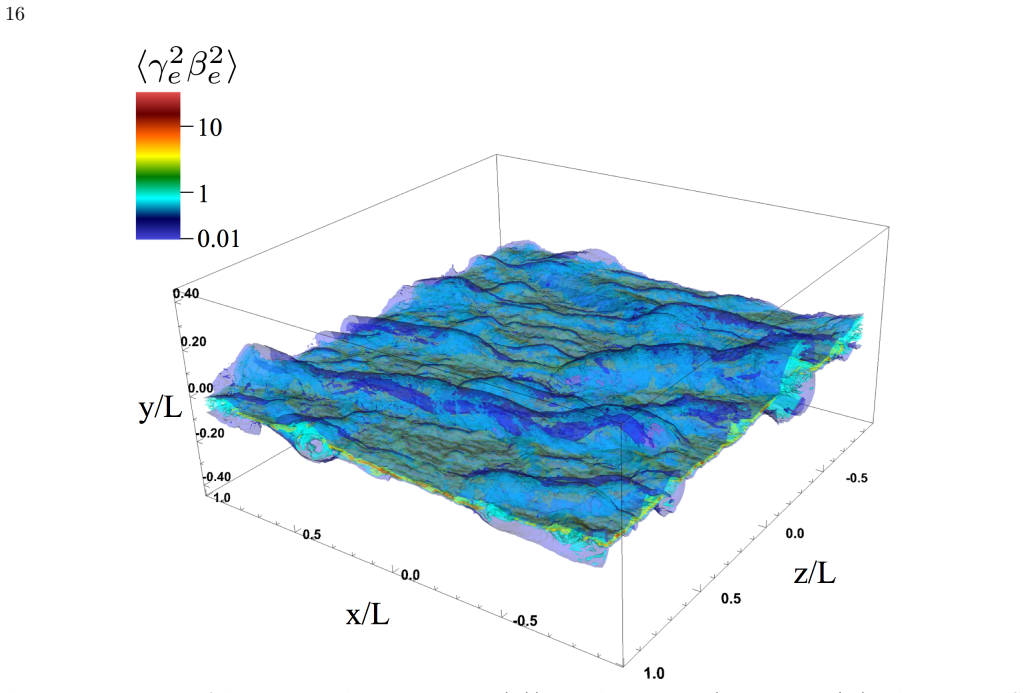
The central object is the plasmoid chain of relativistic reconnection: magnetic islands that carry most of the layer's inertia in the magnetic field and are pulled along the layer by magnetic tension. Compton cooling is modeled as a continuous drag force $F_{\rm IC}=-(4/3)\sigma_T\gamma_e^2 U_{\rm rad}\boldsymbol{\beta}_e$, controlled by the parameter $\gamma_{\rm cr}$, the Lorentz factor at which the reconnection electric field balances the drag. The argument is carried by balancing the magnetic tension force $f_B\sim B_0^2 u/(2\pi c t'_{\rm age})$ against the drag $f_{\rm drag}\sim(4/3)\gamma^2 U_{\rm rad}\sigma_T n'_{\rm pl}$, which predicts an 'avoidance zone' in the plasmoid size\u2013velocity plane and a cooling size $w_c\sim(\gamma_{\rm cr}^2/\sigma^{3/2})c/\omega_p$; plasmoids larger than $w_c$ are cold and radiate through their bulk motion. The non-radiative empirical relation $u/\sqrt{\sigma}=\tanh(\eta_{\rm rec}c t'_{\rm age}/w)$ serves as the baseline against which the radiative dynamics are tested.
What would settle it
A concrete check is to compute the expected spectrum from the simulated particle and bulk-velocity distributions and compare it with broad-band hard-state data of Cyg X-1; if the 100 keV peak requires a genuinely thermal electron population, or the MeV tail requires an additional non-inverse-Compton component, the central claim fails. A numerical test would rerun the simulations with a self-consistent, anisotropic, time-dependent radiation field to see whether the bulk-dominated peak and the $\sim20\%$ nonthermal tail survive.
Extended reading notes
Core claim
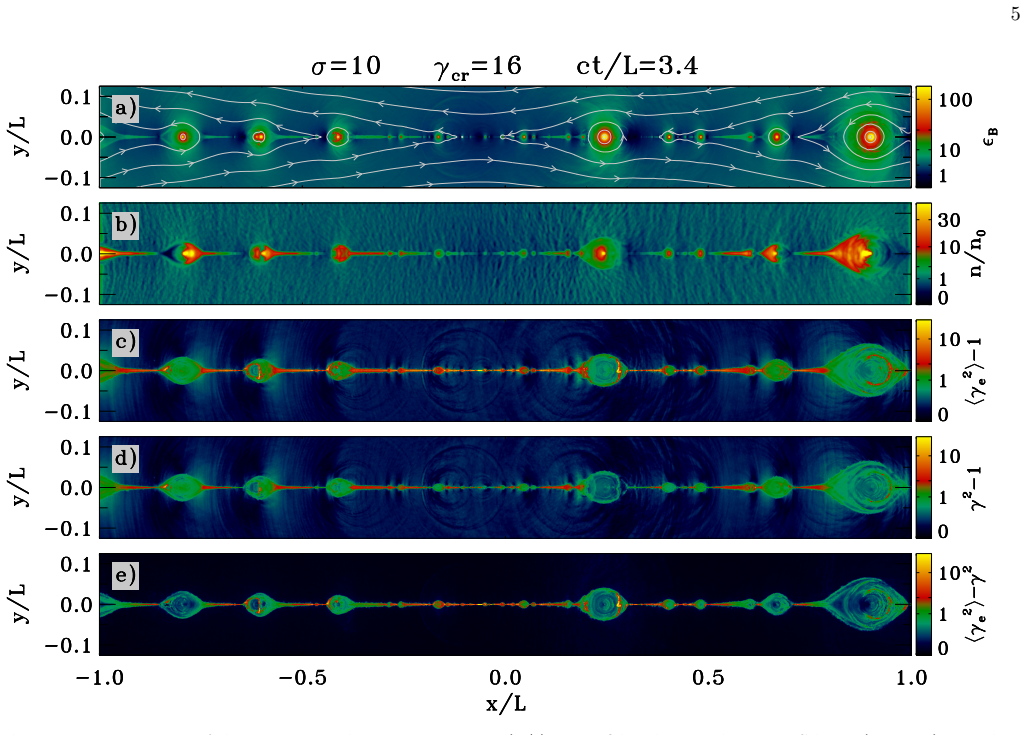
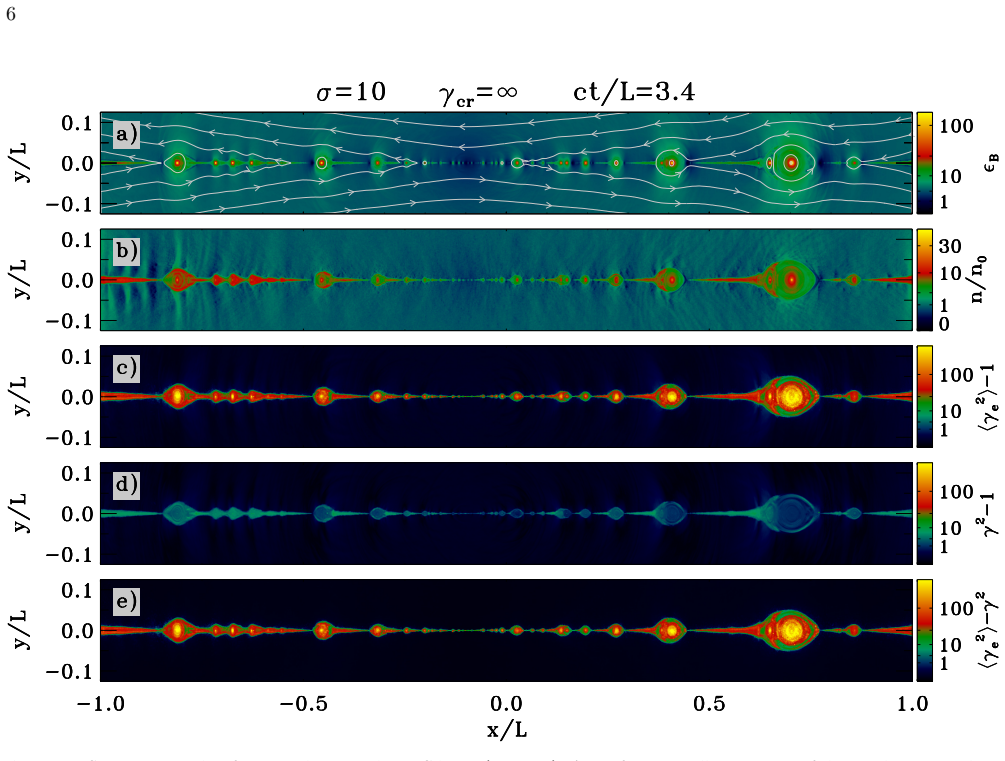
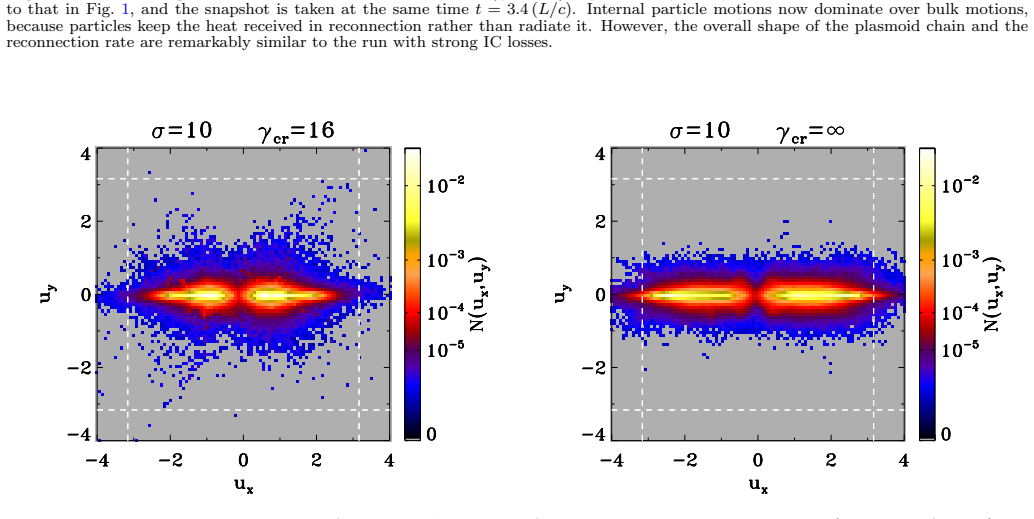
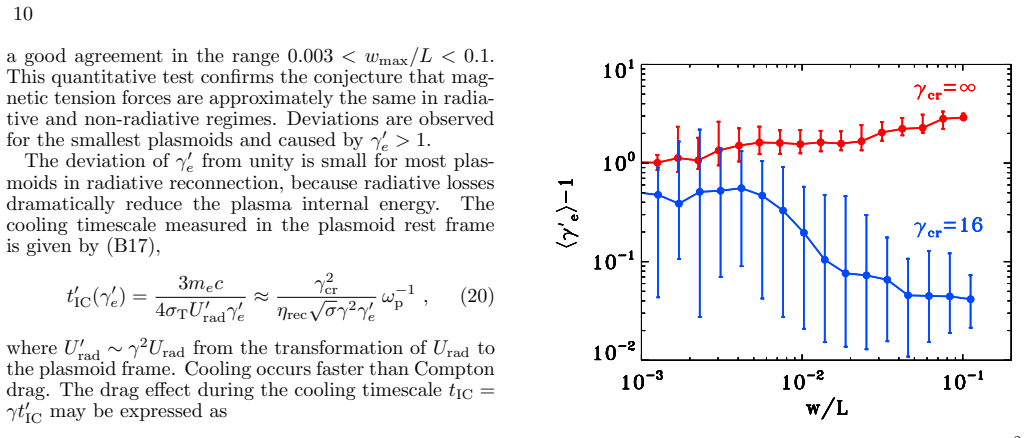
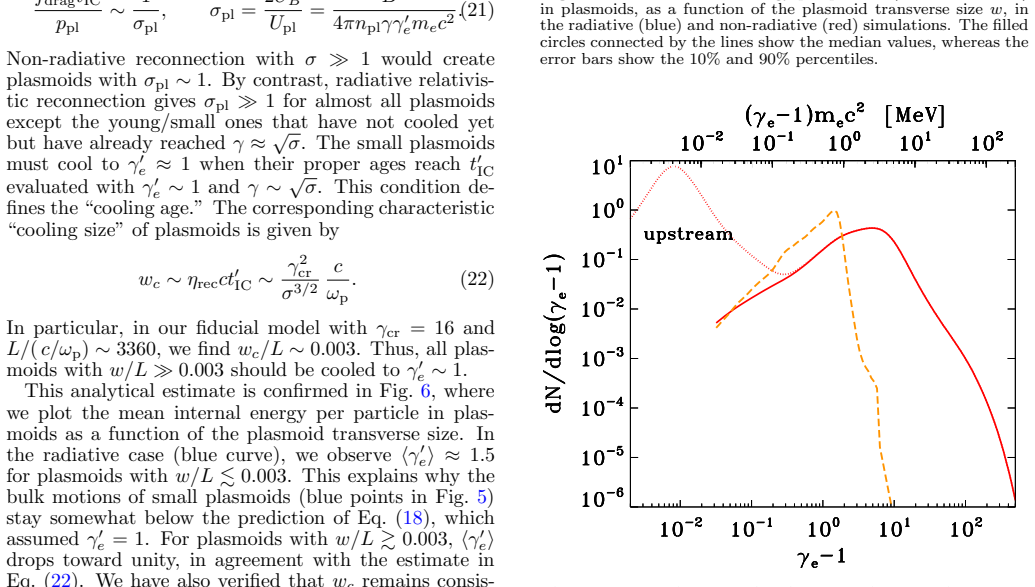
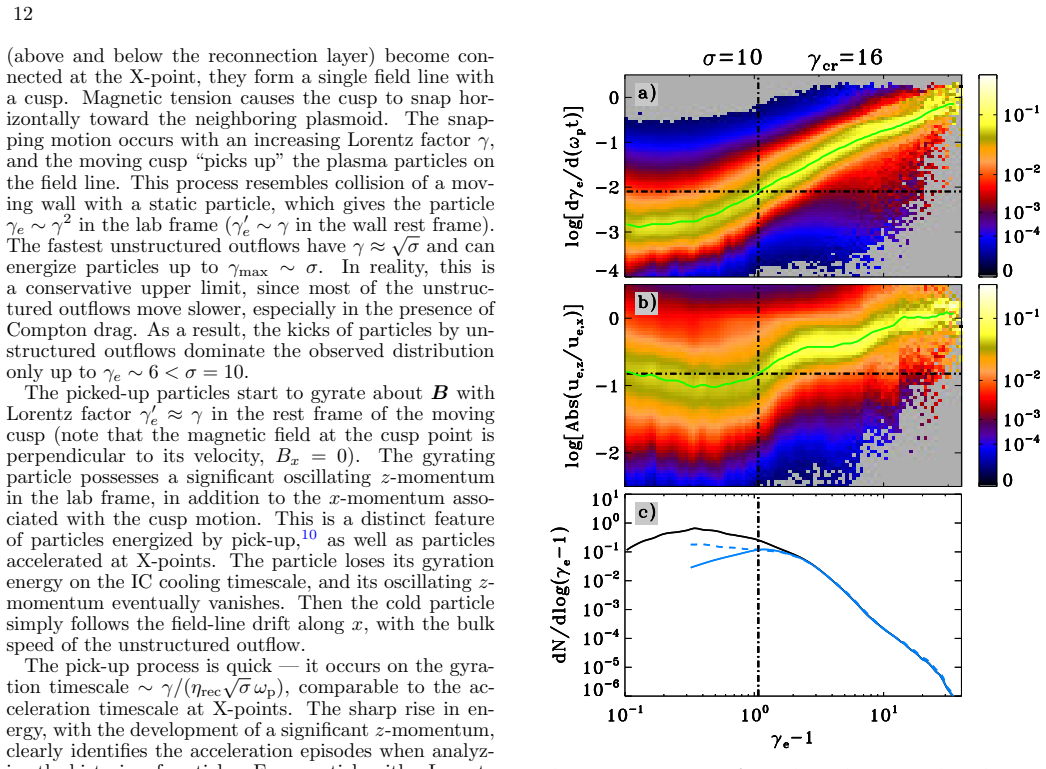
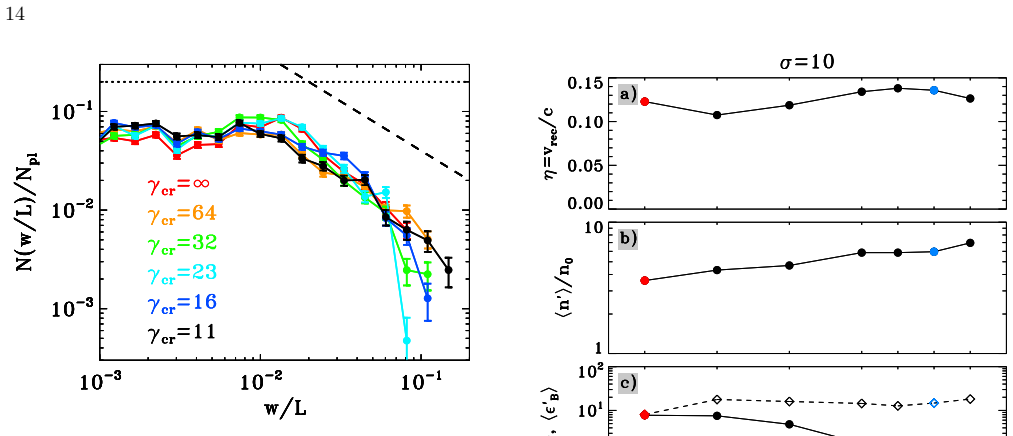
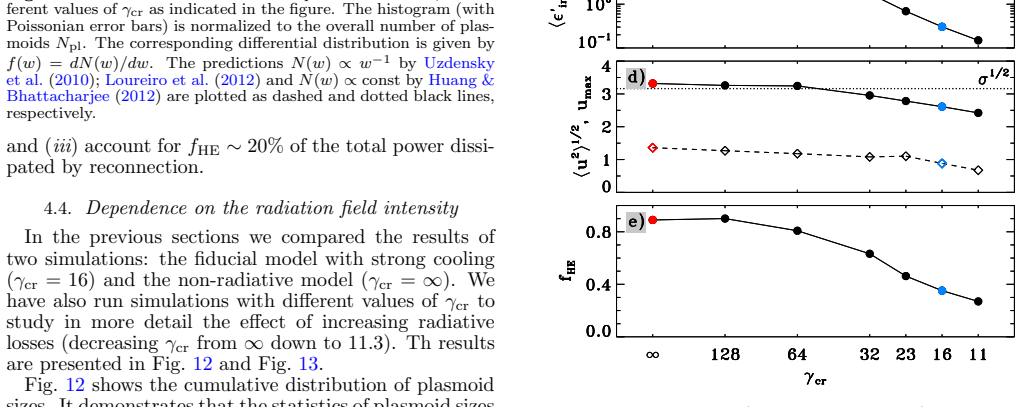
On its own terms, the paper claims that radiative reconnection in a magnetically dominated $e^\pm$ plasma with $\sigma=10$ reproduces the two observed spectral components of black hole hard states. The bulk of the power emerges as mildly relativistic bulk motions of cold, magnetically dominated plasmoids; their inverse Compton emission forms a quasi-Maxwellian peak with effective temperature $kT_b\sim100$ keV. A smaller but significant fraction, $f_{\rm HE}\sim20\%$, is emitted by nonthermal particles with $\gamma_e\gtrsim2$, injected nearly impulsively at X-points ($E_\parallel$ acceleration) and in unstructured outflows from X-points (pick-up), and this component accounts for the MeV tail of Cyg X-1. The radiative runs also show that the reconnection rate ($\eta_{\rm rec}\sim0.12$\u2013$0.14$) and the plasmoid size distribution are nearly unchanged from the non-radiative case, even though the internal energy of the layer drops by about two orders of magnitude, confirming that magnetic forces set the dynamics.
Load-bearing premise
The results rest on treating Compton cooling as a steady, angle-averaged friction force from a fixed bath of soft photons, while in a real corona the radiation is generated by the reconnection itself, is anisotropic, and contains photons energetic enough for Klein\u2013Nishina corrections; the simulated cooling hierarchy ($\gamma_{\rm cr}$ comparable to $\sigma$) is also far less extreme than the $\gamma_{\rm cr}\sim10^4$ inferred for real coronae.
Editorial extensions
If this is right
- The hard-state X-ray peak of accreting black holes can be produced without a genuinely thermal 100 keV electron population; bulk motions of cooled plasmoids mimic Comptonization.
- The MeV tail of Cyg X-1 can be explained by inverse Compton emission from the nonthermal tail that carries about 20% of dissipated reconnection power.
- Because cooling barely changes the reconnection rate and plasmoid size distribution, reconnection layers in coronae can be described by magnetic-stress-dominated (nearly force-free) dynamics.
- Radiative losses strongly suppress the nonthermal efficiency of reconnection compared with non-radiative simulations, so coronal models should not use non-radiative particle spectra.
- The 2D conclusions carry over to 3D flux-rope reconnection, so the bulk-motion-dominated peak and nonthermal tail are robust to dimensionality.
Reading between the lines
- If the fixed, isotropic, soft photon bath were replaced by a self-consistent radiation field produced by the reconnection layer itself, the values $kT_b\sim100$ keV and $f_{\rm HE}\sim20\%$ could shift; the qualitative bulk-dominated picture may survive, but the quantitative fit to Cyg X-1 is not guaranteed.
- The same mechanism suggests a sharp prediction: hard-state spectra should show a quasi-thermal component whose width tracks the plasmoid bulk velocity distribution rather than a single electron temperature, which spectropolarimetric or reverberation measurements could distinguish.
- The pick-up acceleration process identified here is likely generic to radiative reconnection and may operate in other magnetically dominated, radiation-drenched environments, where Klein\u2013Nishina corrections and anisotropy would modify the effective drag.
- Synthetic spectra computed from the simulated particle distributions, rather than from the analytic model that motivates the simulations, would give a direct, testable prediction for the coronal compactness and magnetization of individual sources.
Signed reviews
Editorial analysis
A structured set of objections, weighed in public.
Referee Report
Summary. The paper presents 2D and 3D particle-in-cell simulations of relativistic magnetic reconnection in electron-positron plasmas with strong inverse-Compton cooling, motivated by the coronae of accreting black holes. Compton losses are modeled as a continuous Thomson drag from a fixed, isotropic, low-energy radiation field, with the strength parameterized by gamma_cr. Comparing radiative runs (gamma_cr=16 and 11.3) with an otherwise identical non-radiative run (gamma_cr=infinity), the authors find that the reconnection rate, plasmoid size distribution, and magnetic structure are weakly affected by cooling; plasmoids become cold, magnetically dominated, and develop density cavities. Most dissipated power goes into bulk motions of cooled plasmoids, producing a quasi-Maxwellian particle-energy peak with effective temperature kT_b about 100 keV, while about 20% goes into a high-energy tail (gamma_e>2) generated by X-point acceleration and particle pick-up by outflows. The abstract and conclusions assert that the inverse Compton emission of this tail explains the MeV tail of Cyg X-1 and that radiative reconnection powers the hard state.
Significance. If the central claims hold, the paper is a significant step: it gives first-principle, kinetic support to the Beloborodov (2017) radiative-reconnection scenario and quantifies the energy partition between bulk plasmoid motions and nonthermal particles. The numerical work is careful: box half-lengths up to 6720 c/omega_p (full length 13440 c/omega_p), convergence checks in particle number, box size, and 3D effects, and detailed particle-history diagnostics for the acceleration mechanisms. The analytic avoidance-zone prediction (Eq. 18) is tested against the simulations, and f_HE about 20% with kT_b about 100 keV are falsifiable predictions. The main weakness is that no photon spectrum is computed, so the claimed explanation of the Cyg X-1 MeV tail is not established by the evidence in the manuscript.
major comments (3)
- [Abstract; Section 6] The abstract's statement that the inverse Compton emission of the high-energy tail 'explains the MeV spectral tail detected in the hard state of Cyg X-1' is not supported by any spectral calculation in the paper. Section 6's final paragraph explicitly leaves 'detailed calculations of the X-ray spectrum' to future work, and Section 2.1 implements only the drag force (Eq. 2), not an emission model. A radiated power fraction f_HE about 20% for gamma_e>2 particles does not by itself determine the emergent IC spectrum, which also depends on the photon energy distribution, scattering angles, Klein-Nishina corrections, and optical depth and escape geometry. I recommend rewording the abstract and conclusions to state that the simulations provide the particle distributions needed for future spectral modeling, or including a model spectrum.
- [Section 3; Section 4.4] The parameter mapping to black-hole coronae is extrapolated beyond the simulated range. The runs use gamma_cr=11.3-16 with sigma=10, while Eqs. (6) and (8) estimate gamma_cr~10^4 and sigma~400 for coronae. The hierarchy gamma_cr >> gamma_X with gamma_X~sigma/4 is only marginal in the simulations (gamma_cr/gamma_X is about 4.5-6.4), far from the astrophysical ratio ~100; Eq. (11) is a necessary but not sufficient condition for the quantitative results to carry over. Since Section 6 defers the dependence on sigma to future work and Fig. 13 does not reach gamma_cr >> sigma, the quoted values kT_b=100 keV and f_HE about 20% should be presented as regime-dependent results, or additional runs (or an analytic scaling argument) should be provided.
- [Section 2.1, Eq. (2); Section 6] The radiation field is fixed in time, isotropic, and has zero Compton temperature. In a real corona the radiation field is anisotropic, is at least partially produced by the reconnection layer itself, and has a nonzero Compton temperature, which changes both the cooling rate and the net drag on particles (hot photons can heat rather than cool mildly relativistic electrons). The headline numbers, namely the 100 keV bulk-temperature peak and f_HE about 20%, are measured under this idealized drag law. The simplification is acknowledged, but its quantitative impact on the results is not assessed; I ask for an explicit estimate of the corrections (e.g., finite Compton temperature, anisotropy, or Klein-Nishina effects) or a correspondingly careful qualification of the applicable regime.
minor comments (6)
- [Section 4.1] The text 'eta_rec/c is about 0.135' appears to have a dimensional error; it should read 'eta_rec is about 0.135' or 'v_rec/c is about 0.135'.
- [Section 2.1] The spelling 'Thompson' should be 'Thomson' in the discussion of the scattering regime.
- [Section 4.4] The sentence beginning 'Th results' contains a typo and should read 'The results'.
- [Section 2] The phrase 'four particles per cell (including both species)' is ambiguous; it should specify whether this is per species or per cell, since the convergence test with 16 particles per cell is described in the same way.
- [Section 4.3] The reporting of f_HE is confusing: the fiducial model gives 35%, the larger box gives 27%, and the summary states f_HE about 20%. A small table of f_HE as a function of gamma_cr and box size would clarify the convergence trend.
- [Section 5] The 3D conclusion rests on a single parameter set (gamma_cr=11.3, L=806c/omega_p, 2.5 cells per skin depth, one particle per cell); the statement that the main conclusions 'will hold in 3D models' is stronger than the evidence presented and could be softened.
Circularity Check
No significant circularity: central claims are direct simulation comparisons; the Eq. (18) check is a consistency test, and the deferred MeV-spectrum calculation is a completeness gap, not circularity.
full rationale
The derivation chain is self-contained at every load-bearing step. The main dynamical claims (reconnection rate, plasmoid size distribution, plasma internal energy) are established by direct comparison of a radiative run (gamma_cr = 16) with a non-radiative run (gamma_cr = infinity) that has otherwise identical parameters (Figs. 1, 2, 12, 13), so no fitted input is being renamed as a prediction. The 100 keV bulk-motion peak and f_HE ~ 20% are measurements from the PIC output, not outputs of a fitted model. The analytic 'avoidance zone' (Eq. 18) uses the prior empirical plasmoid-speed relation of Sironi et al. (2016) and the separately measured compression factor n'_pl/n0 ~ 6 from the same radiative run; because the predicted quantity u(w_max) is not used to set that normalization, the comparison is a consistency test rather than a circular prediction, and in any case it is secondary to the direct radiative-versus-non-radiative comparison. The paper does cite prior work by the same authors (B17; Sironi et al. 2016), but those citations supply the model framework and an empirical relation, not the validation of the central claim. The abstract's statement that the high-energy tail 'explains' the Cyg X-1 MeV bump goes beyond what is computed, since Section 6 defers detailed spectral calculations to future work, but that is an overclaim or completeness gap, not a reduction of a result to its input.
Assumptions & free parameters
free parameters (4)
- gamma_cr (radiation density parameter) =
11.3, 16, infinity
- magnetization sigma =
10
- compression factor n'_pl/n0 =
~6
- bulk temperature kTb =
100 keV
assumptions (4)
- domain assumption Compton drag is a continuous isotropic force with Thomson scattering (Eq. 2)
- domain assumption The pair plasma is cold before reconnection (zero Compton temperature)
- domain assumption Harris equilibrium and moving-injector boundary conditions sustain a quasi-steady reconnection layer
- domain assumption The hot current-sheet particles initialized for pressure balance can be excluded from diagnostics
Cite this review
Pith. "Pith review of Kinetic Simulations of Radiative Magnetic Reconnection in the Coronae of Accreting Black Holes." pith.science (2026). https://pith.science/paper/DRTXJGMQ
@misc{pith2026190808138,
  author       = {Pith},
  title        = {Pith review of: Kinetic Simulations of Radiative Magnetic Reconnection in the Coronae of Accreting Black Holes},
  year         = {2026},
  howpublished = {\url{https://pith.science/paper/DRTXJGMQ}},
  note         = {Machine review of arXiv:1908.08138}
}
read the original abstract
We perform two- and three-dimensional particle-in-cell simulations of reconnection in magnetically-dominated pair plasmas subject to strong Compton cooling. Reconnection under such conditions operates in accretion disk coronae around black holes, which produce hard X-rays through Comptonization. Our simulations show that most of the plasma in the reconnection layer is kept cold by Compton losses and locked in magnetically-dominated plasmoids with small thermal pressure. Compton drag clears cavities inside plasmoids and affects their bulk motions. These effects, however, weakly change the reconnection rate and the plasmoid size distribution from those in non-radiative reconnection. This demonstrates that the reconnection dynamics is governed by similar magnetic stresses in both cases and weakly affected by thermal pressure. We examine the energy distribution of particles energized by radiative reconnection and observe two components. (1) A mildly-relativistic peak, which results from bulk motions of cooled plasmoids. This component receives most of the dissipated reconnection power and dominates the output X-ray emission. The peak has a quasi-Maxwellian shape with an effective temperature of 100 keV. Thus, it mimics thermal Comptonization used previously to fit hard-state spectra of accreting black holes. (2) A high-energy tail, which receives 20% of dissipated reconnection power. It is populated by particles accelerated impulsively at X-points or "picked up" by fast outflows from X-points. The high-energy particles immediately cool, and their inverse Compton emission explains the MeV spectral tail detected in the hard state of Cyg X-1. Our first-principle simulations support reconnection as a mechanism powering hard X-ray emission from accreting black holes.
Figures
Figures from the paper (11 more)




Forward citations
Cited by 2 Pith papers
-
The emergence of X-ray emission lines during relativistic radio-jet formation in the changing-look active galactic nucleus 1ES 1927+654
X-ray emission lines and a broad iron feature emerged in changing-look AGN 1ES 1927+654 concurrently with radio-jet formation and declining ionized outflows from 2022 to 2025.
-
Probing the Strong Gravity Region of Black Holes with eXTP
eXTP's large collecting area and combined spectral, timing, and polarimetric instruments are simulated to improve black hole spin and mass measurements and to tighten tests of the Kerr metric.
Reference graph
Works this paper leans on
-
[1]
2018, ApJ, 862, 80 B´ egu´ e, D., Pe’er, A., & Lyubarsky, Y
Ball, D., Sironi, L., & ¨Ozel, F. 2018, ApJ, 862, 80 B´ egu´ e, D., Pe’er, A., & Lyubarsky, Y. 2017, MNRAS, 467, 2594
work page 2018
-
[2]
Beloborodov, A. M. 2017, ApJ, 850, 141
2017
-
[3]
Belyaev, M. A. 2015, New Astronomy, 36, 37
work page 2015
-
[4]
Buneman, O. 1993, in “Computer Space Plasma Physics”, Terra Scientific, Tokyo, 67
work page 1993
-
[5]
2015, MNRAS, 448, 606
Cerutti, B., Philippov, A., Parfrey, K., & Spitkovsky, A. 2015, MNRAS, 448, 606
2015
-
[6]
Cerutti, B., Werner, G. R., Uzdensky, D. A., & Begelman, M. C. 2013, ApJ, 770, 147 —. 2014, ApJ, 782, 104
work page 2013
-
[7]
Chatterjee, K., Liska, M., Tchekhovskoy, A., & Markoff, S. B. 2019, MNRAS, 490, 2200
work page 2019
-
[8]
2006, Physics of Plasmas, 13, 072101
Daughton, W., Scudder, J., & Karimabadi, H. 2006, Physics of Plasmas, 13, 072101
work page 2006
Show all 43 references
-
[9]
2014, Physical Review Letters, 113, 155005
Guo, F., Li, H., Daughton, W., & Liu, Y.-H. 2014, Physical Review Letters, 113, 155005
2014
-
[10]
2019, The Astrophysical Journal, 879, L23
Guo, F., Li, X., Daughton, W., et al. 2019, The Astrophysical Journal, 879, L23
2019
-
[11]
2015, ApJ, 806, 167
Guo, F., Liu, Y.-H., Daughton, W., & Li, H. 2015, ApJ, 806, 167
2015
-
[12]
2019, The Astrophysical Journal, 877, 53
Hakobyan, H., Philippov, A., & Spitkovsky, A. 2019, The Astrophysical Journal, 877, 53
2019
-
[13]
2012, Physical Review Letters, 109, 265002
Huang, Y.-M., & Bhattacharjee, A. 2012, Physical Review Letters, 109, 265002
2012
-
[14]
M., & Davis, S
Jiang, Y.-F., Stone, J. M., & Davis, S. W. 2019, ApJ, 880, 67
2019
-
[15]
2013, ApJ, 774, 41
Kagan, D., Milosavljevi´ c, M., & Spitkovsky, A. 2013, ApJ, 774, 41
2013
-
[16]
2016, ApJ, 833, 155 —
Kagan, D., Nakar, E., & Piran, T. 2016, ApJ, 833, 155 —. 2018, MNRAS, 476, 3902
2016
-
[17]
2015, Space Science Reviews, 191, 545
Kagan, D., Sironi, L., Cerutti, B., & Giannios, D. 2015, Space Science Reviews, 191, 545
2015
-
[18]
F., Samtaney, R., Schekochihin, A
Loureiro, N. F., Samtaney, R., Schekochihin, A. A., & Uzdensky, D. A. 2012, Physics of Plasmas, 19, 042303
2012
-
[19]
2008, ApJ, 682, 1436
Lyubarsky, Y., & Liverts, M. 2008, ApJ, 682, 1436
2008
-
[20]
Lyubarsky, Y. E. 2005, MNRAS, 358, 113
2005
-
[21]
2003, ApJ, 589, 893
Lyutikov, M., & Uzdensky, D. 2003, ApJ, 589, 893
2003
-
[22]
L., Zdziarski, A
McConnell, M. L., Zdziarski, A. A., Bennett, K., et al. 2002, ApJ, 572, 984
2002
-
[23]
Begelman, M. C. 2015, ApJ, 815, 101
2015
-
[24]
2018, Journal of Plasma Physics, 84, 755840301
Nalewajko, K., Yuan, Y., & Chru´ sli´ nska, M. 2018, Journal of Plasma Physics, 84, 755840301
2018
-
[25]
Parfrey, K., Giannios, D., & Beloborodov, A. M. 2015, MNRAS, 446, L61
2015
-
[26]
2018, MNRAS, 481, 5687
Petropoulou, M., & Sironi, L. 2018, MNRAS, 481, 5687
2018
-
[27]
2019, ApJ, 880, 37
Petropoulou, M., Sironi, L., Spitkovsky, A., & Giannios, D. 2019, ApJ, 880, 37
2019
-
[28]
E., Sironi, L., & Narayan, R
Rowan, M. E., Sironi, L., & Narayan, R. 2017, ApJ, 850, 29 —. 2019, ApJ, 873, 2
2017
-
[29]
2016, MNRAS, 462, 48
Sironi, L., Giannios, D., & Petropoulou, M. 2016, MNRAS, 462, 48
2016
-
[30]
2015, MNRAS, 450, 183
Sironi, L., Petropoulou, M., & Giannios, D. 2015, MNRAS, 450, 183
2015
-
[31]
2009, ApJ, 698, 1523 —
Sironi, L., & Spitkovsky, A. 2009, ApJ, 698, 1523 —. 2011, ApJ, 726, 75 —. 2014, ApJ, 783, L21
2009
-
[32]
2013, ApJ, 771, 54
Sironi, L., Spitkovsky, A., & Arons, J. 2013, ApJ, 771, 54
2013
-
[33]
2005, in AIP Conf
Spitkovsky, A. 2005, in AIP Conf. Ser., Vol. 801, Astrophysical Sources of High Energy Particles and Radiation, ed. T. Bulik, B. Rudak, & G. Madejski, 345
2005
-
[34]
A., Loureiro, N
Uzdensky, D. A., Loureiro, N. F., & Schekochihin, A. A. 2010, Physical Review Letters, 105, 235002
2010
-
[35]
A., & McKinney, J
Uzdensky, D. A., & McKinney, J. C. 2011, Physics of Plasmas, 18, 042105 18
2011
-
[36]
A., & Spitkovsky, A
Uzdensky, D. A., & Spitkovsky, A. 2014, ApJ, 780, 3
2014
-
[37]
R., Philippov, A
Werner, G. R., Philippov, A. A., & Uzdensky, D. A. 2019, MNRAS, 482, L60
2019
-
[38]
R., & Uzdensky, D
Werner, G. R., & Uzdensky, D. A. 2017, ApJ, 843, L27
2017
-
[39]
2018, MNRAS, 473, 4840
Nalewajko, K. 2018, MNRAS, 473, 4840
2018
-
[40]
Begelman, M. C. 2016, ApJ, 816, L8
2016
-
[41]
A., & Gierli´ nski, M
Zdziarski, A. A., & Gierli´ nski, M. 2004, Progress of Theoretical Physics Supplement, 155, 99
2004
-
[42]
2001, ApJ, 562, L63 —
Zenitani, S., & Hoshino, M. 2001, ApJ, 562, L63 —. 2007, ApJ, 670, 702
2001
-
[43]
A., Werner, G
Zhdankin, V., Uzdensky, D. A., Werner, G. R., & Begelman, M. C. 2018, MNRAS, 474, 2514
2018
Reviewed August 14, 2026 · model on record in the stance chip above.
Discussion (0). Continue with ORCID to comment.