The emergence of X-ray emission lines during relativistic radio-jet formation in the changing-look active galactic nucleus 1ES 1927+654
pith:7CZ7CFHLreviewed 2026-07-07 21:47 UTCmodel glm-5.2open to challenge →
The pith
X-ray lines emerge as a radio jet forms in a changing-look galaxy
A machine-rendered reading of the paper's core claim, the machinery that carries it, and where it could break.
Core claim
The central finding is a temporal coincidence: X-ray emission lines appear, ionized absorbers weaken, and a radio jet forms, all within the same three-year window in a single object. The authors argue this coincidence reflects a physical transition from a wind-dominated to a jet-dominated outflow state. The broad Fe K feature (sigma approximately 800 eV, centroid near 6.7–7.0 keV when fit with the preferred width) is the first detection of its kind in this source and, combined with the soft lines, points to reprocessing of X-rays in the inner accretion disk during jet formation. The soft X-ray and 5 GHz radio fluxes have both risen dramatically (by factors of roughly 10 and 60 respectively),
What carries the argument
The key objects are (1) warm absorbers — ionized gas along the line of sight that imprints blue-shifted absorption features in soft X-rays, modeled with the warmabs photoionization code; (2) Gaussian emission lines at approximately 0.56 keV (attributed to O VII transitions), approximately 1 keV (broad, possibly from inner-disk reflection), and 6–7 keV (broad Fe K, suggestive of Fe XXV/XXVI); (3) the changing-look AGN 1ES 1927+654 itself, which has undergone a corona destruction/rebuilding event and now hosts a nascent radio jet; and (4) the anti-correlation between warm absorber column density and jet activity, which the authors use to argue for a mode transition in the outflow.
If this is right
- If the wind-to-jet transition interpretation is correct, changing-look AGN that form jets should systematically show declining ionized absorbers, providing a observable diagnostic for accretion-mode transitions in individual objects.
- The broad Fe K line, if confirmed with higher-resolution spectroscopy, would place reflecting material at the innermost disk, constraining the inner radius and ionization state of the accretion flow during jet launch.
- The simultaneous plateauing of soft X-ray and radio flux suggests a coupling between the jet base and the soft X-ray emitting region, which could be tested with coordinated X-ray/radio timing campaigns.
- The persistent X-ray QPO in this source, now plateaued near 2.5 mHz alongside the flux plateaus, may indicate a stable geometric configuration of the inner disk, corona, and jet that can be modeled as a single dynamical system.
Load-bearing premise
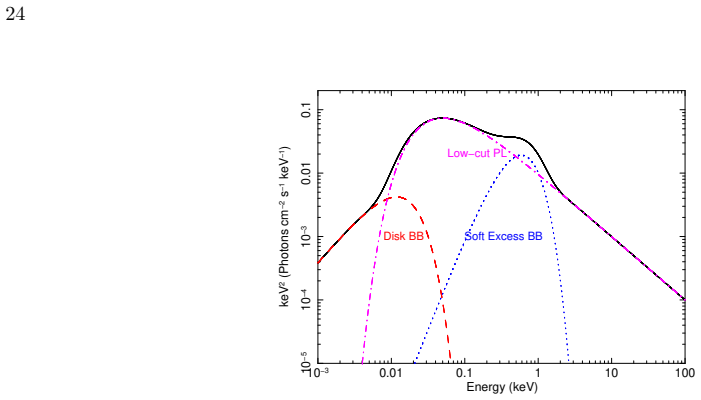
The claim that the soft X-ray residuals are better described by emission lines than by warm absorbers rests on a model comparison where two Gaussians yield a larger fit improvement than a warm absorber component. The broad Fe K line width is frozen at 0.8 keV because it cannot be constrained simultaneously with the line energy, and the line centroid shifts depending on the chosen width. The physical interpretation as disk reflection depends on this frozen parameter, and the信号
What would settle it
If higher signal-to-noise observations (e.g., with XRISM or NuSTAR) fail to confirm the broad Fe K feature as a genuine reflection component — for instance, if the residual at 6–7 keV dissolves into continuum shape changes or instrumental artifacts — the disk-reflection interpretation would be undermined. Similarly, if future monitoring shows warm absorbers returning to their 2022 strength without the jet disappearing, the wind-to-jet mode transition picture would be weakened.
Figures















read the original abstract
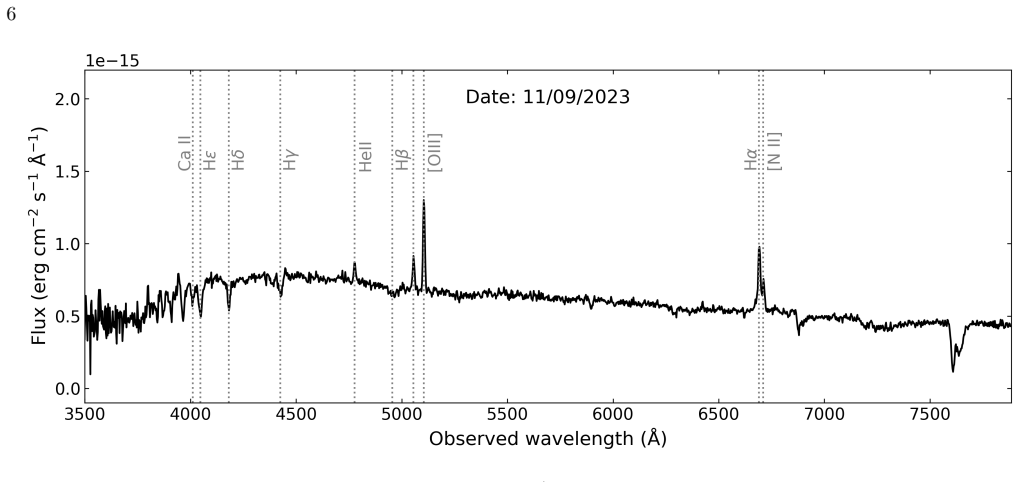
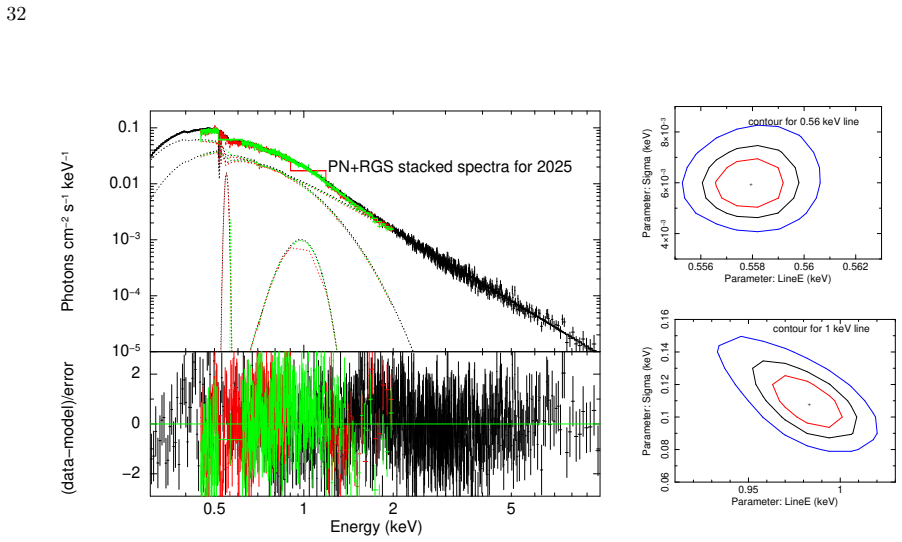
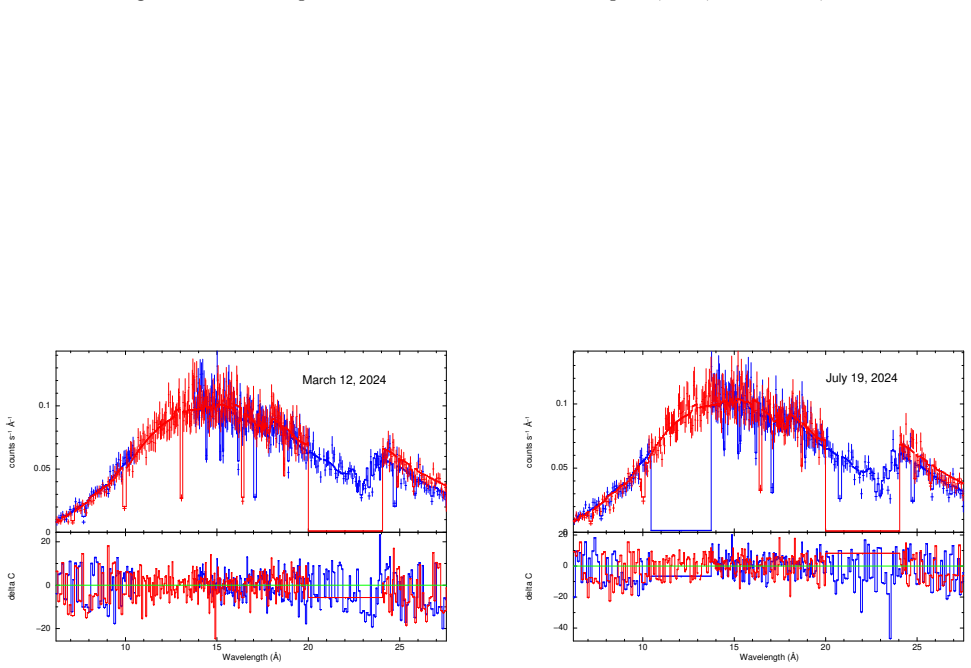
We present results from a comprehensive multi-wavelength monitoring campaign of the changing-look active galactic nucleus 1ES 1927+654 during the onset and evolution of a radio jet (May 2022-August 2025). Using observations from XMM-Newton, Swift, TNG, ZTF, VLA, and VLBA, we characterize the spectral evolution of the source. Soft X-ray emission lines at ~0.56 keV and ~1 keV have appeared with variable strength and width during the formation of a nascent jet, with the ~1 keV feature persisting since the post-2017 flare phase. We also report the detection of a broad (~800 eV) Fe K emission feature at ~(6-7) keV in ~70 ks of stacked EPIC-pn spectra, marking the first such detection in this historically featureless source. Joint spectral fitting of XMM-Newton EPIC-pn and RGS data reveals the presence of ionized absorbers in 2022, followed by weaker absorption from 2023 to 2025. The emergence of emission features concurrent with the decline of ionized absorption suggests a transition in the inner accretion and outflow processes, indicating the reflection and reprocessing of X-rays from the inner accretion disk during jet formation. The apparent weakening of ionized outflows as the jet develops supports a scenario in which accreting material is preferentially channeled into the jet rather than expelled as winds. Furthermore, both the 0.3-2 keV soft X-ray and 5 GHz radio fluxes, which have increased by factors of ~10 and ~60, respectively, since 2022, have recently plateaued at elevated levels. Combined with steady optical emission, this indicates a stabilized accretion disk, corona, and jet configuration. Finally, the absence of broad optical emission lines suggests that the broad-line region is either not along our line of sight or insufficiently illuminated by the central source.
Editorial analysis
A structured set of objections, weighed in public.
Referee Report
Summary. This paper presents a multi-wavelength study of the changing-look AGN 1ES 1927+654 during 2022–2025, focusing on X-ray spectral evolution using XMM-Newton RGS and EPIC-pn data alongside Swift, ZTF, TNG, VLA, and VLBA monitoring. The authors report: (1) emergence of soft X-ray emission lines at ~0.56 keV and ~1 keV, (2) detection of a broad (σ≈800 eV) Fe K emission feature at ~6–7 keV in yearly stacked EPIC-pn spectra, (3) presence of ionized warm absorbers in 2022 that weaken in 2023–2025, and (4) co-evolution of soft X-ray and radio fluxes. The paper interprets these findings in the context of a transition from wind-dominated to jet-dominated outflow during radio-jet formation.
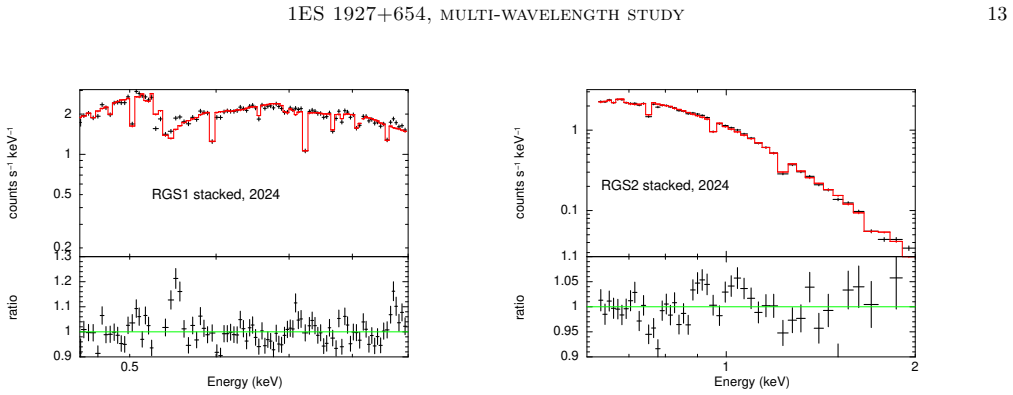
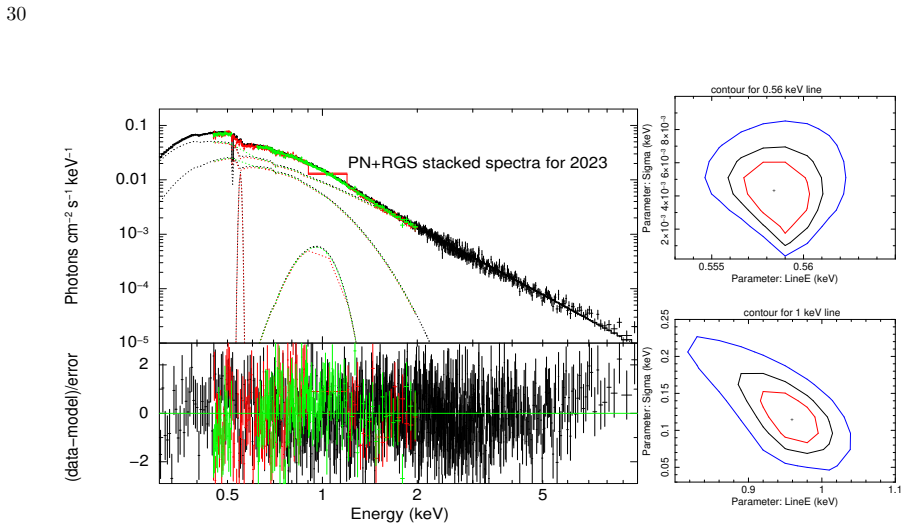
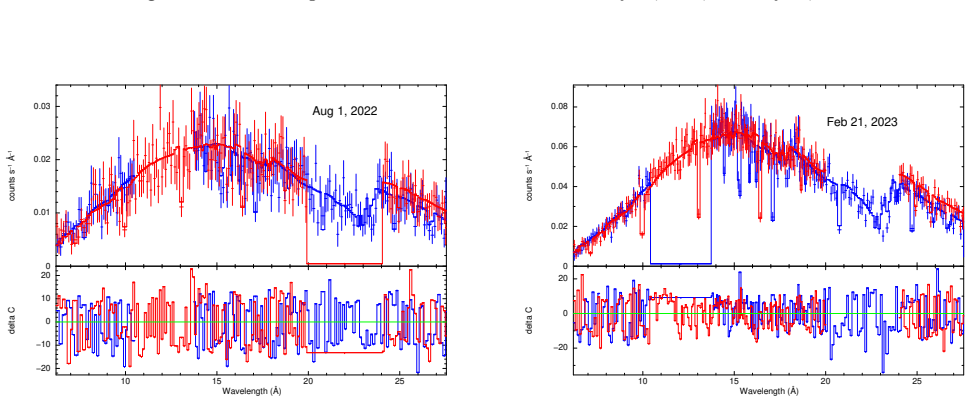
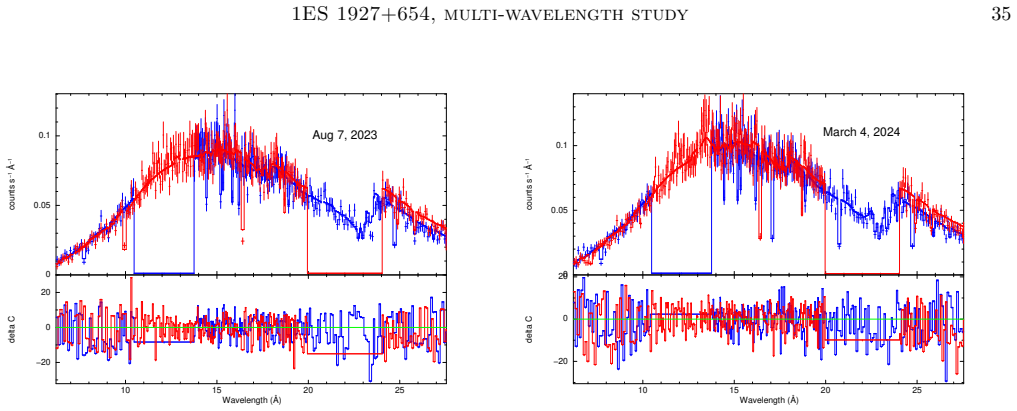
Significance. The paper provides a valuable, high-cadence multi-wavelength dataset during a unique evolutionary phase of a well-studied changing-look AGN. The soft X-ray emission line detections at ~0.56 keV and ~1 keV are reasonably robust, being detected in individual observations with significant ΔC improvements (Tables 6–8) and confirmed in stacked spectra with contour analysis (Figures 12–15). The warm absorber evolution from 2022 to 2025 is also well-motivated, with confidence contours shown (Figure 4) and a simulation validating RGS sensitivity (Figure 11). The simultaneous RGS+PN fitting approach and Monte Carlo significance testing for the Fe K line are methodologically appropriate in principle. The multi-wavelength light curves and optical spectroscopy provide useful context. However, the significance of the Fe K detection — which is central to the reflection interpretation — is less secure than presented, as detailed below.
major comments (4)
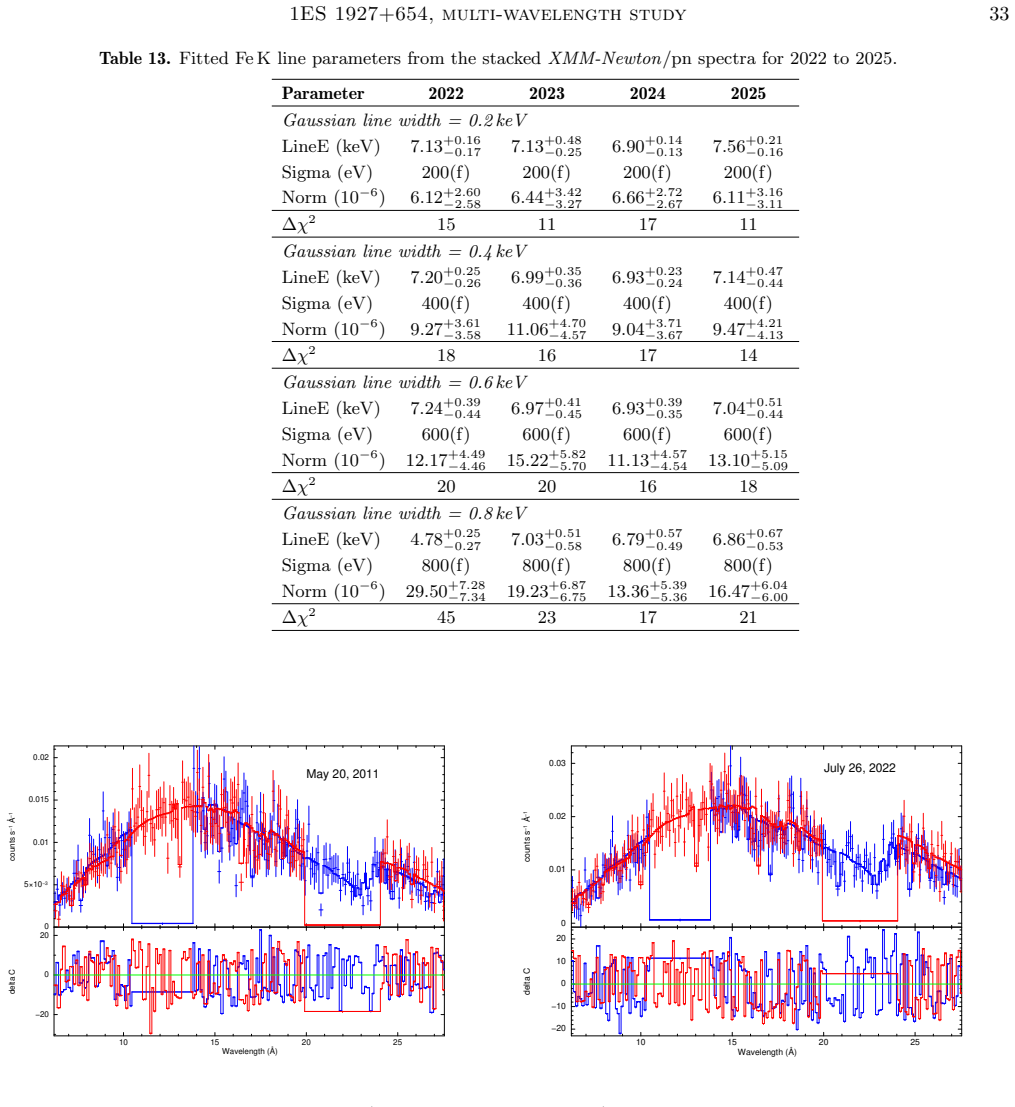
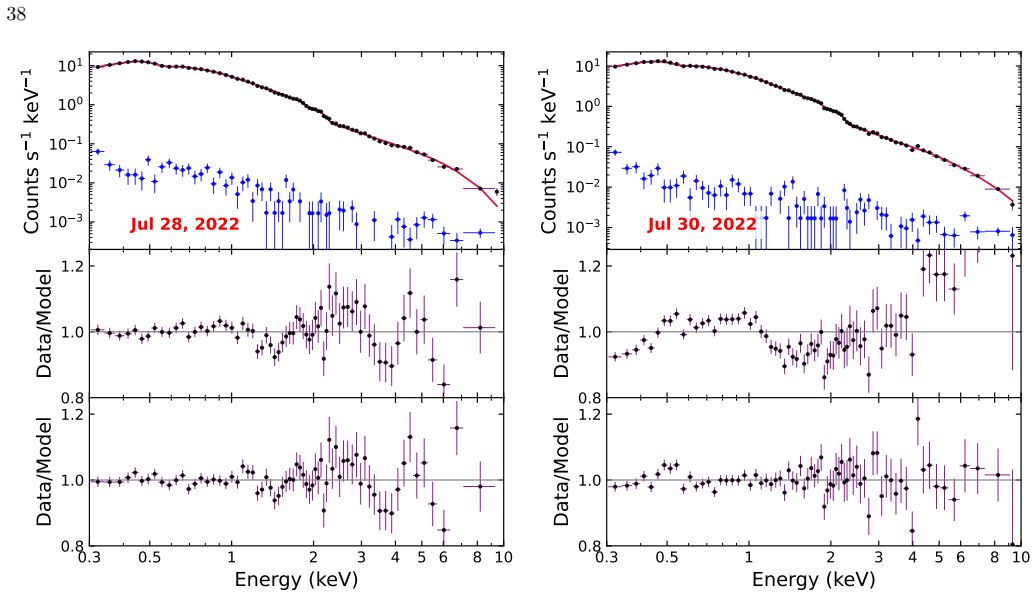
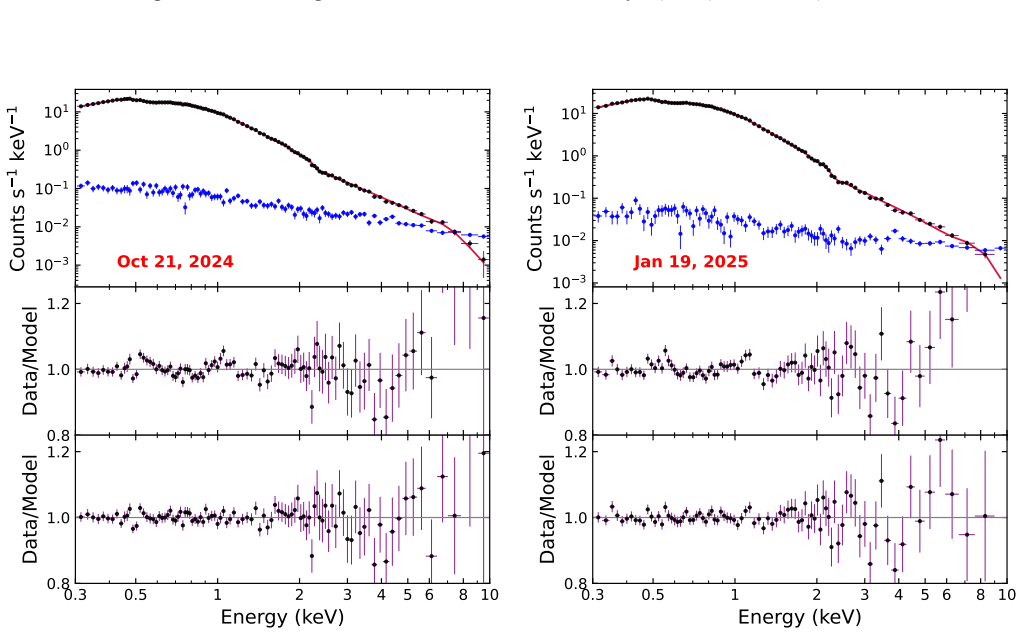
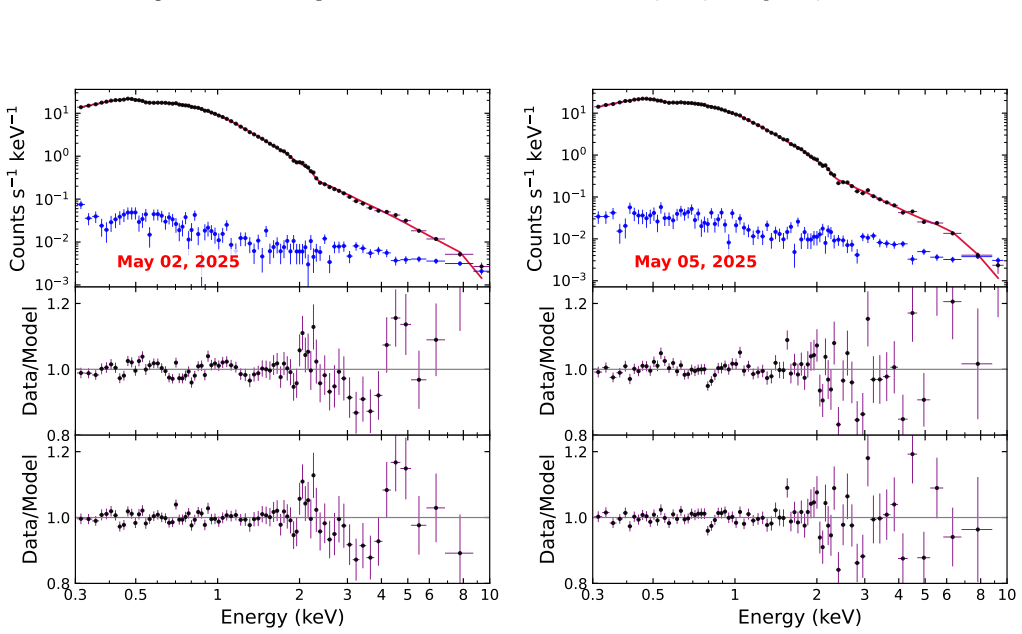
- §3.3.5, Table 13: When σ is frozen at 0.8 keV, the 2022 stacked spectrum yields a line centroid at E=4.78 keV, which is unphysical for any Fe K transition. This is not discussed in the text. While the authors note the 2022 Fe K detection is marginal (ΔC~5/2), the fact that a broad Gaussian can settle at 4.78 keV demonstrates that σ=0.8 keV is broad enough to absorb continuum curvature rather than trace a real emission line. This directly undermines confidence that the 2023–2025 centroids (6.79–7.03 keV) represent genuine Fe K emission rather than continuum-modeling artifacts. The authors should explicitly address the 4.78 keV result and discuss the continuum-degeneracy risk, particularly given that background dominates at ≥6.5 keV (acknowledged in §3.3.5).
- §3.3.6: The Monte Carlo significance test uses σ≈1.5 keV (stated in the text), which is even broader than the 0.8 keV used in the main analysis (Table 9). A broader Gaussian has even greater freedom to absorb continuum curvature, so the >99.9% significance result validates the detection against statistical fluctuations of the null model but does not address systematic continuum mis-modeling. The test should be repeated with narrower widths (e.g., σ=0.2 keV, consistent with typical AGN Fe K lines) to demonstrate that the detection is not an artifact of the broad Gaussian absorbing residual continuum structure. Alternatively, the authors should test whether alternative continuum parameterizations (e.g., a cutoff powerlaw or a more complex soft-excess model) reduce or eliminate the Fe K residual.
- Figure 6: An unmodeled positive residual at ~4–5 keV is visible in the best-fit panels for 2023, 2024, and 2025. The authors acknowledge this in the figure caption ('We note that there is a significant positive residual at ~(4−5) keV') but do not model it or discuss its impact on the Fe K line fit. A broad Gaussian centered at ~7 keV with σ=0.8 keV extends to ~5 keV, so this residual could be partially absorbed by the Fe K Gaussian, inflating its apparent significance. The authors should either model this feature or demonstrate that it does not affect the Fe K line parameters.
- Tables 6–8: The Fe K line is undetected in any individual observation (ΔC≤9 in all cases, often ΔC≤5). The detection relies entirely on stacked spectra with ~40–90 ks exposures. Given the frozen line width, the background dominance at ≥6.5 keV, and the lack of individual-epoch detections, the claim in the abstract of 'the first such detection in this historically featureless source' should be substantially qualified. The conclusion (item 2) presents this as a robust result; it should be reframed as a tentative detection pending confirmation with higher-SNR data (e.g., NuSTAR, as the authors themselves note in §4.1.1).
minor comments (7)
- §3.3.1: The statement that emission lines are 'statistically better described' than warm absorbers (ΔC~99 for 6 parameters vs. ΔC~33 for 3 parameters) would benefit from an F-test or AIC/BIC comparison rather than raw ΔC comparison, since the models have different numbers of free parameters.
- Table 5 caption: The note says z values are 'shown as positive magnitudes for convenience' but the column header just says 'z'. This could confuse readers into thinking the absorber is redshifted. Consider labeling the column '|z|' or 'blueshift |z|'.
- §3.3.3: Line widths for the ~0.56 keV and ~1 keV Gaussians are frozen at best-fit values during error estimation (noted in Tables 6–8), but the specific values vary significantly between epochs (e.g., σ ranges from 3.1 to 60 eV for the 0.56 keV line). The rationale for these specific frozen values should be more transparent.
- Figure 6: The y-axis label 'Data/Model' in the residual panels would be clearer if the energy range were extended to show the full 0.3–10 keV range consistently across all four panels.
- §4.1.1: The reflection interpretation is discussed qualitatively but the authors acknowledge that self-consistent reflection models (relxill) cannot be applied. Given this, the phrase 'indicating the reflection and reprocessing of X-rays from the inner accretion disk' in the abstract is stronger than the data support. Consider softening to 'consistent with' or 'suggestive of' reflection.
- Table 9: The Fe K line width is listed as 400 eV for 2022 but 800 eV for 2023–2025. The text (§3.3.5) explains that σ=0.8 keV gives the best statistics for 2023–2025, but the 2022 entry at 400 eV appears inconsistent with this narrative. Clarify why 2022 uses a different frozen width.
- The paper cites Laha et al. (2022, 2025) extensively; ensure that results from these earlier works are clearly distinguished from new results presented here for the first time.
Simulated Author's Rebuttal
We thank the referee for a careful and constructive report. The referee's concerns center on the robustness of the Fe K detection, and we find the comments on the 4.78 keV centroid, the broad Monte Carlo width, the unmodeled 4-5 keV residual, and the language used in the abstract and conclusions to be well-taken. We will implement revisions addressing all four major comments, including new tests with narrower Gaussian widths and alternative continuum parameterizations, explicit discussion of the 4.78 keV result and continuum degeneracy, modeling or justification of the 4-5 keV residual, and qualification of the Fe K detection as tentative throughout the manuscript.
read point-by-point responses
-
Referee: §3.3.5, Table 13: When σ is frozen at 0.8 keV, the 2022 stacked spectrum yields a line centroid at E=4.78 keV, which is unphysical for any Fe K transition. This is not discussed in the text. The fact that a broad Gaussian can settle at 4.78 keV demonstrates that σ=0.8 keV is broad enough to absorb continuum curvature rather than trace a real emission line. The authors should explicitly address the 4.78 keV result and discuss the continuum-degeneracy risk.
Authors: The referee is correct that the 4.78 keV centroid in the 2022 stacked spectrum with σ=0.8 keV is unphysical for Fe K emission and that this result was not discussed in the text. This is a fair and important point. We will add an explicit discussion of this result in §3.3.5, noting that the 2022 detection is marginal (ΔC~5/2) and that the unphysical centroid demonstrates the broad Gaussian is absorbing continuum curvature rather than tracing a genuine line in that epoch. We agree this illustrates the continuum-degeneracy risk when using σ=0.8 keV. We will also note that the 2022 result is consistent with our existing statement that the Fe K line is only marginally detected in 2022, and that the 2023–2025 centroids (6.79–7.03 keV) at σ=0.8 keV are more physically plausible but must be interpreted with caution given this degeneracy. Importantly, Table 13 also shows that at narrower widths (σ=0.2 keV), the 2023–2025 centroids remain at 6.90–7.56 keV, which are physically reasonable for Fe K, while the 2022 centroid at σ=0.2 keV is 7.13 keV — also within the Fe K range but with only Δχ²=15. We will present this comparison explicitly to show that the physical centroids are not solely a product of the broad Gaussian. revision: yes
-
Referee: §3.3.6: The Monte Carlo significance test uses σ≈1.5 keV, which is even broader than the 0.8 keV used in the main analysis. A broader Gaussian has even greater freedom to absorb continuum curvature, so the >99.9% significance result validates the detection against statistical fluctuations but does not address systematic continuum mis-modeling. The test should be repeated with narrower widths (e.g., σ=0.2 keV) or alternative continuum parameterizations should be tested.
Authors: We agree entirely. The Monte Carlo test as currently presented validates the detection against statistical fluctuations of the null model but does not address systematic continuum mis-modeling, and the use of σ≈1.5 keV exacerbates this concern. We will repeat the Monte Carlo simulation with σ=0.2 keV, consistent with typical AGN Fe K line widths and with the narrow-width fits already presented in Table 13. We will also test alternative continuum parameterizations — specifically a cutoff power-law and a more complex soft-excess model (e.g., double blackbody or diskbb) — to determine whether these reduce or eliminate the Fe K residual. These additional tests will be reported in the revised §3.3.6. If the narrower-width Monte Carlo test yields a lower significance or the alternative continua reduce the residual, we will report this transparently and adjust the claimed significance accordingly. revision: yes
-
Referee: Figure 6: An unmodeled positive residual at ~4–5 keV is visible in the best-fit panels for 2023, 2024, and 2025. A broad Gaussian centered at ~7 keV with σ=0.8 keV extends to ~5 keV, so this residual could be partially absorbed by the Fe K Gaussian, inflating its apparent significance. The authors should either model this feature or demonstrate that it does not affect the Fe K line parameters.
Authors: This is a valid concern. We acknowledge in the figure caption that the 4–5 keV residual exists but did not model it or assess its impact on the Fe K fit. We will address this in the revision by adding a Gaussian component for the 4–5 keV feature and refitting the stacked spectra, reporting the effect on the Fe K line parameters (centroid, normalization, ΔC). If the 4–5 keV feature and the Fe K Gaussian are degenerate — i.e., modeling the 4–5 keV residual reduces the Fe K significance — we will report this explicitly. We will also show the Fe K parameters with and without the 4–5 keV component modeled, so the reader can assess the impact directly. This test will be added to §3.3.5 or a new subsection. revision: yes
-
Referee: Tables 6–8: The Fe K line is undetected in any individual observation (ΔC≤9 in all cases, often ΔC≤5). The detection relies entirely on stacked spectra. Given the frozen line width, the background dominance at ≥6.5 keV, and the lack of individual-epoch detections, the claim in the abstract of 'the first such detection in this historically featureless source' should be substantially qualified. The conclusion (item 2) presents this as a robust result; it should be reframed as a tentative detection pending confirmation with higher-SNR data.
Authors: We agree that the Fe K detection should be presented more cautiously given that it relies on stacked spectra, uses a frozen line width, occurs in a background-dominated regime, and is not detected in individual observations. We will revise the abstract to replace 'the first such detection in this historically featureless source' with language such as 'a tentative detection of a broad Fe K emission feature in stacked EPIC-pn spectra, the first such feature reported in this historically featureless source, pending confirmation with higher-SNR data.' We will also revise conclusion item 2 to explicitly state the tentative nature of the detection, the reliance on stacking, the background dominance at ≥6.5 keV, and the need for confirmation with NuSTAR. We already note in §4.1.1 that the current SNR precludes robust constraints with self-consistent reflection models and that higher-sensitivity observations are required; we will strengthen this statement and ensure consistency between the abstract, conclusions, and discussion. revision: yes
Circularity Check
No significant circularity; observational paper with minor self-citation for context and SED construction
full rationale
This is an observational X-ray spectral analysis paper, not a derivational one. The central claims—detection of soft X-ray emission lines, a broad Fe K feature, and evolving warm absorbers—are obtained by fitting spectral models (Gaussians, WARMABS) directly to XMM-Newton data and reporting fit statistics (ΔC, Monte Carlo simulations). No prediction is claimed from a fitted parameter. The self-citations (Laha et al. 2022, 2025; Meyer et al. 2025; Ghosh et al. 2023) are used for light curves, radio monitoring context, and SED construction for the WARMABS ionization table. The SED self-citation is standard practice: the observed continuum parameters feed the ionization balance calculation, but the absorption parameters (NH, log ξ, blueshift z) are then fit to the data independently. The WARMABS model is also validated against an external result (Ricci et al. 2021, June 2018 observation). The frozen Fe K line width (σ=0.8 keV) and the resulting centroid shifts (including the unphysical 4.78 keV for 2022 in Table 13) are acknowledged limitations of the phenomenological modeling, not circular constructions—the paper explicitly states 'the centroid of the line is dependent on the line width we choose during the fitting' and 'the current SNR and spectral resolution preclude robust constraints using self-consistent reflection models.' The Monte Carlo significance test (Section 3.3.6) tests against statistical fluctuations of the null model, which is standard. No step in the analysis chain reduces to its own inputs by construction.
Axiom & Free-Parameter Ledger
free parameters (9)
- ztbabs N_H (host galaxy) =
(1.26-5.23)×10^20 cm^-2
- bbody kT =
0.13-0.16 keV
- powerlaw Gamma =
2.39-3.24
- WA N_H =
(0.3-3.0)×10^20 cm^-2
- WA log(xi) =
1.13-2.33
- WA z (blueshift) =
0.006-0.051
- Gaussian line energies (0.45-0.56, ~1.0, 6-7.5 keV) =
varies
- Gaussian line widths (sigma) =
3-120 eV (soft), 800 eV (Fe K)
- Fe K line width (frozen) =
0.8 keV
axioms (5)
- domain assumption The XSTAR/WARMABS photoionization model with the source SED accurately predicts ionic column densities for the warm absorber.
- domain assumption Gaussian profiles adequately model the emission features for detection purposes.
- domain assumption Stacking spectra within a year does not introduce spurious features.
- domain assumption The turbulent velocity of the warm absorber is 1000 km/s.
- domain assumption The host galaxy absorption (ztbabs) and warm absorber are statistically distinct components.
Reference graph
Works this paper leans on
-
[1]
What really makes an accretion disc MAD
What really makes an accretion disc MAD. , keywords =. doi:10.1093/mnras/stab3790 , archivePrefix =. 2111.02439 , primaryClass =
work page internal anchor Pith review Pith/arXiv arXiv doi:10.1093/mnras/stab3790
-
[2]
Fermi Large Area Telescope Fourth Source Catalog
Fermi Large Area Telescope Fourth Source Catalog. , keywords =. doi:10.3847/1538-4365/ab6bcb , archivePrefix =. 1902.10045 , primaryClass =
work page internal anchor Pith review Pith/arXiv arXiv doi:10.3847/1538-4365/ab6bcb 1902
-
[3]
Observational Limits on Type 1 AGN Accretion Rate in COSMOS
Observational Limits on Type 1 Active Galactic Nucleus Accretion Rate in COSMOS. , keywords =. doi:10.1088/0004-637X/700/1/49 , archivePrefix =. 0905.1123 , primaryClass =
work page internal anchor Pith review Pith/arXiv arXiv doi:10.1088/0004-637x/700/1/49
-
[4]
Testing the Unification Model for Active Galactic Nuclei in the Infrared: Are the Obscuring Tori of Type 1 and 2 Seyferts Different?. , keywords =. doi:10.1088/0004-637X/731/2/92 , archivePrefix =. 1101.3335 , primaryClass =
work page internal anchor Pith review Pith/arXiv arXiv doi:10.1088/0004-637x/731/2/92
-
[5]
Simultaneous X-ray and optical observations of true type 2 Seyfert galaxies. , keywords =. doi:10.1111/j.1365-2966.2012.21959.x , archivePrefix =. 1209.0274 , primaryClass =
-
[6]
Black Holes (Les Astres Occlus) , year = 1973, month = jan, pages =
Astrophysics of black holes. Black Holes (Les Astres Occlus) , year = 1973, month = jan, pages =
work page 1973
-
[7]
Black holes in binary systems. Observational appearance. , year = 1973, month = jan, volume =
work page 1973
-
[8]
Sub-Milliarcsecond Imaging of Quasars and Active Galactic Nuclei. IV. Fine-Scale Structure. , keywords =. doi:10.1086/497430 , archivePrefix =. astro-ph/0505536 , primaryClass =
work page internal anchor Pith review Pith/arXiv arXiv doi:10.1086/497430
-
[9]
The Astronomer's Telegram , keywords =
EVN observation reveals a radio flare in the changing-look AGN 1ES 1927+654. The Astronomer's Telegram , keywords =
work page 1927
-
[10]
Radio activity of supermassive black holes with extremely high accretion rates
Radio Activity of Supermassive Black Holes with Extremely High Accretion Rates. , keywords =. doi:10.3847/1538-4357/abb775 , archivePrefix =. 2007.11327 , primaryClass =
work page internal anchor Pith review Pith/arXiv arXiv doi:10.3847/1538-4357/abb775 2007
-
[11]
Detection of a parsec-scale jet in a radio-quiet narrow-line Seyfert 1 galaxy with highly accreting supermassive black hole. , keywords =. doi:10.1093/mnras/stab2651 , archivePrefix =. 2111.12980 , primaryClass =
work page internal anchor Pith review Pith/arXiv arXiv doi:10.1093/mnras/stab2651
-
[12]
The Origin of Radio Emission from Radio-Quiet AGN
The origin of radio emission from radio-quiet active galactic nuclei. Nature Astronomy , keywords =. doi:10.1038/s41550-019-0765-4 , archivePrefix =. 1902.05917 , primaryClass =
work page internal anchor Pith review Pith/arXiv arXiv doi:10.1038/s41550-019-0765-4 1902
-
[13]
Quasar feedback and the origin of radio emission in radio-quiet quasars
Quasar feedback and the origin of radio emission in radio-quiet quasars. , keywords =. doi:10.1093/mnras/stu842 , archivePrefix =. 1402.6736 , primaryClass =
work page internal anchor Pith review Pith/arXiv arXiv doi:10.1093/mnras/stu842
-
[14]
Unabsorbed Seyfert 2 galaxies. , keywords =. doi:10.1051/0004-6361:20021161 , archivePrefix =. astro-ph/0208496 , primaryClass =
work page internal anchor Pith review Pith/arXiv arXiv doi:10.1051/0004-6361:20021161
-
[15]
Correcting for the Effects of Interstellar Extinction
Correcting for the Effects of Interstellar Extinction. , keywords =. doi:10.1086/316293 , archivePrefix =. astro-ph/9809387 , primaryClass =
work page internal anchor Pith review Pith/arXiv arXiv doi:10.1086/316293
-
[16]
Parametric Recovery of Line-of-Sight Velocity Distributions from Absorption-Line Spectra of Galaxies via Penalized Likelihood. , keywords =. 2004. doi:10.1086/381875 , archivePrefix =. astro-ph/0312201 , primaryClass =
work page internal anchor Pith review Pith/arXiv arXiv doi:10.1086/381875 2004
-
[18]
2011, MNRAS, 412, 979, doi: 10.1111/j.1365-2966.2010.17959.x
Evolutionary stellar population synthesis with MILES - I. The base models and a new line index system. , keywords =. 2010. doi:10.1111/j.1365-2966.2010.16407.x , archivePrefix =. 1004.4439 , primaryClass =
-
[20]
Radio Variability of Radio Quiet and Radio Loud Quasars
Radio Variability of Radio-quiet and Radio-loud Quasars. , keywords =. doi:10.1086/425859 , archivePrefix =. astro-ph/0409554 , primaryClass =
work page internal anchor Pith review Pith/arXiv arXiv doi:10.1086/425859
-
[21]
The Einstein Slew Survey Sample of BL Lacertae Objects. , keywords =. doi:10.1086/192300 , adsurl =
-
[22]
Astronomical Data Analysis Software and Systems XVI , year = 2007, editor =
CASA Architecture and Applications. Astronomical Data Analysis Software and Systems XVI , year = 2007, editor =
work page 2007
-
[23]
Active galactic nuclei flicker: an observational estimate of the duration of black hole growth phases of 10 ^ 5 yr. , keywords =. doi:10.1093/mnras/stv1136 , archivePrefix =. 1505.06733 , primaryClass =
work page internal anchor Pith review Pith/arXiv arXiv doi:10.1093/mnras/stv1136
-
[24]
Local supermassive black holes, relics of active galactic nuclei and the X-ray background. , keywords =. doi:10.1111/j.1365-2966.2004.07765.x , archivePrefix =. astro-ph/0311619 , primaryClass =
-
[25]
A parsec-scale faint jet in the nearby changing-look Seyfert galaxy Mrk 590. , keywords =. doi:10.1093/mnrasl/slab005 , archivePrefix =. 2101.04629 , primaryClass =
-
[26]
rPICARD: A CASA-based calibration pipeline for VLBI data. Calibration and imaging of 7 mm VLBA observations of the AGN jet in M 87. , keywords =. doi:10.1051/0004-6361/201935181 , archivePrefix =. 1902.01749 , primaryClass =
work page internal anchor Pith review Pith/arXiv arXiv doi:10.1051/0004-6361/201935181 1902
-
[27]
Bulletin of the American Astronomical Society , year = 1994, volume =
DIFMAP: an interactive program for synthesis imaging. Bulletin of the American Astronomical Society , year = 1994, volume =
work page 1994
-
[28]
Interferometric Imaging Directly with Closure Phases and Closure Amplitudes
Interferometric Imaging Directly with Closure Phases and Closure Amplitudes. , keywords =. doi:10.3847/1538-4357/aab6a8 , archivePrefix =. 1803.07088 , primaryClass =
work page internal anchor Pith review Pith/arXiv arXiv doi:10.3847/1538-4357/aab6a8
-
[29]
American Astronomical Society Meeting Abstracts , year = 1995, series =
High Fidelity Interferometric Imaging: Robust Weighting and NNLS Deconvolution. American Astronomical Society Meeting Abstracts , year = 1995, series =
work page 1995
-
[30]
Tracking the year-to-year variation in the spectral energy distribution of the narrow-line Seyfert 1 galaxy Mrk 335. , keywords =. doi:10.1093/mnras/staa2817 , archivePrefix =. 2009.05705 , primaryClass =
work page internal anchor Pith review Pith/arXiv arXiv doi:10.1093/mnras/staa2817 2009
-
[31]
Driving extreme variability: The evolving corona and evidence for jet launching in Markarian 335
Driving extreme variability: the evolving corona and evidence for jet launching in Markarian 335. , keywords =. doi:10.1093/mnras/stv162 , archivePrefix =. 1501.05302 , primaryClass =
work page internal anchor Pith review Pith/arXiv arXiv doi:10.1093/mnras/stv162
-
[32]
Flaring from the supermassive black hole in Mrk 335 studied with Swift and NuSTAR
Flaring from the supermassive black hole in Mrk 335 studied with Swift and NuSTAR. , keywords =. doi:10.1093/mnras/stv2130 , archivePrefix =. 1510.07656 , primaryClass =
work page internal anchor Pith review Pith/arXiv arXiv doi:10.1093/mnras/stv2130
-
[33]
Evidence for an emerging disc wind and collimated outflow during an X-ray flare in the narrow-line Seyfert 1 galaxy Mrk 335. , keywords =. doi:10.1093/mnras/stz274 , archivePrefix =. 1901.07899 , primaryClass =
work page internal anchor Pith review Pith/arXiv arXiv doi:10.1093/mnras/stz274 1901
-
[34]
Eleven years of monitoring the Seyfert 1 Mrk 335 with Swift: Characterizing the X-ray and UV/optical variability. , keywords =. doi:10.1093/mnras/sty1134 , archivePrefix =. 1805.00300 , primaryClass =
work page internal anchor Pith review Pith/arXiv arXiv doi:10.1093/mnras/sty1134
-
[35]
1ES 1927+654: a bare Seyfert 2
1ES 1927+654: a bare Seyfert 2. , keywords =. doi:10.1093/mnras/stt735 , archivePrefix =. 1304.7155 , primaryClass =
work page internal anchor Pith review Pith/arXiv arXiv doi:10.1093/mnras/stt735 1927
-
[36]
1ES 1927+654: Persistent and rapid X-ray variability in an AGN with low intrinsic neutral X-ray absorption and narrow optical emission lines. , keywords =. doi:10.1051/0004-6361:20021520 , archivePrefix =. astro-ph/0210369 , primaryClass =
work page internal anchor Pith review Pith/arXiv arXiv doi:10.1051/0004-6361:20021520 1927
-
[37]
Spectral Classification of Emission-Line Galaxies. , keywords =. doi:10.1086/191166 , adsurl =
-
[38]
Astrophysics of gaseous nebulae and active galactic nuclei
-
[39]
Indecent Exposure in Seyfert 2 Galaxies: A Close Look
Indecent Exposure in Seyfert 2 Galaxies: A Close Look. , keywords =. doi:10.1088/2041-8205/726/2/L21 , archivePrefix =. 1012.1865 , primaryClass =
work page internal anchor Pith review Pith/arXiv arXiv doi:10.1088/2041-8205/726/2/l21 2041
-
[40]
Star Formation in Self-gravitating Disks in Active Galactic Nuclei. II. Episodic Formation of Broad-line Regions. , keywords =. doi:10.1088/0004-637X/746/2/137 , archivePrefix =. 1202.0062 , primaryClass =
work page internal anchor Pith review Pith/arXiv arXiv doi:10.1088/0004-637x/746/2/137
-
[41]
Caltech-NRAO Stripe 82 Survey (CNSS). V. AGNs That Transitioned to Radio-loud State. , keywords =. doi:10.3847/1538-4357/abe62d , archivePrefix =. 2103.08422 , primaryClass =
work page internal anchor Pith review Pith/arXiv arXiv doi:10.3847/1538-4357/abe62d
-
[42]
1ES 1927+654: An AGN Caught Changing Look on a Timescale of Months
1ES 1927+654: An AGN Caught Changing Look on a Timescale of Months. , keywords =. doi:10.3847/1538-4357/ab39e4 , archivePrefix =. 1903.11084 , primaryClass =
work page internal anchor Pith review Pith/arXiv arXiv doi:10.3847/1538-4357/ab39e4 1927
-
[43]
VLBA Identification of the Milliarcsecond Active Nucleus in the Seyfert Galaxy NGC 4151
VLBA Identification of the Milliarcsecond Active Nucleus in the Seyfert Galaxy NGC 4151. , keywords =. doi:10.1086/432034 , archivePrefix =. astro-ph/0505141 , primaryClass =
work page internal anchor Pith review Pith/arXiv arXiv doi:10.1086/432034
-
[44]
Magnetic acceleration of relativistic active galactic nucleus jets. , keywords =. doi:10.1111/j.1365-2966.2007.12050.x , archivePrefix =. astro-ph/0703146 , primaryClass =
-
[45]
Thermalization by synchrotron absorption in compact sources: electron and photon distributions. , keywords =. doi:10.1046/j.1365-8711.1998.01442.x , archivePrefix =. astro-ph/9712166 , primaryClass =
-
[46]
Coronal heating and emission mechanisms in AGN. arXiv e-prints , keywords =
-
[47]
Magnetic reconnection: flares and coronal heating in active galactic nuclei. , keywords =. doi:10.1046/j.1365-8711.1998.01950.x , archivePrefix =. astro-ph/9805347 , primaryClass =
-
[48]
The physics of fluids and plasmas : an introduction for astrophysicists /
-
[49]
AGN Coronal Emission models I. The Predicted Radio Emission
AGN coronal emission models - I. The predicted radio emission. , keywords =. doi:10.1093/mnras/stw772 , archivePrefix =. 1604.00646 , primaryClass =
work page internal anchor Pith review Pith/arXiv arXiv doi:10.1093/mnras/stw772
-
[50]
Detection of Coronal Magnetic Activity in Nearby Active Supermassive Black Holes
Detection of Coronal Magnetic Activity in nearby Active Supermassive Black Holes. , keywords =. doi:10.3847/1538-4357/aaeb95 , archivePrefix =. 1810.10732 , primaryClass =
work page internal anchor Pith review Pith/arXiv arXiv doi:10.3847/1538-4357/aaeb95
-
[51]
X-Ray Reverberation From Black Hole Accretion Disks with Realistic Geometric Thickness
X-Ray Reverberation from Black Hole Accretion Disks with Realistic Geometric Thickness. , keywords =. doi:10.3847/1538-4357/aae9f2 , archivePrefix =. 1808.07877 , primaryClass =
work page internal anchor Pith review Pith/arXiv arXiv doi:10.3847/1538-4357/aae9f2
-
[52]
Constraining Emission Models of Luminous Blazar Sources
Constraining Emission Models of Luminous Blazar Sources. , keywords =. doi:10.1088/0004-637X/704/1/38 , archivePrefix =. 0904.1414 , primaryClass =
work page internal anchor Pith review Pith/arXiv arXiv doi:10.1088/0004-637x/704/1/38
-
[53]
On the origin of radio emission in radio-quiet quasars. , keywords =. doi:10.1111/j.1365-2966.2008.13806.x , archivePrefix =. 0808.0637 , primaryClass =
-
[54]
Properties of AGN coronae in the NuSTAR era II: hybrid plasma
Properties of AGN coronae in the NuSTAR era - II. Hybrid plasma. , keywords =. doi:10.1093/mnras/stx221 , archivePrefix =. 1701.06774 , primaryClass =
work page internal anchor Pith review Pith/arXiv arXiv doi:10.1093/mnras/stx221
-
[55]
High Energy Processes in Accreting Black Holes , year = 1999, editor =
The Physics of Hybrid Thermal/Non-Thermal Plasmas. High Energy Processes in Accreting Black Holes , year = 1999, editor =
work page 1999
-
[56]
Time-dependent models of magnetized pair plasmas. , keywords =. doi:10.1093/mnras/258.4.657 , adsurl =
-
[57]
2011, MNRAS, 412, 979, doi: 10.1111/j.1365-2966.2010.17959.x
X-ray and radio variability in the low-luminosity active galactic nucleus NGC 7213. , keywords =. doi:10.1111/j.1365-2966.2010.17692.x , archivePrefix =. 1009.2430 , primaryClass =
-
[58]
Measuring the broad-band power spectra of active galactic nuclei with RXTE. , keywords =. doi:10.1046/j.1365-8711.2002.05298.x , archivePrefix =. astro-ph/0201134 , primaryClass =
-
[59]
A tidal disruption flare in a massive galaxy? Implications for the fuelling mechanisms of nuclear black holes. , keywords =. doi:10.1093/mnras/stv1095 , archivePrefix =. 1503.04870 , primaryClass =
work page internal anchor Pith review Pith/arXiv arXiv doi:10.1093/mnras/stv1095
-
[60]
Tidal disruption events in active galactic nuclei
Tidal Disruption Events in Active Galactic Nuclei. , keywords =. doi:10.3847/1538-4357/ab2b40 , archivePrefix =. 1904.12261 , primaryClass =
work page internal anchor Pith review Pith/arXiv arXiv doi:10.3847/1538-4357/ab2b40 1904
-
[61]
Magnetic flux inversion in a peculiar changing look AGN
Magnetic flux inversion in a peculiar changing look AGN. , keywords =. doi:10.1093/mnrasl/slab002 , archivePrefix =. 2011.01954 , primaryClass =
work page internal anchor Pith review Pith/arXiv arXiv doi:10.1093/mnrasl/slab002 2011
-
[62]
, year = 1968, month = jul, volume =
Comparison of Solar X-Ray Line Emission with Microwave Emission during Flares. , year = 1968, month = jul, volume =. doi:10.1086/180220 , adsurl =
-
[63]
Simultaneous Millimeter-wave and X-ray monitoring of the Seyfert Galaxy NGC 7469
Simultaneous Millimetre-wave and X-ray monitoring of the Seyfert galaxy NGC 7469. , keywords =. doi:10.1093/mnras/stz3273 , archivePrefix =. 1911.04544 , primaryClass =
work page internal anchor Pith review Pith/arXiv arXiv doi:10.1093/mnras/stz3273 1911
-
[64]
What drives the radio slopes in radio quiet quasars?
What drives the radio slopes in radio-quiet quasars?. , keywords =. doi:10.1093/mnras/sty3098 , archivePrefix =. 1810.10245 , primaryClass =
work page internal anchor Pith review Pith/arXiv arXiv doi:10.1093/mnras/sty3098
-
[65]
Building the radio spectral distribution of radio-quiet quasars
The PG-RQS survey. Building the radio spectral distribution of radio-quiet quasars. I. The 45-GHz data. arXiv e-prints , keywords =
-
[66]
Broad-band -ray and X-ray spectra of NGC 4151 and their implications for physical processes and geometry. , keywords =. doi:10.1093/mnras/283.1.193 , archivePrefix =. astro-ph/9607015 , primaryClass =
work page internal anchor Pith review Pith/arXiv arXiv doi:10.1093/mnras/283.1.193
-
[67]
Accretion disc coronae as magnetic reservoirs. , keywords =. doi:10.1046/j.1365-8711.2001.04060.x , archivePrefix =. astro-ph/0009498 , primaryClass =
-
[68]
Thermal synchrotron radiation and its Comptonization in compact X-ray sources. , keywords =. doi:10.1046/j.1365-8711.2000.03297.x , archivePrefix =. astro-ph/9911126 , primaryClass =
-
[69]
Chandra Snapshot Observations of Low-Luminosity AGNs with a Compact Radio Source
Chandra Snapshot Observations of Low-Luminosity Active Galactic Nuclei with a Compact Radio Source. , keywords =. doi:10.1086/345339 , archivePrefix =. astro-ph/0209607 , primaryClass =
work page internal anchor Pith review Pith/arXiv arXiv doi:10.1086/345339
-
[70]
Electromagnetic extraction of energy from Kerr black holes. , keywords =. doi:10.1093/mnras/179.3.433 , adsurl =
-
[71]
Relativistic jets as compact radio sources. , keywords =. doi:10.1086/157262 , adsurl =
-
[72]
Efficient generation of jets from magnetically arrested accretion on a rapidly spinning black hole. , keywords =. doi:10.1111/j.1745-3933.2011.01147.x , archivePrefix =. 1108.0412 , primaryClass =
-
[73]
Radio Variability in Seyfert Nuclei
Radio Variability in Seyfert Nuclei. , keywords =. doi:10.1088/0004-637X/703/1/802 , archivePrefix =. 0907.1489 , primaryClass =
work page internal anchor Pith review Pith/arXiv arXiv doi:10.1088/0004-637x/703/1/802
-
[74]
X-Ray/Microwave Relation of Different Types of Active Stars. , keywords =. doi:10.1086/186766 , adsurl =
-
[75]
The 450 days X-ray monitoring of the changing-look AGN 1ES 1927+654
The 450 Day X-Ray Monitoring of the Changing-look AGN 1ES 1927+654. , keywords =. doi:10.3847/1538-4365/abe94b , archivePrefix =. 2102.05666 , primaryClass =
work page internal anchor Pith review Pith/arXiv arXiv doi:10.3847/1538-4365/abe94b 1927
-
[76]
Variability of Markarian 1018: Seyfert 1.9 to Seyfert 1. , keywords =. doi:10.1086/164758 , adsurl =
-
[77]
The Close AGN Reference Survey (CARS). What is causing Mrk 1018's return to the shadows after 30 years?. , keywords =. doi:10.1051/0004-6361/201629245 , archivePrefix =. 1609.04425 , primaryClass =
work page internal anchor Pith review Pith/arXiv arXiv doi:10.1051/0004-6361/201629245
-
[78]
AGN Type-casting: Mrk 590 No Longer Fits the Role
The Typecasting of Active Galactic Nuclei: Mrk 590 no Longer Fits the Role. , keywords =. doi:10.1088/0004-637X/796/2/134 , archivePrefix =. 1404.4879 , primaryClass =
work page internal anchor Pith review Pith/arXiv arXiv doi:10.1088/0004-637x/796/2/134
-
[79]
The Changing-Look Quasar Mrk 590 is Awakening
The Changing-look Quasar Mrk 590 Is Awakening. , keywords =. doi:10.3847/1538-4357/aadd91 , archivePrefix =. 1810.06616 , primaryClass =
work page internal anchor Pith review Pith/arXiv arXiv doi:10.3847/1538-4357/aadd91
-
[80]
A Remarkable Long-term Light Curve and Deep, Low-state Spectroscopy: Swift and XMM-Newton Monitoring of the NLS1 Galaxy Mkn 335. , keywords =. doi:10.1088/0067-0049/199/2/28 , archivePrefix =. 1202.4692 , primaryClass =
work page internal anchor Pith review Pith/arXiv arXiv doi:10.1088/0067-0049/199/2/28
-
[81]
The Swift Gamma-Ray Burst Mission
The Swift Gamma-Ray Burst Mission. , keywords =. doi:10.1086/422091 , archivePrefix =. astro-ph/0405233 , primaryClass =
work page internal anchor Pith review Pith/arXiv arXiv doi:10.1086/422091
-
[84]
The Synchrotron Boiler. , keywords =. doi:10.1086/185300 , adsurl =
discussion (0)
Sign in with ORCID, Apple, or X to comment. Anyone can read and Pith papers without signing in.