REVIEW 2 major objections 4 minor 27 references
Gradient Boosting Survival Tree with Applications in Credit Scoring
T0 review · 2 major / 4 minor · reviewed 2026-08-14 · deepseek-v4-flash
Pith's one-line read The paper introduces gradient boosting survival trees, a nonparametric ensemble that models the chance of default in each repayment period, and reports that it outperforms seven established survival and credit-scoring models on two large…
desk verdict The GBST model is a clean extension of XGBoost to survival trees, but the paper's significance claims lean on invalid LOOCV t-tests and need a corrected comparison. read the letter →
The pith
A machine-rendered reading of the paper's core claim, the machinery that carries it, and where it could break.
The reading
What carries the argument
The load-bearing object is the survival tree with time-dependent leaf weights. A tree maps a borrower's features to a leaf, and each leaf $l$ carries weights $w_l(\tau_j)$ for every observation period $\tau_j$, entering the hazard through the logit link $h(\tau_j;x)=1/(1+\exp(-\hat f(\tau_j;x)))$. The ensemble $\hat f=\sum_k f_k$ is grown additively: at each round the algorithm takes a second-order Taylor expansion of the negative log-likelihood, computes per-period gradients and Hessians of the logistic loss, and selects splits by the resulting loss reduction. The optimal leaf weight at period $j$ is the negative ratio of the summed gradient to the summed Hessian plus the $l_2$ penalty, which makes the per-period updates parallel and closed-form. Because the objective is minimized simultaneously across all periods, the model fits the whole survival curve rather than fitting each horizon independently.
What would settle it
Re-run the comparison with repeated train/test splits that share no training data and recompute per-month AUC and KS on all loans, weighting by the inverse probability of remaining uncensored; if GBST no longer leads on the concordance index, AUC, and KS, the paper's central claim is not supported.
Extended reading notes
Core claim
The paper's central claim is that a survival tree ensemble trained by gradient boosting on the discrete-time negative log-likelihood can outperform existing survival models on real credit data. Each leaf of a GBST tree carries a function of time rather than a single constant, so the ensemble produces an entire survival curve $\hat S(t;x)$ for each borrower. The loss decomposes into a sum over observation periods, and each boosting round uses the first and second derivatives of the logistic loss with respect to the logit of the hazard, yielding closed-form leaf weights and an analytic split-gain criterion that updates all time periods simultaneously. On a public US loan dataset and a proprietary Chinese consumer-finance dataset, the authors report that GBST achieves the highest concordance index in their leave-one-month-out experiments (0.6867 and 0.7997, respectively) and the highest per-month AUC and KS values, with differences they report as statistically significant. The paper concludes that GBST is a practically useful nonparametric model for discrete-time credit default risk.
Load-bearing premise
The whole conclusion depends on the fairness of the comparison: if the statistical tests or the month-by-month accuracy measures are biased, GBST's claimed edge may disappear.
Editorial extensions
If this is right
- Lenders get a predicted survival curve for every borrower, so they can set different cutoffs for short- and long-term default risk instead of relying on one lifetime score.
- The closed-form split gains and leaf weights let the method handle the high-dimensional, noisy application data typical of internet consumer finance after preprocessing.
- Survival probabilities at each repayment month make GBST directly comparable with classification-based scores through AUC and KS at every horizon.
- The reported convergence behavior means roughly 30 boosting rounds suffice, so the model can be retrained routinely in production.
- If the reported gains generalize, GBST gives a nonparametric alternative to proportional-hazards and random-survival-forest models for discrete-time default prediction.
Reading between the lines
- The same second-order likelihood boosting scheme could be adapted to competing risks, where default and prepayment compete, by giving each event its own hazard logit while sharing the tree structure.
- Because the per-month metrics are computed only on loans still at risk, the late-horizon advantages may shift under a censoring-adjusted evaluation; a reader should recheck those numbers before relying on them.
- The consistent margin over a strong tree-boosting classifier suggests that modeling the time of default, rather than collapsing it into a binary label, carries additional information for credit scoring.
- The method is general: any discretely observed time-to-event problem in which some cases never experience the event during the observation window could use the same objective.
Signed reviews
Editorial analysis
A structured set of objections, weighed in public.
Referee Report
Summary. The paper proposes GBST, a gradient boosting algorithm for discrete-time survival trees. The hazard is modeled via a logistic link f(t;x), represented by an additive ensemble of survival trees whose leaf weights are functions of time. The negative log-likelihood (Eq. 10) is optimized by gradient boosting; for a fixed tree structure, the optimal leaf weights have a closed form (Eq. 16) and a corresponding split gain (Eq. 18). Experiments on the Lending Club dataset and a private 360 Finance dataset compare GBST against Cox, RSF, XGBoost, CoxBoost, GBMCI, CIF, and DeepHit, using C-index, per-month AUC and KS, and survival-group default-rate plots. The paper claims that GBST significantly outperforms all existing models on both datasets.
Significance. If the empirical claims hold, GBST is a practically useful nonparametric model for discrete-time credit default risk. Its likelihood-based derivation is coherent, the leaf-weight update is closed-form and convex, and the code is publicly available. The paper addresses a real gap by testing survival models on large industrial credit datasets. However, the statistical evidence for the headline superiority claim rests on a flawed cross-validation significance test, so the strength of the empirical conclusions needs to be revised before the contribution can be fully assessed.
major comments (2)
- [Section 3.1.5 (Tables 3 and 4; also Section 3.2.3, Tables 8 and 9)] The paired t-tests used to declare GBST significantly better are invalid because the 10 leave-one-month-out folds have heavily overlapping training sets. Each training fold contains 9 of the 10 month blocks, so the 10 model fits and their fold-wise metrics are strongly positively correlated; the standard error of the mean difference is understated, making the p-values anti-conservative. Because several reported advantages are very small (e.g., month-5 AUC of 0.7267 vs 0.7252 for XGB; C-index 0.6867 vs 0.6809), the conclusion that GBST 'significantly outperforms' the baselines can hinge on an invalid test. Please redo the significance analysis with a method that accounts for training-set overlap, such as a block bootstrap resampling months, a corrected variance estimator for K-fold CV, or a mixed-effects model with month as a random effect, and report effect sizes with confidence intervals that respect the dependence structure.
- [Section 3.1.5, Table 4 and Section 3.2.3, Table 9] The text states that 'the difference between GBST and the other models are statistically significant (p-value < 0.05) with a few exceptions,' but Table 4 itself shows many non-significant entries, e.g., month-11 AUC (GBST 0.7161 vs XGB 0.7146, no marker), month-15 AUC (GBST 0.7081 vs XGB 0.7048, no marker), and month-19 AUC (GBST 0.6966 vs XGB 0.6930, no marker). This overstatement is independent of the test-validity issue and should be corrected so that the narrative matches the reported p-values.
minor comments (4)
- [Section 2.1, Eq. (6)] The handling of censoring times that fall in the interior of an interval is implicit: for a censored observation with J(t)=j, the likelihood contribution is taken as S(τ_j), i.e., the survival probability at the interval endpoint. Please state this convention explicitly.
- [Section 3.1.5 (and Section 3.2.3)] The per-month AUC and KS are computed on the risk set at each month; this is a conditional risk-set metric, not a marginal time-dependent AUC with inverse-probability-of-censoring weighting. The text should describe the metric as conditional on survival to the start of the month.
- [Introduction, Section 1] The claim that 'there exists no gradient boosting algorithm that is applied to survival trees' is too strong; existing implementations such as gradient boosting survival analysis in scikit-survival use tree-based learners. The distinction between those methods and the proposed survival-tree representation should be clarified.
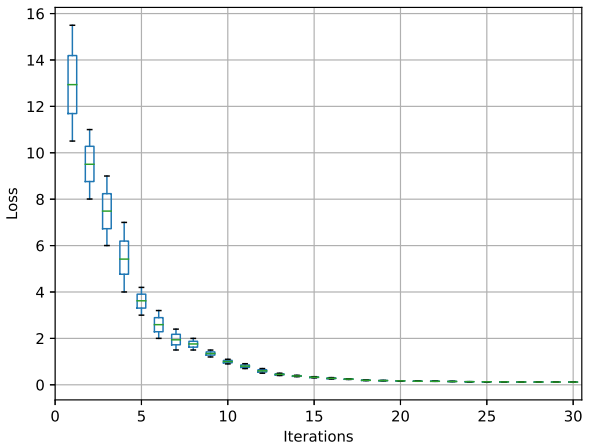
- [Section 3.1.3] The convergence experiment reports only the training loss; the statement that '30 iterations are sufficient' would be stronger if supported by a validation-loss or out-of-sample performance metric.
Circularity Check
No significant circularity: the likelihood-based GBST derivation and its external C-index/AUC/KS evaluation are self-contained.
full rationale
The paper's central derivation is self-contained: the model is fit by minimizing the negative log-likelihood loss in Eq. (10), and the split gain in Eq. (18) is exactly the reduction in that same likelihood objective; it is not a fitted version of the evaluation metrics. The reported C-index, AUC, and KS values are computed externally from predicted survival probabilities on held-out LOOCV test folds, so no evaluation quantity is used as a training target. Hyperparameter selection on validation folds with C-index or AUC as the tuning objective is ordinary model selection, not a prediction forced by construction, and the reported test-fold scores remain external to the fitted parameters. The paper also does not rely on a load-bearing self-citation or on a uniqueness theorem imported from the authors' prior work; its methodological citations, such as Friedman (2001), Chen and Guestrin (2016), and Kaplan and Meier (1958), are standard external references. Concerns about the paired t-test on overlapping LOOCV training folds are statistical validity issues rather than circularity, so they do not affect the circularity score. Overall, no step in the derivation reduces to its own input by definition.
Assumptions & free parameters
free parameters (6)
- L2 regularization lambda =
not reported
- learning rate =
not reported
- max tree depth =
not reported
- number of trees M =
not reported (30 iterations sufficient per convergence experiment)
- subsample ratio alpha =
20% in convergence experiment, final not reported
- number of selected features in 360 dataset =
50
assumptions (6)
- domain assumption Discrete-time hazard factorization with independent increments
- domain assumption Logit link between hazard and f(t;x), Eq. (3)
- ad hoc to paper f(t;x) is approximated by an additive ensemble of survival trees with leaf weights w_l(tau_j), Eq. (7)
- domain assumption i.i.d. samples and non-informative right censoring
- standard math Second-order Taylor expansion of the loss is sufficient
- standard math Kaplan-Meier estimator provides valid initial hazard
Cite this review
Pith. "Pith review of Gradient Boosting Survival Tree with Applications in Credit Scoring." pith.science (2026). https://pith.science/paper/E2GCJKD7
@misc{pith2026190803385,
  author       = {Pith},
  title        = {Pith review of: Gradient Boosting Survival Tree with Applications in Credit Scoring},
  year         = {2026},
  howpublished = {\url{https://pith.science/paper/E2GCJKD7}},
  note         = {Machine review of arXiv:1908.03385}
}
read the original abstract
Credit scoring plays a vital role in the field of consumer finance. Survival analysis provides an advanced solution to the credit-scoring problem by quantifying the probability of survival time. In order to deal with highly heterogeneous industrial data collected in Chinese market of consumer finance, we propose a nonparametric ensemble tree model called gradient boosting survival tree (GBST) that extends the survival tree models with a gradient boosting algorithm. The survival tree ensemble is learned by minimizing the negative log-likelihood in an additive manner. The proposed model optimizes the survival probability simultaneously for each time period, which can reduce the overall error significantly. Finally, as a test of the applicability, we apply the GBST model to quantify the credit risk with large-scale real market datasets. The results show that the GBST model outperforms the existing survival models measured by the concordance index (C-index), Kolmogorov-Smirnov (KS) index, as well as by the area under the receiver operating characteristic curve (AUC) of each time period.
Figures

Figures from the paper (5 more)
Reference graph
Works this paper leans on
-
[1]
Binder, H. and Schumacher, M. (2008). Allowing for mandatory covariates in boosting estimation of sparse high-dimensional survival models. BMC Bioinformatics , 9(1):14
work page 2008
-
[2]
Blakely, R. J. and Cox, A. (1972). Evidence for short geomagnetic polarity intervals in the early cenozoic. Journal of Geophysical Research , 77(35):7065--7072
work page 1972
-
[3]
Blumenstock, G., Lessmann, S., and Seow, H.-V. (2020). Deep learning for survival and competing risk modelling. Journal of the Operational Research Society , pages 1--13
work page 2020
-
[4]
Cao, R., Vilar, J. M., and Devia, A. (2009). Modelling consumer credit risk via survival analysis. Statistics and Operations Research Transactions , 33(1):0003--30
work page 2009
-
[5]
Chen, T. and Guestrin, C. (2016). Xgboost: A scalable tree boosting system. In Proceedings of the 22nd ACM International Conference on Knowledge Discovery and Data Mining , pages 785--794. ACM
work page 2016
-
[6]
Chen, Y., Jia, Z., Mercola, D., and Xie, X. (2013). A gradient boosting algorithm for survival analysis via direct optimization of concordance index. Computational and Mathematical Methods in Medicine , 2013
work page 2013
-
[7]
Dirick, L., Claeskens, G., and Baesens, B. (2017). Time to default in credit scoring using survival analysis: a benchmark study. Journal of the Operational Research Society , 68(6):652--665
work page 2017
-
[8]
Djeundje, V. B. and Crook, J. (2019). Dynamic survival models with varying coefficients for credit risks. European Journal of Operational Research , 275(1):319--333
work page 2019
Show all 27 references
-
[9]
Fern \'a ndez, T., Rivera, N., and Teh, Y. W. (2016). Gaussian processes for survival analysis. In Advances in Neural Information Processing Systems , pages 5021--5029
2016
-
[10]
Friedman, J. (2001). Greedy function approximation: a gradient boosting machine. Annals of Statistics , pages 1189--1232
2001
-
[11]
Friedman, J., Hastie, T., and Tibshirani, R. (2001). The Elements of Statistical Learning , volume 1. Springer
2001
-
[12]
Friedman, J. H. (2002). Stochastic gradient boosting. Computational Statistics and Data Analysis , 38(4):367--378
2002
-
[13]
Geck, M. (2012). Pycox: computing with (finite) coxeter groups and iwahori--hecke algebras. LMS Journal of Computation and Mathematics , 15:231--256
2012
-
[14]
and Olshen, R
Gordon, L. and Olshen, R. (1985). Tree-structured survival analysis. Cancer Treatment Reports , 69(10):1065--1069
1985
-
[15]
E., Califf, R
Harrell, F. E., Califf, R. M., Pryor, D. B., Lee, K. L., and Rosati, R. A. (1982). Evaluating the yield of medical tests. Jouranl of American Medical Association , 247(18):2543--2546
1982
-
[16]
Ishwaran, H., Kogalur, U., Blackstone, E., and Lauer, M. (2008). Random survival forests. The Annals of Applied Statistics , 2(3):841--860
2008
-
[17]
Historical data science trends on K aggle
Kaggle (2019). Historical data science trends on K aggle. https://www.kaggle.com/shivamb/data-science-trends-on-kaggle
2019
-
[18]
Kaplan, E. L. and Meier, P. (1958). Nonparametric estimation from incomplete observations. Journal of the American Statistical Association , 53(282):457--481
1958
-
[19]
R., Yoon, J., and van der Schaar, M
Lee, C., Zame, W. R., Yoon, J., and van der Schaar, M. (2018). Deep H it: A deep learning approach to survival analysis with competing risks. In 32 AAAI Conference on Artificial Intelligence
2018
-
[20]
Li, W., Ding, S., Wang, H., Chen, Y., and Yang, S. (2019). Heterogeneous ensemble learning with feature engineering for default prediction in peer-to-peer lending in C hina. World Wide Web , pages 1--23
2019
-
[21]
Narain, B. (1992). Survival analysis and the credit granting decision. Credit Scoring and Credit Control, Editors: Thomas L.C., Crook J.N., Edelman D.B., Oxford University Press
1992
-
[22]
B., Mwambi, H., Dheda, K., and Lesosky, M
Nasejje, J. B., Mwambi, H., Dheda, K., and Lesosky, M. (2017). A comparison of the conditional inference survival forest model to random survival forests based on a simulation study as well as on two applications with time-to-event data. BMC Medical Research Methodology , 17(1):115
2017
-
[23]
Pfister, S. A. T. (2021). Tabnet: Attentive interpretable tabular learning. In AAAI Conference on Artificial Intelligence
2021
-
[24]
P \"o lsterl, S. (2020). scikit-survival: A library for time-to-event analysis built on top of scikit-learn. Journal of Machine Learning Research , 21(212):1--6
2020
-
[25]
Popov, S., Morozov, S., and Babenko, A. (2020). Neural oblivious decision ensembles for deep learning on tabular data. In International Conference on Learning Representations
2020
-
[26]
Thomas, L., Edelman, D., and Crook, J. (2002). Credit Scoring and Its Applications . SIAM
2002
-
[27]
N., Dankowski, T., and Ziegler, A
Wright, M. N., Dankowski, T., and Ziegler, A. (2017). Unbiased split variable selection for random survival forests using maximally selected rank statistics. Statistics in Medicine , 36(8):1272--1284
2017
Reviewed August 14, 2026 · model on record in the stance chip above.
Discussion (0). Continue with ORCID to comment.