REVIEW 3 major objections 5 minor 90 references
Constraining the detectability of water ice in debris disks
T0 review · 3 major / 5 minor · reviewed 2026-08-14 · deepseek-v4-flash
Pith's one-line read This paper argues that the 3 μm and 44 μm water-ice features are potentially detectable in debris disks with JWST/NIRCam and SPICA/SAFARI, which would make the location of the ice survival line testable.
desk verdict Careful forward model with genuinely useful ice optical constants and testable predictions, but the headline JWST/SPICA detectability claim rests on dimensionless brightness ratios with no SNR analysis — and under the paper's own photosputtering cases the relevant absolute fluxes drop by orders of magnitude. read the letter →
The pith
A machine-rendered reading of the paper's core claim, the machinery that carries it, and where it could break.
The reading
What carries the argument
The central machinery is a parameterized radiative-transfer simulation of an optically thin debris disk, using Maxwell-Garnett effective-medium theory to build optical constants for inhomogeneous ice-silicate-vacuum mixtures, Mie-theory cross sections, and the DMS code to synthesize spectral energy distributions, spatially resolved images, and polarization maps. The ice destruction mechanisms enter by truncating the grain size distribution and the inner disk radius: sublimation sets a temperature boundary, while UV photosputtering and collisions determine the smallest grains that survive at a given radius. The load-bearing comparisons are surface-brightness ratios at 2.8 and 3.2 microns and at 35 and 44 microns, which isolate the ice features from the continuum.
What would settle it
Take a debris disk matching the fiducial model (A6 V star, 19.3 pc, $10^{-8}$ solar masses of dust, inner edge 3 au, ice fraction around 0.5) and observe it with NIRCam at 2.8 and 3.2 microns and with SAFARI at 35 and 44 microns. If the 3.2/2.8 and 44/35 surface-brightness ratios are consistent with unity at the instrument noise level, or if the continuum is detected and the features are absent, the predicted detectability and the assumed ice survival are falsified.
Extended reading notes
Core claim
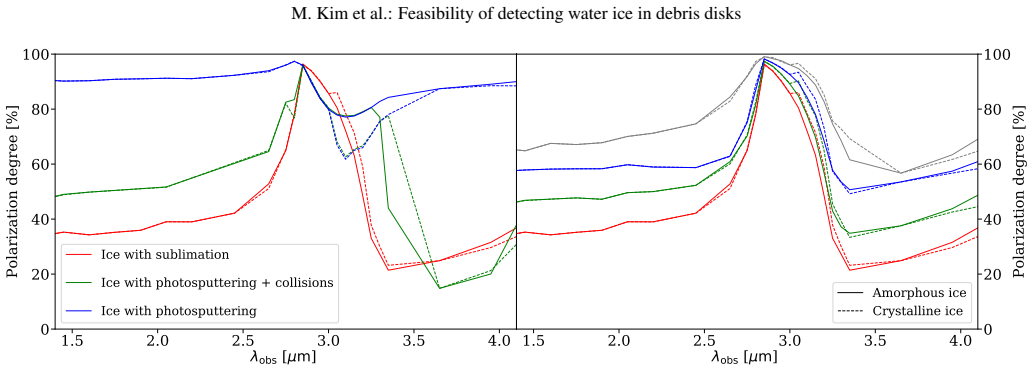
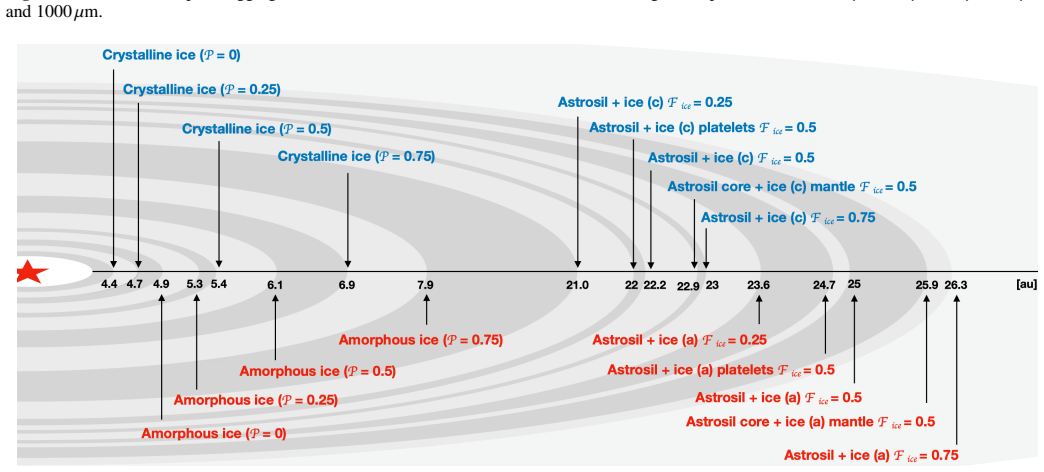
On its own terms, the paper establishes that the 3 micron and 44 micron water-ice features are potentially detectable in future observations of typical debris disks, provided the disk has something like $10^{-8}$ solar masses of dust at about 19 pc and ice fractions comparable to those assumed. It further shows that sublimation, planetesimal collisions, and UV photosputtering each change the predicted observables: photosputtering wipes out small ice grains and weakens or removes the 44 micron feature, collisional activity partially restores small grains in inner regions, and the remaining feature strength is set by the ice-to-silicate fraction. The predicted location of the ice survival line moves inward for lower ice fractions and outward for higher porosity, ranging from 4.4 au for pure compact ice to 26.3 au for icy-silicate aggregates, and the 3 micron band shows enhanced polarization for ice-rich or highly porous grains. The detectability argument is made through surface-brightness ratios inside and outside each ice band rather than through absolute sensitivity or exposure-time calculations.
Load-bearing premise
The detectability claim rests on the assumed absolute brightness level: a disk with $10^{-8}$ solar masses of dust at 19.3 pc, and if a real target is ten times less massive, the ice features would be ten times fainter while the paper gives only feature-to-continuum ratios, not a noise or exposure-time analysis.
Editorial extensions
If this is right
- JWST/NIRCam and SPICA/SAFARI observations could confirm or rule out water ice in nearby debris disks, a question current data leave essentially open.
- A detection would make the ice survival line an observable quantity: the inner edge of the ice reservoir could be measured and compared with the predicted 4.4-26.3 au range.
- The 3 micron polarization signal gives a way to distinguish ice-rich, porous grains from silicate-dominated grains in scattered light.
- The 44 micron and 62 micron far-infrared features are clean tracers of ice-rich aggregates because they are not confused with other solid-state bands, unlike many mid-infrared features.
- If the features are not seen despite a detected disk, the non-detection would constrain the ice fraction or the efficiency of UV photosputtering and collisions in destroying ice.
Reading between the lines
- Because the detectability argument rests on feature-to-continuum ratios, the practical reach likely extends to more distant or less massive disks only with longer integrations; the 3 micron feature, present even in ice-poor aggregates, is the more robust detection channel, while the 44 micron feature is a better compositional diagnostic for ice-rich material.
- The predicted dependence of the ice survival line on porosity suggests that spatially resolving the region where the spectral index jumps could be used to measure grain porosity, not just ice presence.
- The same simulation machinery could be applied to disks around cooler or more UV-active stars, where photosputtering would move the survival line and change which disks show the features; this is a testable extension not considered in the paper.
- The steep submillimeter spectral index predicted for pure crystalline ice could allow multi-wavelength submillimeter maps to distinguish crystalline from amorphous ice even when the 44 micron band is too faint to detect.
Signed reviews
Editorial analysis
A structured set of objections, weighed in public.
Referee Report
Summary. The paper presents a forward-modeling feasibility study of detecting water ice in debris disks with future instruments (JWST/NIRCam and SPICA/SAFARI). It constructs icy dust mixtures from laboratory-measured optical constants for amorphous and crystalline ice and astrosilicate, treats sublimation, UV photosputtering, and collisional dust production as destruction mechanisms, and computes synthetic SEDs, spatially resolved surface-brightness maps, polarization maps, and spectral-index maps using the DMS code. The main claims are that the ~3 micron and ~44 micron water ice features can potentially be detected in typical debris disks, that destruction mechanisms strongly shape the observable appearance, that highly porous or ice-rich grains produce enhanced polarization near 3 microns, and that the ice survival line lies at about 4.4-26.3 au for blowout-sized grains in the reference model.
Significance. If the detectability claim were quantitatively supported, the paper would provide directly usable predictions for JWST and SPICA programs aimed at confirming or ruling out water ice in debris disks, and the predicted ice survival line would become a testable diagnostic. The paper has several strengths: all model parameters are explicitly stated in Table 1; the optical constants are tied to specific laboratory measurements; the forward-modeling pipeline (DMS, Miex) is described and is appropriate for optically thin disks; and the inclusion of UV photosputtering and collisional processing alongside sublimation goes beyond earlier studies. The results on polarization and on the ice survival line are interesting even independently of the detectability claim. The central weakness is that the 'detectability' conclusion in Section 4.4 is drawn from dimensionless surface-brightness ratios without any calculation of absolute signal, instrument sensitivity, noise, or exposure time, so the headline claim is not yet established. This gap is substantive but fixable, and the underlying modeling appears internally consistent.
major comments (3)
- [Section 4.4, Figs. 16 and 17] The detectability claim in the abstract and in Section 4.4 rests on dimensionless surface-brightness ratios (SB(2.8 um)/SB(3.2 um) and SB(35 um)/SB(44 um)). These ratios are independent of the adopted dust mass (10^-8 M_sun) and distance (19.3 pc), and the section contains no signal-to-noise calculation, no instrument sensitivity limit, no PSF or aperture treatment, and no exposure-time estimate for JWST/NIRCam or SPICA/SAFARI. A ratio significantly different from unity does not by itself show that the absolute surface brightness exceeds the instrument noise, especially for an optically thin disk whose surface brightness can be orders of magnitude below the photospheric background or the confusion limit. The authors should either add a quantitative detectability analysis (e.g., predicted SNR versus exposure time for representative radial positions and for the stated reference model) or explicitly temper the claim to say that the features produce favorable contrast ratios in the models, with detectability to be assessed in a subsequent instrument study.
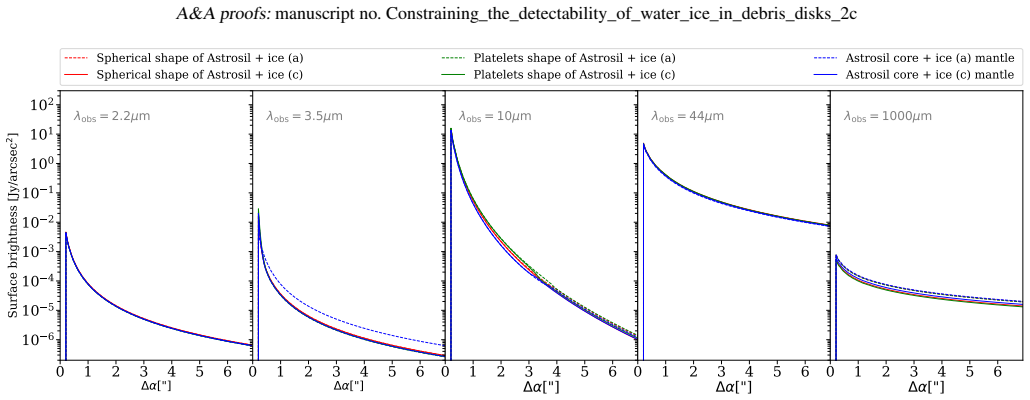
- [Section 4.1.1 (Fig. 5), Section 4.2.1 (Fig. 11), and Fig. 16] There is a direct conflict between the reported absolute flux reduction and the way detectability is argued for the 3 micron feature. Section 4.1.1 states that UV photosputtering reduces the near-IR to mid-IR flux by about eight orders of magnitude relative to the sublimation-only case, and the radial profiles in Fig. 11 show that the photosputtering cases have extremely low absolute surface brightness at 2.2 and 3.5 microns. Nevertheless, the left panel of Fig. 16 shows high surface-brightness ratios for the photosputtering cases, and Section 4.4 uses such ratios as evidence of detectability. A ratio based on two faint signals does not indicate that either signal is detectable. The authors should either provide absolute surface brightness values together with sensitivity thresholds for the relevant radii and wavelengths, or restrict the detectability claim to the cases (sublimation-only or collision+photosputtering) for which the absolute flux could plausibly be observed.
- [Table 1 and Section 4.4] The reference model assumes a dust mass of 10^-8 M_sun and a distance of 19.3 pc. The observed debris disk dust mass range quoted in Section 3 is 10^-9 to several times 10^-7 M_sun, so a disk at the low-mass end would be ten times fainter in absolute flux than the reference model, and the feature-to-continuum ratios presented in Figs. 16 and 17 are insensitive to this factor. Since the paper's stated goal is to constrain detectability in 'typical' debris disks, the authors should quantify how the detectability conclusion scales with dust mass and distance, or state explicitly which sub-range of the observed parameter space the conclusion covers. Without this, the headline claim is not matched to the stated scope.
minor comments (5)
- [Abstract and Section 4.4] The manuscript interchangeably describes 'the 3 um ice feature' and uses wavelengths of 2.8 and 3.2 um as the 'outside' and 'inside' bands in Fig. 16; please clarify once in the text whether the feature peak is at 2.8, 3.0, or 3.2 um and how the chosen comparison wavelengths relate to the feature profile, so that the reader can interpret the ratios correctly.
- [Table 1] The distance of 19.3 pc is listed in Table 1 without a reference; since this is a specific value for the beta Pic-like star, the authors should cite the source (e.g., Crifo et al. 1997 or a parallax catalog) in the table caption or in Section 3.
- [Section 4.2 and Appendix A] The color scales in Figs. A.1, A.2, and A.3 use different flux ranges (e.g., 10^-14 to 10^-1, 10^-13 to 10^1, and 10^-9 to 10^-1 Jy/arcsec^2, respectively), which makes cross-comparison of absolute surface brightness between the different destruction-mechanism and composition cases difficult; consider using a common scale or explicitly noting the range differences in each caption.
- [Section 4.3.2 and Figure 15] The text in Section 4.3.2 says 'the snow line causes a radial discontinuity' and then discusses the 'ice survival line'; since Section 2 explicitly distinguishes these terms, the wording in Section 4.3.2 should be harmonized to avoid confusing the protoplanetary-disk snow line with the debris-disk ice survival line.
- [Figures 16 and 17] The captions of Figs. 16 and 17 state that solid and dashed lines indicate amorphous and crystalline ice, respectively, but the left panels contain multiple line styles for different destruction mechanisms; please make the line-style/color legend complete within each panel so each curve is identifiable.
Circularity Check
No significant circularity: forward-model feasibility study whose synthetic ice features are conditional model outputs, not fitted or renamed inputs.
full rationale
This paper is a numerical feasibility/forward-modeling study, not an inversion or fit. The synthetic SEDs, images, and polarization maps are produced by feeding laboratory-measured complex refractive indices (Figs. 1-2), effective-medium mixing (Ossenkopf 1991), a Dohnanyi size distribution, and destruction prescriptions from Grigorieva et al. (2007) into the DMS radiative-transfer code (Kim et al. 2018). The resulting 3 and 44 micron features are inherited from the input ice optical constants; that is the intended conditional logic of a detectability study ("if ice is present with these properties, features appear"), not a circular derivation. No parameter is fitted to debris-disk observations, and no quantity used as a prediction is defined in terms of another predicted quantity. The ice survival line is derived from assumed sublimation temperatures and calculated grain temperatures, so it is a model output rather than a restatement of the input. The strongest weakness is that Section 4.4 supports "potentially detected" with dimensionless surface-brightness ratios rather than instrument sensitivity or exposure-time calculations, and the adopted dust mass (10^-8 M_sun) and distance (19.3 pc) set the absolute flux; this is a completeness and correctness concern, not circularity. Self-citations to Kim et al. (2018), Potapov et al. (2018a,b), Potapov et al. (2019), and Reinert et al. (2015) are code and laboratory-data citations whose content is independent of the present conclusions and is not invoked as a uniqueness proof or a forbidden-alternative argument. No equation in the paper reduces by construction to an input, and no fitted parameter is renamed as a prediction.
Assumptions & free parameters
free parameters (5)
- Dust mass =
1e-8 M_sun
- Distance to the system =
19.3 pc
- Disk inclination and scattering angle =
0 deg face-on; 90 deg scattering
- Grain size range and slope =
0.1 to 1000 um, power -3.5
- Photosputtering/collision boundaries =
5 mm at 80 au; 20 um at 40 au
assumptions (5)
- domain assumption Maxwell-Garnett effective medium theory accurately captures the optical properties of porous, core-mantle, and platelet icy aggregates.
- domain assumption Debris disks are optically thin to stellar UV radiation.
- standard math The Dohnanyi size distribution n(a) proportional to a^-3.5 holds across 0.1 to 1000 microns.
- domain assumption Sublimation temperatures of 100 K (amorphous) and 105 K (crystalline) ice apply inside aggregates.
- ad hoc to paper The two-step temperature scheme is adequate without iteration.
Cite this review
Pith. "Pith review of Constraining the detectability of water ice in debris disks." pith.science (2026). https://pith.science/paper/E33TKLOE
@misc{pith2026190807354,
  author       = {Pith},
  title        = {Pith review of: Constraining the detectability of water ice in debris disks},
  year         = {2026},
  howpublished = {\url{https://pith.science/paper/E33TKLOE}},
  note         = {Machine review of arXiv:1908.07354}
}
abstract
Water ice is important for the evolution and preservation of life. Identifying the distribution of water ice in debris disks is therefore of great interest in the field of astrobiology. Furthermore, icy dust grains are expected to play important roles throughout the entire planet formation process. However, currently available observations only allow deriving weak conclusions about the existence of water ice in debris disks. We investigate whether it is feasible to detect water ice in typical debris disk systems. We take the following ice destruction mechanisms into account: sublimation of ice, dust production through planetesimal collisions, and photosputtering by UV-bright central stars. We consider icy dust mixture particles with various shapes consisting of amorphous ice, crystalline ice, astrosilicate, and vacuum inclusions. We calculated optical properties of inhomogeneous icy dust mixtures using effective medium theories, that is, Maxwell-Garnett rules. Subsequently, we generated synthetic debris disk observables, such as spectral energy distributions and spatially resolved thermal reemission and scattered light intensity and polarization maps with our code DMS. We find that the prominent $\sim$ 3 $\mu\rm{m}$ and 44 $\mu\rm{m}$ water ice features can be potentially detected in future observations of debris disks with the James Webb Space Telescope and the Space Infrared telescope for Cosmology and Astrophysics. We show that the sublimation of ice, collisions between planetesimals, and photosputtering caused by UV sources clearly affect the observational appearance of debris disk systems. In addition, highly porous ice tends to produce highly polarized radiation at around 3 $\mu\rm{m}$. Finally, the location of the ice survival line is determined by various dust properties such as a fractional ratio of ice versus dust, physical states of ice, and the porosity of icy grains.
Figures


Figures from the paper (14 more)






Reference graph
Works this paper leans on
-
[1]
2013, A&A, 12
Aikawa, Y ., Kamuro, D., Sakon, I., et al. 2013, A&A, 12
2013
-
[2]
1989, ApJ, 337, 494
Artymowicz, P., Burrows, C., & Paresce, F. 1989, ApJ, 337, 494
1989
-
[3]
& Clampin, M
Artymowicz, P. & Clampin, M. 1997, ApJ, 490, 863
1997
-
[4]
M., Bruderer, S., Muzerolle, J., & Meyer, M
Banzatti, A., Pontoppidan, K. M., Bruderer, S., Muzerolle, J., & Meyer, M. R. 2015, ApJ, 798, 16
2015
-
[5]
2011, A&A, 526, A85
Beck, P., Quirico, E., Sevestre, D., et al. 2011, A&A, 526, A85
2011
-
[6]
& Whalley, J
Bertie, E. & Whalley, J. E. 1967, Journal of Colloid and Interface Science, 25, 161
1967
-
[7]
R., Absil, O., Agócs, T., et al
Brandl, B. R., Absil, O., Agócs, T., et al. 2018, Proc. SPIE10702, Ground-based and Airborne Instrumentation for Astronomy VII, 10702
2018
-
[8]
H., Clark, R
Brown, R. H., Clark, R. N., Buratti, B. J., et al. 2006, Science, 311, 1425
2006
Show all 90 references
-
[9]
Brown, W. A. & Bolina, A. S. 2007, MNRAS, 374, 1006
2007
-
[10]
L., Lanzerotti, L., & Johnson, R
Brown, W. L., Lanzerotti, L., & Johnson, R. E. 1982, Science, 218, 525 Brunngräber, R., Wolf, S., Kirchschlager, F., & Ertel, S. 2017, MNRAS, 464, 4383
1982
-
[11]
H., Fitzgerald, M
Chen, C. H., Fitzgerald, M. P., & Smith, P. S. 2008, ApJ, 689, 539
2008
-
[12]
P., Anderson, M
Collings, M. P., Anderson, M. A., Chen, R., et al. 2004, MNRAS, 354, 1133
2004
-
[13]
1997, A&A, 320, L29
Crifo, F., Vidal-Madjar, A., Lallement, R., Ferlet, R., & Gerbaldi, M. 1997, A&A, 320, L29
1997
-
[14]
B., Rajaram, B., Toon, O
Curtis, D. B., Rajaram, B., Toon, O. B., & Tolbert, M. A. 2005, Appl. Opt., 44, 4102
2005
-
[15]
R., et al
Dartois, E., Cox, P., Roelfsema, P. R., et al. 1998, A&A, 338, L21
1998
-
[16]
Dohnanyi, J. S. 1969, J. Geophys. Res., 74, 2531
1969
-
[17]
2005, ApJL, 635
Dominik, C., Ceccarelli, C., Hollenbach, D., & Kaufman, M. 2005, ApJL, 635
2005
-
[18]
Draine, B. T. 2003, ApJ, 598, 1017
2003
-
[19]
Eisner, J. A. 2007, Nature, 447
2007
-
[20]
J., Collings, M
Fraser, H. J., Collings, M. P., McCoustra, M. R. S., & Williams, D. A. 2001, MNRAS, 327, 1165
2001
-
[21]
& Wagner, W
Fraser, R. & Wagner, W. 2007, Geochimica et Cosmochimica Acta, 71, 36
2007
-
[22]
2011, SPICA Yellow book, 3
Goicoechea, J., Isaak, K., Roelfsema, P., Spinoglio, L., & Swinyard, B. 2011, SPICA Yellow book, 3
2011
-
[23]
A., Ardila, D
Golimowski, D. A., Ardila, D. R., Krist, J. E., et al. 2006, A&A, 131, 3109 Gor’kavyi, N. N., Ozernoy, L. M., Mather, J. C., & Taidakova, T. 1997, ApJ, 488, 268 Article number, page 12 of 17 M. Kim et al.: Feasibility of detecting water ice in debris disks
2006
-
[24]
O., Corbally, C
Gray, R. O., Corbally, C. J., Garrison, R. F., et al. 2006, The Astronomical Jour- nal, 132, 161
2006
-
[25]
S., Holland, W
Greaves, J. S., Holland, W. S., Wyatt, M. C., et al. 2005, ApJ, 619, L187
2005
-
[26]
Greenberg, J. M. & Vandebult, C. E. P. M. 1984, In Royal Observatory Proc. of the Workshop on Lab. and Observational Infrared Spectra of Interstellar Dust, 70
1984
-
[27]
2007, A&A, 475, 755 Häßner, D., Mutschke, H., Blum, J., Zeller, T., & Gundlach, B
Grigorieva, A., Thébault, P., Artymowicz, P., & Brandeker, A. 2007, A&A, 475, 755 Häßner, D., Mutschke, H., Blum, J., Zeller, T., & Gundlach, B. 2018, MNRAS, 481, 5022
2007
-
[28]
H., Allard, F., & Baron, E
Hauschildt, P. H., Allard, F., & Baron, E. 1999, ApJ, 512, 337
1999
-
[29]
1985, in Protostars and Planets II, ed
Hayashi, C., Nakazawa, K., & Nakagawa, Y . 1985, in Protostars and Planets II, ed. D. C. Black & M. S. Matthews (Tucson: Univ. Arizona Press), 1100
1985
-
[30]
& Salama, F
Henning, T. & Salama, F. 1998, Science, 282, 2204
1998
-
[31]
K., Fukagawa, M., et al
Honda, M., Inoue, A. K., Fukagawa, M., et al. 2009, ApJL, 690, 120
2009
-
[32]
2016, ApJ, 821, 6
Honda, M., Kudo, T., Takatsuki, S., et al. 2016, ApJ, 821, 6
2016
-
[33]
H., Whittet, D
Hough, J. H., Whittet, D. C. B., Sato, S., et al. 1989, MNRAS, 241, 71
1989
-
[34]
Hubickyj, O., Bodenheimer, P., & Lissauer, J. J. 2005, American Geophysical
2005
-
[35]
Union, Fall Meeting 2005, abstract id.P42A
2005
-
[36]
M., Sandford, S
Hudgins, D. M., Sandford, S. A., Allamandola, L. J., & Tielens, A. G. G. M. 1993, ApJS, 86, 713
1993
-
[37]
2017, Proc
Jellema, W., Pastor, C., Naylor, D., et al. 2017, Proc. SPIE10563, 105631K, 10563, 8
2017
-
[38]
Johnson, R. E. 1989, Icarus, 78, 206
1989
-
[39]
1998, ApJ, 505, 897
Jura, M., Malkan, M., White, R., et al. 1998, ApJ, 505, 897
1998
-
[40]
& Jewitt, D
Kalas, P. & Jewitt, D. 1995, AJ, 110, 794
1995
-
[41]
2018, A&A, 617, A1
Kamp, I., Scheepstra, A., Min, M., Klarmann, L., & Riviere-Marichalar, P. 2018, A&A, 617, A1
2018
-
[42]
2003, Proceedings of the 219th sym- posium of the International Astronomical Union, IAUS 219, 80
Kervella, P., Thévenin, F., Morel, P., et al. 2003, Proceedings of the 219th sym- posium of the International Astronomical Union, IAUS 219, 80
2003
-
[43]
Kim, M., Wolf, S., Löhne, T., Kirchschlager, F., & Krivov, A. V . 2018, A&A, 618, 38
2018
-
[44]
& Wolf, S
Kirchschlager, F. & Wolf, S. 2013, A&A, 552, 54
2013
-
[45]
2011, Earth Planets Space, 63, 1067
Kobayashi, H., Kimura, H., Watanabe, S., Yamamoto, T., & Müller, S. 2011, Earth Planets Space, 63, 1067
2011
-
[46]
2010, Earth Planets Space, 62, 57
Kobayashi, H., Kimura, H., Yamamoto, S., Watanabe, S., & Yamamoto, T. 2010, Earth Planets Space, 62, 57
2010
-
[47]
2008, Icarus, 195, 871
Kobayashi, H., Watanabe, S., Kimura, H., & Yamamoto, T. 2008, Icarus, 195, 871
2008
-
[48]
1978, Nature, 330, 550
Kouchi, A. 1978, Nature, 330, 550
1978
-
[49]
V ., & Trieloff, M
Krause, M., Blum, J., Skorov, Y . V ., & Trieloff, M. 2011, Icarus, 214, 286
2011
-
[50]
V ., Löhne, T., & Sremˇcev´c, M
Krivov, A. V ., Löhne, T., & Sremˇcev´c, M. 2006, A&A, 455, 509
2006
-
[51]
V ., Mann, I., & Krivova, N
Krivov, A. V ., Mann, I., & Krivova, N. 2000, A&A, 362, 1127
2000
-
[52]
V ., Müller, S., Löhne, T., & Mutschke, H
Krivov, A. V ., Müller, S., Löhne, T., & Mutschke, H. 2008, ApJ, 687, 608
2008
-
[53]
& Greenberg, J
Li, A. & Greenberg, J. M. 1998, A&A, 331, 291 Löhne, T., Augereau, J.-C., Ertel, S., et al. 2012, ApJ, 537, A110 Löhne, T., Krivov, A. V ., Kirchschlager, F., Sende, J. A., & Wolf, S. 2017, A&A, 605, A7
1998
-
[54]
Malfait, K., Waelkens, C., Bouwman, J., de Koter, A., & Waters, L. B. F. M. 1999, A&A, 345, 181 Maxwell Garnett, J. C. 1904, Philos. Trans. R. Soc. London, Sect. A, 3, 385
1999
-
[55]
K., Espaillat, C., Calvet, N., et al
McClure, M. K., Espaillat, C., Calvet, N., et al. 2015, ApJ, 799, 162
2015
-
[56]
K., Manoj, P., Calvet, N., et al
McClure, M. K., Manoj, P., Calvet, N., et al. 2012, ApJ, 759, L10
2012
-
[57]
1908, Ann
Mie, G. 1908, Ann. Phys., 330, 377
1908
-
[58]
P., Kama, M., & Dominik, C
Min, M., Dullemond, C. P., Kama, M., & Dominik, C. 2011, Icarus, 212, 416
2011
-
[59]
D., & Whalley, E
Mishima, O., Klug, D. D., & Whalley, E. 1983, J. Chem. Phys., 78, 6399
1983
-
[60]
Moerchen, M. M. 2008, Ph. D. thesis in University of Florida
2008
-
[61]
J., et al
Molinari, S., Ceccarelli, C., White, G. J., et al. 1999, ApJL, 521, L71
1999
-
[62]
Y ., Bryden, G., Werner, M
Morales, F. Y ., Bryden, G., Werner, M. W., & Stapelfeldt, K. R. 2016, ApJ, 831, 97
2016
-
[63]
I., et al
Morbidelli, A., Chambers, J., Lunine, J. I., et al. 2000, Meteorit. Planet. Sci., 35, 1309
2000
-
[64]
W., Kenyon, S
Nagasawa, M., Thommes, E. W., Kenyon, S. J., Bromley, B. C., & Lin, D. N. C. 2007, Protostars & Planets V , 639
2007
-
[65]
K., Nakamoto, T., & Honda, M
Oka, A., Inoue, A. K., Nakamoto, T., & Honda, M. 2012, ApJ, 747, 138
2012
-
[66]
H., Forveille, T., et al
Omont, A., Moseley, S. H., Forveille, T., et al. 1990, ApJ, 355, L27
1990
-
[67]
1991, A&A, 251, 210
Ossenkopf, V . 1991, A&A, 251, 210
1991
-
[68]
O., & Artymowicz, P
Pantin, E., Lagage, P. O., & Artymowicz, P. 1997, A&A, 327, 1123
1997
-
[69]
& Krivov, A
Pawellek, N. & Krivov, A. V . 2015, MNRAS, 454, 3207
2015
-
[70]
D., Duchene, G., Graham, J
Perrin, M. D., Duchene, G., Graham, J. R., et al. 2009, AIP Conference Proceed- ings
2009
-
[71]
Plavchan, P., Jura, M., & Lipscy, S. J. 2005, ApJ, 631, 1161
2005
-
[72]
M., Dullemond, C
Pontoppidan, K. M., Dullemond, C. P., van Dishoeck, E. F., et al. 2005, ApJ, 622, 463
2005
-
[73]
2019, ApJ, 880, 12
Potapov, A., Jäger, C., & Henning, T. 2019, ApJ, 880, 12
2019
-
[74]
Poynting, J. H. 1904, Philosophical Transactions of the Royal Society of London, Series A, 525
1904
-
[75]
N., Quinn, T
Raymond, S. N., Quinn, T. R., & Lunine, J. I. 2004, Icarus, 168, 1
2004
-
[76]
V ., Löhne, T., & Mohr, P
Reinert, C., Mutschke, H., Krivov, A. V ., Löhne, T., & Mohr, P. 2015, ApJ, 573, 29
2015
-
[77]
Robertson, H. P. 1937, MNRAS, 97, 423
1937
-
[78]
G., & Hyland, A
Robinson, G., Smith, R. G., & Hyland, A. R. 1992, MNRAS, 256, 437
1992
-
[79]
R., Shibai, H., Armus, L., et al
Roelfsema, P. R., Shibai, H., Armus, L., et al. 2018, Publications of the Astro- nomical Society of Australia, 35, 17
2018
-
[80]
Schegerer, A. A. & Wolf, S. 2010, A&A, 517, A87
2010
-
[81]
Smith, B. A. & Terrile, R. J. 1984, Science, 226, 1421
1984
-
[82]
G., Robinson, G., Hyland, A
Smith, R. G., Robinson, G., Hyland, A. R., & Carpenter, G. L. 1994, MNRAS, 271, 481
1994
-
[83]
Stevenson, D. J. 1982, Planet. Space Sci., 30, 755
1982
-
[84]
Strubbe, L. E. & Chiang, E. I. 2006, ApJ, 648, 652 STScI. 2017, Space Telescope Science Institute Article, JWST User Documen- tation, Baltimore, MD, Updated July 13, 2017
2006
-
[85]
& Pearson, C
Swinyard, B. & Pearson, C. 2017, Publications of The Korean Astronomical Society, 32, 337
2017
-
[86]
T., Kobayashi, N., et al
Terada, H., Tokunaga, A. T., Kobayashi, N., et al. 2007, ApJ, 667, 303 Thébault, P. & Augereau, J.-C. 2007, A&A, 472, 169 Thébault, P., Augereau, J.-C., & Beust, H. 2003, A&A, 408, 775
2007
-
[87]
2006, in Planet Formation: Theory, Observa- tions, and Experiments, ed
Thommes, E.W.and Duncan, M. 2006, in Planet Formation: Theory, Observa- tions, and Experiments, ed. H. Klahr and W. Brander (Cambridge: Cambridge University Press)., 129
2006
-
[88]
Warren, S. G. 1984, Appl. Opt., 23, 1206
1984
-
[89]
W., & Tielens,
Whittet, D., Schtte, . W., & Tielens, . A. 1996, A&A, 315, L357
1996
-
[90]
] 5 0 5 ∆ δ [
Wolf, S. & V oshchinnikov, N. V . 2004, Computer Physics Communications, 162, 113 Article number, page 13 of 17 A&A proofs: manuscript no. Constraining_the_detectability_of_water_ice_in_debris_disks_2c Appendix A: We present simulated observations of spatially resolved disks c...
2004
Reviewed August 14, 2026 · model on record in the stance chip above.
Discussion (0). Continue with ORCID to comment.