REVIEW 3 major objections 7 minor 50 references
Delineating Knowledge Domains in the Scientific Literature Using Visual Information
T0 review · 3 major / 7 minor · reviewed 2026-08-14 · deepseek-v4-flash
Pith's one-line read The paper argues that scientific figures can differentiate communities of practice as effectively as text or citation patterns, establishing a third measurable channel for mapping knowledge domains.
desk verdict First large-scale attempt to delineate scientific fields from figures, but the headline correlation is fitted to the benchmark and the leading-indicator claim is speculative. read the letter →
The pith
A machine-rendered reading of the paper's core claim, the machinery that carries it, and where it could break.
The reading
What carries the argument
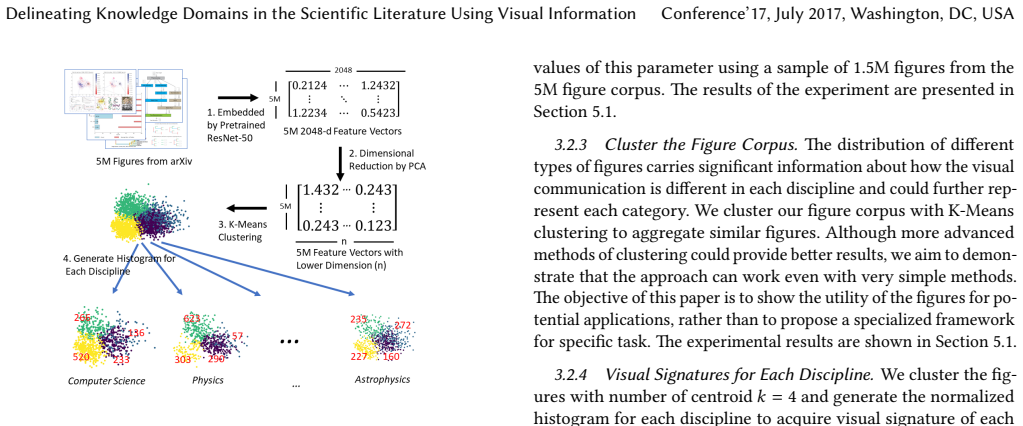
The central object is the visual signature: a normalized histogram over k = 4 clusters formed from PCA-reduced feature vectors of all figures in a field, where the features come from a pre-trained ResNet-50. The four clusters turn out to be dominated by diagrams, tables, plots, and photos, so the signature summarizes a discipline's visual output as a small probability distribution over figure types. Euclidean distance between signatures supplies the visual distance, and the Mantel test [32], a standard test of correlation between distance matrices, compares the resulting distance matrix against citation and jargon distance matrices. The same feature-extractor and cluster machinery, plus a classifier for two specific figure types, lets the authors track how neural-network diagrams and embedding visualizations propagate through computer science over time.
What would settle it
Re-run the pipeline on a held-out slice of the figure corpus (fields or years not used in tuning), fix the PCA dimension and cluster count before looking at citation distances, and compute the visual–citation correlation; if it collapses toward zero while the text and citation measures stay stable, the reported r = 0.706 reflects overfitting rather than a stable visual signal.
Extended reading notes
Core claim
The paper's central claim is that a field's visual style is a reliable marker of its intellectual territory, comparable in power to its jargon or its citation links. The authors encode 5,009,523 figures from 1,343,669 preprints with a pre-trained ResNet-50 [18], reduce the resulting vectors with PCA, cluster the corpus into four visual types, and form a normalized histogram per discipline. Euclidean distance between these "visual signatures" correlates with average shortest citation path at r = 0.706 (p = 0.0001) and with jargon distance at r = 0.531 (p = 0.0002); the visual–citation correlation is slightly higher than the jargon–citation correlation (r = 0.697). The disagreements are interpretable: Computation and Language is citation-close to other computer-science fields but visually distinct because of its table-heavy figures. The case study of neural network and embedding diagrams shows figure usage rising sharply around 2015, about two years before citation counts to influential deep-learning papers surge, which the authors read as evidence that figures are leading indicators of genuine concept adoption.
Load-bearing premise
The load-bearing premise is that image features trained on natural photographs group scientific figures into meaningful visual types, and that the PCA dimension and cluster count, which were chosen to maximize agreement with the citation benchmark, are not overfitting that benchmark; if either fails, the visual signatures are noise and the reported correlations could be spurious.
Editorial extensions
If this is right
- Visual distance can be used as a standalone similarity measure for clustering and delineating scientific fields, with accuracy comparable to citation- and text-based measures.
- Where visual distance and citation distance disagree, the gap identifies fields with distinct visual cultures, such as Computation and Language's reliance on comparison tables, giving science mapping a new axis of analysis.
- Figure-type classifiers can track adoption of specific methods, and the presence of a method-specific figure is a better marker of genuine integration than merely mentioning the method or citing a key paper.
- Figure usage leads citation counts by roughly two years in the deep-learning case, so visual signals could serve as early indicators of where a field is heading.
- The method transfers to other visual corpora such as patents, web pages, and news, where similar visual-domain structure may exist.
Reading between the lines
- Because producing a method-specific figure is costlier than adding a keyword or citation, visual signals may be a more conservative measure of true adoption; the paper's observed lead over citations is consistent with that interpretation, though the paper does not directly test the cost mechanism.
- The fact that k = 4 clusters sufficed suggests the scientific literature may draw on only a handful of visual genres, which would make visual signatures a cheap feature for large-scale bibliometric pipelines.
- A direct extension would be to plug visual signatures into a recommendation system and compare recommendation quality against text-only and citation-only recommenders; the paper motivates this but does not build it.
- The same classifier approach could map the spread of other visual conventions, such as phylogenetic trees, loss-curve panels, or t-SNE plots, to reveal how visualization practices themselves diffuse between communities.
Signed reviews
Editorial analysis
A structured set of objections, weighed in public.
Referee Report
Summary. The paper proposes a method for delineating scientific knowledge domains from the visual content of figures in the arXiv literature. Figures are embedded with a pretrained ResNet-50, projected with PCA, and clustered with K-means; each arXiv category is then represented by a histogram of cluster memberships, and pairwise Euclidean distances between these histograms are compared with citation-based and jargon-based distance matrices using Mantel tests. The main quantitative result is a correlation of r=0.706 between visual and citation distance, which the authors interpret as evidence that figures are as effective as text or citations for distinguishing communities of practice. The paper also analyzes disagreement between visual and citation distance (e.g., Computation and Language), and presents a case study in which the prevalence of neural-network diagrams grows before the citation counts of influential deep-learning papers, suggesting that visual signals may be leading indicators of idea adoption.
Significance. If the core claim held, this would be a meaningful contribution to the science-of-science literature by adding a third measurable communication channel, with potential applications in classification, recommendation, and studies of scientific information flow. The paper's strengths include the scale of the corpus (over 5 million figures), a transparent and simple pipeline, and the explicit comparison against established textual and citation baselines. However, the central quantitative claim is currently weakened by a circular evaluation loop: the free parameters (PCA dimension and number of clusters) are selected by maximizing the correlation with the very same citation-distance benchmark that is later reported as validation. The average correlation across the parameter grid is 0.66-0.67, which falls below the jargon-citation correlation of 0.697, so the headline conclusion is fragile without out-of-sample evaluation.
major comments (3)
- [Section 5.1 and Table 3] The reported headline correlation r=0.706 between visual and citation distance is not an honest out-of-sample estimate. Section 5.1 and Table 2 describe selecting both the PCA dimension and the number of clusters k by maximizing the Mantel correlation with citation distance (e.g., 'Maximum correlation occurred at k = 4'), and the same citation-distance matrix is then used as the evaluation benchmark in Table 3. This creates a circular loop in which the benchmark is used both for tuning and for validation. The average correlations across k=2..30 in Table 2 are 0.66-0.67 for the higher dimensions, which is actually below the jargon-citation correlation of 0.697 reported in Table 3. Without cross-validation, a held-out benchmark, or a nested selection procedure, the claim that visual distance is 'as effective' as text or citations is not established.
- [Section 5.5 and Figure 9] The H3 leading-indicator claim is supported only by a visual comparison of unnormalized time series. The top chart shows the raw count of papers containing neural-network diagrams in four arXiv categories, while the bottom chart shows the citation counts of six selected influential papers. These are not comparable quantities: the figure count is not normalized by the total number of papers published in those categories per year, and the citation counts belong to only a handful of papers rather than to the field as a whole. The observed increase in figure usage could therefore reflect the overall growth of deep learning submissions or of arXiv itself. No formal lead-lag test, such as Granger causality or cross-correlation with a proper normalization, is performed. The conclusion in Section 6 that 'figures in the scientific literature are leading indicators of citations' is consequently not supported by the evidence presented.
- [Section 3.2.1] The method depends on the assumption that ImageNet-pretrained ResNet-50 features transfer to scientific figures, an assumption the paper states but does not quantitatively validate. Section 3.2.1 argues that early layers identify 'simple patterns that are sufficiently general' for artificial images as well, but this remains an assertion. The later cluster analysis (Section 5.3) shows that clusters are dominated by broad figure types (diagram, table, plot, photo), which provides indirect, post hoc support. However, because the entire visual-signature construction rests on this transfer, the paper should offer a direct validation, for example by measuring cluster agreement against human labels on a sample of scientific figures, or by showing that the figure-type classifier performance on scientific figures is acceptable. Without such a check, the risk remains that the visual signatures capture artifacts of natural-image features rather than meaningful scientific visual communication.
minor comments (7)
- [Section 5.1 vs Table 3] There is an unexplained discrepancy between Table 2 and Table 3: Table 2 reports maximum correlations of 0.793 at dimension 256/320 with k=4, while Table 3 reports r=0.706 for the visual-citation comparison. The authors should explain how the final pipeline differs from the parameter-search experiments, or why the reported result is lower than the maximum.
- [Table 3] The Mantel test p-values are reported as 0.0001 and 0.0002, but the number of permutations used to obtain these p-values is not stated. Please specify the permutation procedure and the number of randomizations.
- [Section 5.5] The precision and recall values (0.741 and 0.827) are reported only for neural-network diagrams; please provide the per-class precision, recall, and F1 for the embedding-visualization class as well, since both classes are used in the subsequent time-series analysis.
- [Figure 9] The three line charts in Figure 9 have different y-axis scales and are not normalized by field size, making the visual comparison of trends potentially misleading. At minimum, the authors should discuss this limitation; ideally, they should normalize the figure count and the citation counts by the number of papers in each category per year.
- [Throughout] The manuscript contains multiple OCR artifacts and typos (e.g., 'bibilometrics' in the introduction, 'Sea/t_tle' in the affiliation block, 'pa/t_terns' in several places), and the ACM template still carries placeholder metadata ('Conference’17', 'DOI: 475/123'). The authors should proofread the PDF and ensure the final version is clean.
- [Table 1 and Section 3.3] Table 1 lists only the final learning rate, decay, epochs, batch size, and loss, but the text says the authors tuned depth, layer dimensions, and dropout. Please report the search space or at least the range of values considered for each hyperparameter.
- [Sections 3.2.2-3.2.4] It is unclear whether the full 5-million-figure corpus or only the 1.5M-figure sample from the parameter experiment is used for the final clustering and signature construction. Please clarify the exact data flow used to produce the results in Tables 2 and 3.
Circularity Check
The paper tunes PCA dimension and cluster count k on the citation-distance benchmark, then reports the resulting Mantel correlation with that same benchmark as evidence that visual distance is as effective as text or citations; no cross-validation or nested selection is reported.
-
fitted input called prediction
[Section 3.2.2, Section 3.2.4, Section 5.1 (Table 2), and Section 5.2 (Table 3)]
"but in our evaluation the higher values (200+) produced stronger correlations with other methods of delineating fields. ... We evaluate our method by conducting the Mantel test to compare the correlation between visual distance and citation distance. ... Maximum correlation to citation distance shows the maximum correlation of the specified dimension among different options of number of centroid k. ... The maximum correlation occurred at k = 4 in most of the experiments."
The free parameters of the visual pipeline (PCA dimension and cluster count k=4) are chosen by maximizing the Mantel correlation between visual distance and citation distance on the same benchmark used for evaluation. The paper then reports that visual-citation correlation (r = 0.706, Table 3) as headline evidence that figures are as effective as text or citations. Because the benchmark was used both to select parameters and to validate the result, part of the reported correlation is a selected value rather than an out-of-sample finding; the p-value and the comparison with the untuned jargon-distance baseline (r = 0.697) do not account for this selection. This is a fitted value presented as an independent validation.
full rationale
The visual signature itself is not defined in terms of citation distance: signatures are built from ResNet-50 feature vectors, PCA, and K-means histograms, with no citation information entering the vectors. The central circularity is statistical rather than definitional: Section 5.1 explicitly uses correlation with citation distance to choose both hyperparameters, and Section 5.2 uses correlation with the same citation distance to claim validity. This makes the headline comparison to the untuned jargon-distance baseline biased. I did not count the paper's self-citations (Lee et al. [28,29] and Vilhena et al. [43], which includes an author of this paper) as load-bearing: the figure-composition and jargon/citation comparators are existing published methods with independent content. The figure-type case study (neural-network and embedding diagrams) is also independent of the hyperparameter-tuning loop. Because the central claim is supported by a benchmark-selected correlation, a moderate circularity score of 6 is appropriate rather than a higher score, since the pipeline has independent content and the failure mode is selection on the evaluation benchmark, not equivalence by construction.
Assumptions & free parameters
free parameters (4)
- Number of PCA dimensions =
256 or 320 (chosen from {16, 32, 64, 128, 256, 320})
- Number of K-means clusters k =
4 (chosen from {2..30})
- DNN classifier hyperparameters (learning rate, decay, epochs, batch size, architecture) =
lr=0.001, decay=0.001, epochs=150, batch=256, architecture in Fig. 3
- Number of NMF topics for caption modeling =
5
assumptions (6)
- domain assumption ResNet-50 pretrained on ImageNet provides meaningful features for scientific figures.
- domain assumption The figure corpus extracted from arXiv is correctly attributed to fields and is representative of each discipline.
- domain assumption The ADS citation graph provides a reliable benchmark for field similarity.
- domain assumption The jargon distance of Vilhena et al., computed on unigrams from abstracts, is a valid text-based measure of field similarity.
- domain assumption Euclidean distance between normalized histograms (visual signatures) is a meaningful measure of visual similarity between fields.
- domain assumption The 10,651 labeled figures are representative and correctly labeled for training the figure-type classifier.
Cite this review
Pith. "Pith review of Delineating Knowledge Domains in the Scientific Literature Using Visual Information." pith.science (2026). https://pith.science/paper/E3P6Y4EK
@misc{pith2026190807465,
  author       = {Pith},
  title        = {Pith review of: Delineating Knowledge Domains in the Scientific Literature Using Visual Information},
  year         = {2026},
  howpublished = {\url{https://pith.science/paper/E3P6Y4EK}},
  note         = {Machine review of arXiv:1908.07465}
}
read the original abstract
Figures are an important channel for scientific communication, used to express complex ideas, models and data in ways that words cannot. However, this visual information is mostly ignored in analyses of the scientific literature. In this paper, we demonstrate the utility of using scientific figures as markers of knowledge domains in science, which can be used for classification, recommender systems, and studies of scientific information exchange. We encode sets of images into a visual signature, then use distances between these signatures to understand how patterns of visual communication compare with patterns of jargon and citation structures. We find that figures can be as effective for differentiating communities of practice as text or citation patterns. We then consider where these metrics disagree to understand how different disciplines use visualization to express ideas. Finally, we further consider how specific figure types propagate through the literature, suggesting a new mechanism for understanding the flow of ideas apart from conventional channels of text and citations. Our ultimate aim is to better leverage these information-dense objects to improve scientific communication across disciplinary boundaries.
Figures


Figures from the paper (4 more)


Reference graph
Works this paper leans on
-
[1]
Alberto Accomazzi, Gunther Eichhorn, Michael J Kurtz, Carolyn S Grant, Ed- win Henneken, Markus Demleitner, Donna /T_hompson, Elizabeth Bohlen, and Stephen S Murray. 2006. Creation and Use of Citations in the ADS.arXiv preprint cs/0610011 (2006)
work page Pith review arXiv 2006
-
[2]
Bram van den Akker, Ilya Markov, and Maarten de Rijke. 2019. ViTOR: Learning to Rank Webpages Based on Visual Features. arXiv preprint arXiv:1903.02939 (2019)
work page Pith review arXiv 2019
-
[3]
Rabah A Al-Zaidy and C Lee Giles. 2015. Automatic extraction of data from bar charts. In K-CAP. ACM, 30
work page 2015
-
[4]
Richard E Bellman. 1961. Adaptive control processes: a guided tour . Vol. 2045. Princeton university press
work page 1961
-
[5]
Stefano Boccale/t_ti, Vito Latora, Yamir Moreno, Martin Chavez, and D-U Hwang
-
[6]
Jean Charbonnier, Lucia Sohmen, John Rothman, Birte Rohden, and Christian Wartena. 2018. NOA: A Search Engine for Reusable Scienti/f_ic Images Beyond the Life Sciences. In ECIR. Springer, 797–800
work page 2018
-
[7]
Zhe Chen, Michael Cafarella, and Eytan Adar. 2015. Diagram/f_lyer: A search engine for data-driven diagrams. In /T_he Web Conference. ACM, 183–186
work page 2015
-
[8]
Jia Deng, Wei Dong, Richard Socher, Li-Jia Li, Kai Li, and Li Fei-Fei. 2009. Ima- genet: A large-scale hierarchical image database. In CVPR. Ieee, 248–255
work page 2009
Show all 50 references
-
[9]
Yuxiao Dong, Hao Ma, Zhihong Shen, and Kuansan Wang. 2017. A Century of Science: Globalization of Scienti/f_ic Collaborations, Citations, and Innovations. In KDD. ACM, 1437–1446
2017
-
[10]
Stuart E Dreyfus. 1969. An appraisal of some shortest-path algorithms.Operations research 17, 3 (1969), 395–412
1969
-
[11]
Guenther Eichhorn. 1994. An overview of the astrophysics data system. Experi- mental Astronomy 5, 3-4 (1994), 205–220
1994
-
[12]
Stephanie Elzer, Sandra Carberry, and Ingrid Zukerman. 2011. /T_he automated understanding of simple bar charts. Arti/f_icial Intelligence175, 2 (2011), 526–555
2011
-
[13]
Jing Fang, Prasenjit Mitra, Zhi Tang, and C Lee Giles. 2012. Table Header Detection and Classi/f_ication.. InAAAI. 599–605
2012
-
[14]
Santo Fortunato, Carl T Bergstrom, Katy B¨orner, James A Evans, Dirk Helbing, Staˇsa Milojevi´c, Alexander M Petersen, Filippo Radicchi, Roberta Sinatra, Brian Uzzi, et al. 2018. Science of science. Science 359, 6379 (2018), eaao0185
2018
-
[15]
Robert P Futrelle, Mingyan Shao, Chris Cieslik, and Andrea Elaina Grimes. 2003. Extraction, layout analysis and classi/f_ication of diagrams in PDF documents. In ICDAR. IEEE, 1007–1013
2003
-
[16]
Eugene Gar/f_ield. 2006. /T_he history and meaning of the journal impact factor. Jama 295, 1 (2006), 90–93
2006
-
[17]
Ian Goodfellow, Jean Pouget-Abadie, Mehdi Mirza, Bing Xu, David Warde-Farley, Sherjil Ozair, Aaron Courville, and Yoshua Bengio. 2014. Generative adversarial nets. In Advances in neural information processing systems . 2672–2680
2014
-
[18]
Kaiming He, Xiangyu Zhang, Shaoqing Ren, and Jian Sun. 2016. Deep residual learning for image recognition. In CVPR. 770–778
2016
-
[19]
Sepp Hochreiter and J¨urgen Schmidhuber. 1997. Long short-term memory.Neural computation 9, 8 (1997), 1735–1780
1997
-
[20]
Wenyi Huang, Zhaohui Wu, Prasenjit Mitra, and C Lee Giles. 2014. Refseer: A citation recommendation system. In JCDL. IEEE Press, 371–374
2014
-
[21]
J.D. West, I. Wesley-Smith, and C.T. Bergstrom. 2016. A recommendation system based on hierarchical clustering of an article-level citation network. IEEE Trans- actions on Big Data 2, 2 (June 2016), 113–123. h/t_tps://doi.org/10.1109/TBDATA. 2016.2541167
2016
-
[22]
Aniruddha Kembhavi, Mike Salvato, Eric Kolve, Minjoon Seo, Hannaneh Ha- jishirzi, and Ali Farhadi. 2016. A diagram is worth a dozen images. In ECCV. Springer, 235–251
2016
-
[23]
Alex Krizhevsky, Ilya Sutskever, and Geoffrey E Hinton. 2012. Imagenet classi/f_ica- tion with deep convolutional neural networks. In Advances in neural information processing systems. 1097–1105
2012
-
[24]
Onur K¨uc ¸¨uktunc ¸, Erik Saule, Kamer Kaya, and¨Umit VC ¸ataly¨urek. 2012. Direction awareness in citation recommendation. (2012)
2012
-
[25]
Michael J Kurtz and Edwin A Henneken. 2017. Measuring metrics-a 40-year longitudinal cross-validation of citations, downloads, and peer review in astro- physics. Journal of the Association for Information Science and Technology 68, 3 (2017), 695–708
2017
-
[26]
Daniel D Lee and H Sebastian Seung. 1999. Learning the parts of objects by non-negative matrix factorization. Nature 401, 6755 (1999), 788
1999
-
[27]
Poshen Lee, Jevin West, and Bill Howe. 2016. VizioMetrix: A Platform for Analyzing the Visual Information in Big Scholarly Data. In /T_he Web Conference Workshop on BigScholar
2016
-
[28]
Poshen Lee, Jevin West, and Bill Howe. 2017. Viziometrics: Analyzing Visual Pa/t_terns in the Scienti/f_ic Literature.IEEE Transactions on Big Data (2017)
2017
-
[29]
Sean Yang, Jevin West, and Bill Howe
Poshen Lee, T. Sean Yang, Jevin West, and Bill Howe. 2017. PhyloParser: A Hybrid Algorithm for ExtractingPhylogenies from Dendrograms. (2017)
2017
-
[30]
Loet Leydesdorff and Ping Zhou. 2007. Nanotechnology as a /f_ield of science: Its delineation in terms of journals and patents.Scientometrics 70, 3 (2007), 693–713
2007
-
[31]
Xiaonan Lu, J Wang, Prasenjit Mitra, and C Lee Giles. 2007. Automatic extraction of data from 2-d plots in documents. In ICDAR, Vol. 1. IEEE, 188–192
2007
-
[32]
Nathan Mantel. 1967. /T_he detection of disease clustering and a generalized regression approach. Cancer research 27, 2 Part 1 (1967), 209–220
1967
-
[33]
IV Marshakova. 1973. Co-Citation in Scienti/f_ic Literature: A New Measure of the Relationship Between Publications. ”.Scienti/f_ic and Technical Information Serial of VINITI 6 (1973), 3–8
1973
-
[34]
Tomas Mikolov, Ilya Sutskever, Kai Chen, Greg S Corrado, and Jeff Dean. 2013. Distributed representations of words and phrases and their compositionality. In Advances in neural information processing systems . 3111–3119
2013
-
[35]
Douglas L Nelson, Valerie S Reed, and John R Walling. 1976. Pictorial superiority effect. Journal of Experimental Psychology: Human Learning and Memory 2, 5 (1976), 523
1976
-
[36]
F James Rohlf and David R Fisher. 1968. Tests for hierarchical structure in random data sets. Systematic Biology 17, 4 (1968), 407–412
1968
-
[37]
David E Rumelhart, Geoffrey E Hinton, and Ronald J Williams. 1986. Learning representations by back-propagating errors. Nature 323, 6088 (1986), 533
1986
-
[38]
Akshay Sethi, Anush Sankaran, Naveen Panwar, Shreya Khare, and Senthil Mani
-
[39]
Mingyan Shao and Robert P Futrelle. 2005. Recognition and classi/f_ication of /f_igures in PDF documents. InInternational Workshop on Graphics Recognition . Springer, 231–242
2005
-
[40]
Noah Siegel, Zachary Horvitz, Roie Levin, Santosh Divvala, and Ali Farhadi
-
[41]
Karen Simonyan and Andrew Zisserman. 2014. Very deep convolutional net- works for large-scale image recognition. arXiv preprint arXiv:1409.1556 (2014)
2014 arXiv
-
[42]
Trevor Strohman, W Bruce Cro/f_t, and David Jensen. 2007. Recommending citations for academic papers. In SIGIR. ACM, 705–706
2007
-
[43]
Vilhena, J
D. Vilhena, J. Foster, M. Rosvall, J.D. West, J. Evans, and C. Bergstrom. 2014. Finding Cultural Holes: How Structure and Culture Diverge in Networks of Scholarly Communication. Sociological Science 1 (2014), 221–238. h/t_tps://doi. org/10.15195/v1.a15
2014 doi
-
[44]
Colin Ware. 2012. Information visualization: perception for design . Elsevier
2012
-
[45]
West and J
J.D. West and J. Portenoy. 2016. Delineating Fields Using Mathematical Jargon. In JCDL Workshop on BIRNDL
2016
-
[46]
Sean Yang, Kuan-Hao Huang, and BIll Howe. 2019. MultiDEC: Multi-Modal Clustering of Image-Caption Pairs. arXiv preprint arXiv:1901.01860 (2019)
2019 arXiv
-
[47]
Michel Zi/t_t and Elise Bassecoulard. 2006. Delineating complex scienti/f_ic /f_ields by an hybrid lexical-citation method: An application to nanosciences. Information processing & management 42, 6 (2006), 1513–1531
2006
-
[2006]
Physics reports 424, 4-5 (2006), 175–308
Complex networks: Structure and dynamics. Physics reports 424, 4-5 (2006), 175–308
2006
-
[2016]
FigureSeer: Parsing result-/f_igures in research papers. InECCV. Springer, 664–680
-
[2018]
Yang, Po-shen Lee, Jevin D
DLPaper2Code: Auto-generation of code from deep learning research Conference’17, July 2017, Washington, DC, USA Sean T. Yang, Po-shen Lee, Jevin D. West, and Bill Howe papers. In AAAI
2017
Reviewed August 14, 2026 · model on record in the stance chip above.
Discussion (0). Continue with ORCID to comment.