REVIEW 36 references
Remote sensing colour image semantic segmentation of trails created by large herbivorous Mammals
T0 review · reviewed 2026-08-16 · deepseek-v4-flash
Pith's one-line read On a new 100-image dataset of Spanish mountain pastures, U-Net plus MambaOut outperformed 69 other segmentation model-encoder pairs at pixel-level mapping of grazing trails.
desk verdict New dataset and broad benchmark for pixel-level grazing-trail segmentation, but the ground-truth section as written cannot produce the reported masks and model selection uses the same folds; worth peer review after major revision. read the letter →
The pith
A machine-rendered reading of the paper's core claim, the machinery that carries it, and where it could break.
The reading
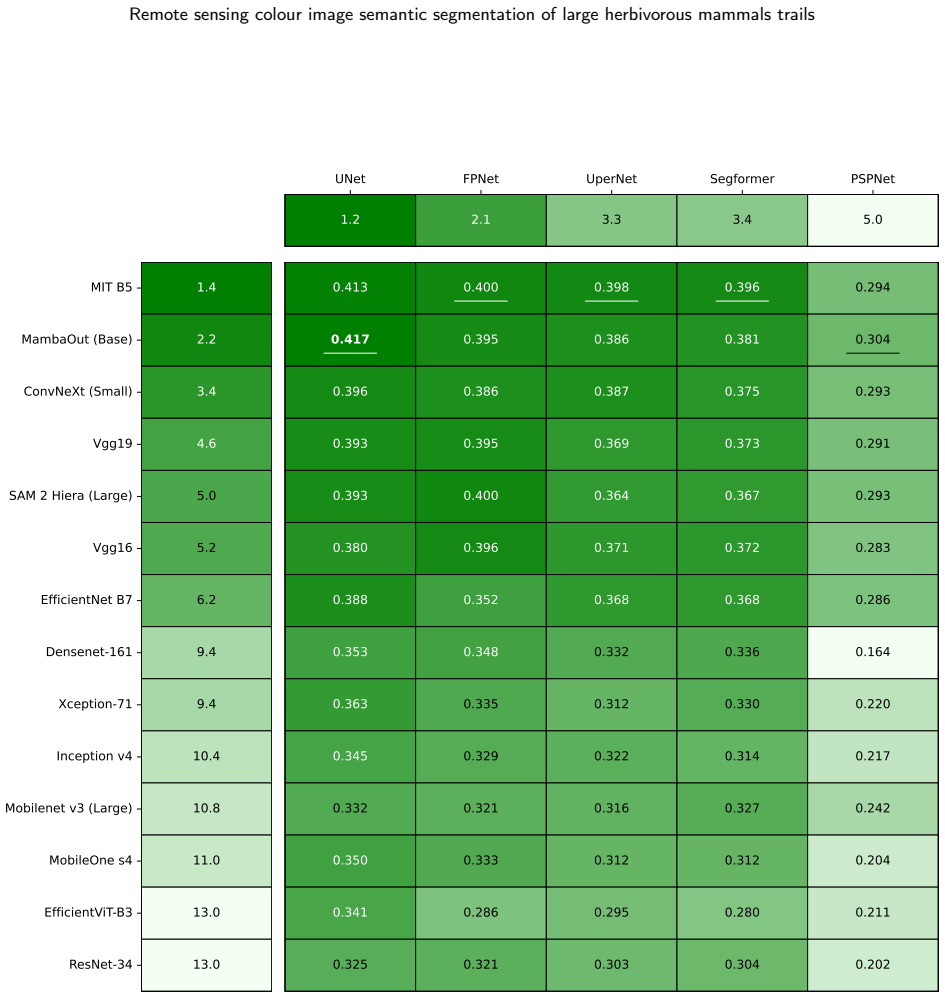
The authors collected 100 aerial images of five Spanish mountain ranges. An expert ecologist hand-drew the centerline of every visible trail in each image, and those drawings were converted into soft target masks. Then they trained 70 combinations: five segmentation architectures, namely U-Net, FPNet, UperNet, Segformer, and PSPNet, each with fourteen pretrained encoder networks. Every combination was evaluated with 10-fold cross-validation. The best average Intersection over Union was about 0.42, achieved by U-Net with the MambaOut encoder; the same pair also had the best F1 score at about 0.58. The authors report that the model generally distinguished trails from dirt roads and other linear features.
The result is a benchmark more than a validation. The ground truth comes from a single expert's interpretation, so the scores measure agreement with that one person's labels. There is no comparison against the earlier patch-level method, no final test set held out after model selection, and no standard deviations reported for the scores. The dataset and code are promised on public repositories, but the paper does not give a commit hash or training hyperparameters. So the practical claim, that this can become a monitoring tool, rests on further independent evaluation.
Extended reading notes
Core claim
The paper's central claim is that semantic segmentation can map grazing trails at pixel level, and specifically that "The UNet architecture with the MambaOut encoder achieved the highest overall performance across combinations of architectures and encoders" (Section 3), with mean IoU of about 0.417 and F1 of about 0.582. The abstract adds that this is "the first instance of achieving competitive image segmentation performance for the detection and precise outlining of large herbivore trail systems." If these claims are correct, a U-Net model with a MambaOut encoder trained on expert-labeled aerial images can outline grazing trails as continuous pixel maps, advancing beyond patch-level presence detection.
Load-bearing premise
The load-bearing premise is that the ground-truth masks are valid. A single expert visually identified every trail from Google Earth Pro orthoimages and drew centerlines in ImageJ (Section 2.2), and the masks were then smoothed with a hand-chosen sigma of 16. There is no field survey, no second annotator, and no quantitative labeling protocol. All IoU and F1 scores, and therefore the ranking of models, measure agreement with this one subjective interpretation. If the labels misrepresent actual trails, the benchmark's conclusions do not transfer to real monitoring applications.
Signed reviews
Editorial analysis
A structured set of objections, weighed in public.
Assumptions & free parameters
free parameters (4)
- sigma (ground-truth smoothing) =
16
- Th (HSI label threshold) =
3
- Image downscale factor =
8
- ROPE width for Bayesian tests =
0.01
assumptions (5)
- domain assumption Single-expert visual identification of trails from Google Earth Pro orthoimages is an adequate ground truth.
- domain assumption The yellow-pencil centerlines and HSI threshold procedure faithfully represent trail locations.
- domain assumption The Gaussian distance transform with sigma equal to 16 represents true trail extent.
- domain assumption ImageNet-pretrained encoders transfer to aerial grazing-trail segmentation.
- domain assumption Google Earth Pro orthoimages are geometrically and radiometrically adequate for trail delineation.
Cite this review
Pith. "Pith review of Remote sensing colour image semantic segmentation of trails created by large herbivorous Mammals." pith.science (2026). https://pith.science/paper/E67X6YHJ
@misc{pith2026250412121,
  author       = {Pith},
  title        = {Pith review of: Remote sensing colour image semantic segmentation of trails created by large herbivorous Mammals},
  year         = {2026},
  howpublished = {\url{https://pith.science/paper/E67X6YHJ}},
  note         = {Machine review of arXiv:2504.12121}
}
read the original abstract
Identifying spatial regions where biodiversity is threatened is crucial for effective ecosystem conservation and monitoring. In this stydy, we assessed varios machine learning methods to detect grazing trails automatically. We tested five semantic segmentation models combined with 14 different encoder networks. The best combination was UNet with MambaOut encoder. The solution proposed could be used as the basis for tools aiming at mapping and tracking changes in grazing trails on a continuous temporal basis.
Figures


Figures from the paper (3 more)


Reference graph
Works this paper leans on
-
[1]
Bailly,J.S.,Levavasseur,F.,2012. Potentialoflinearfeaturesdetectioninamediterraneanlandscapefrom3dvhropticaldata: Applicationtoterrace walls, in: 2012 IEEE International Geoscience and Remote Sensing Symposium, pp. 7110–7113. doi:10.1109/IGARSS.2012.6352024. Benavoli,A.,Corani,G.,Demšar,J.,Zaffalon,M.,2017. Timeforachange: atutorialforcomparingmultiplecla...
-
[7]
Hao, S.,Zhou, Y., Guo,Y., 2020a
doi:10.1007/s13735-017-0141-z. Hao, S.,Zhou, Y., Guo,Y., 2020a. Abriefsurveyonsemanticsegmentationwithdeeplearning. Neurocomputing406, 302–321. doi: 10.1016/j. neucom.2019.11.118. Hao, S., Zhou, Y., Guo, Y., 2020b. A brief survey on semantic segmentation with deep learning. Neurocomputing 406, 302–321. doi:https: //doi.org/10.1016/j.neucom.2019.11.118. J....
-
[10]
Earth Surface Processes and Landforms 45, 3368–3380
Detection of terracettes in semi-arid rangelands using fourier-based image anal- ysis of very-high-resolution satellite imagery. Earth Surface Processes and Landforms 45, 3368–3380. doi: 10.1002/esp.4971, arXiv:https://onlinelibrary.wiley.com/doi/pdf/10.1002/esp.4971. Higgins, C.G.,
-
[12]
Zhao, H., Shi, J., Qi, X., Wang, X., Jia, J.,
doi:10.3390/rs12020221. Zhao, H., Shi, J., Qi, X., Wang, X., Jia, J.,
-
[14]
Sustainable Cities and Society 79, 103630
Citysurfaces: City-scale semantic segmentation of sidewalk materials. Sustainable Cities and Society 79, 103630. doi:10.1016/j.scs.2021.103630. Howard,A.,Sandler,M.,Chu,G.,Chen,L.C.,Chen,B.,Tan,M.,Wang,W.,Zhu,Y.,Pang,R.,Vasudevan,V.,Le,Q.V.,Adam,H.,2019. Searching for mobilenetv3. URL:https://arxiv.org/abs/1905.02244, arXiv:1905.02244. Huang, G., Liu, Z.,...
arXiv 2021
- [15]
-
[16]
Mathematical Models in Engineering 4, 112–137
Automatic semantic segmentation and classification of remote sensing data for agriculture. Mathematical Models in Engineering 4, 112–137. doi:10.21595/mme.2018.19840. Jamali, A., Roy, S.K., Li, J., Ghamisi, P.,
-
[17]
Multi-parallel structure and a generalized conceptual model of livestock track network. CATENA 216, 106380. URL: https://www.sciencedirect.com/science/article/pii/S0341816222003666, doi:https://doi. org/10.1016/j.catena.2022.106380. Jin, B., Sun, G., Zhang, Y., Zou, M., Ni, X., Luo, K., Zhang, X., Cheng, H., Li, F., Wu, X.B.,
arXiv 2022
Show all 36 references
-
[19]
Feature pyramid networks for object detection, in: 2017 IEEE Conference on Computer Vision and Pattern Recognition (CVPR), pp. 936–944. doi:10.1109/CVPR.2017.106. Liu, Z., Mao, H., Wu, C.Y., Feichtenhofer, C., Darrell, T., Xie, S.,
2017 doi
-
[20]
Proceedings of the IEEE/CVF Conference on Computer Vision and Pattern Recognition (CVPR)
A convnet for the 2020s. Proceedings of the IEEE/CVF Conference on Computer Vision and Pattern Recognition (CVPR) . Luo,Z.,Yang,W.,Yuan,Y.,Gou,R.,Li,X.,2023. Semanticsegmentationofagriculturalimages: Asurvey. InformationProcessinginAgriculture J.F. Díez-Pastor et al.:Preprint ...
2023 doi
-
[21]
IEEE Transactions on Pattern Analysis and Machine Intelligence 44, 3523–3542
Image segmentation using deep learning: A survey. IEEE Transactions on Pattern Analysis and Machine Intelligence 44, 3523–3542. doi:10.1109/TPAMI.2021.3059968. Mnih, V., Hinton, G.E.,
2021
-
[22]
1933–1936
Patch based land cover classification: A comparison of deep learning, svm and nn classifiers, in: IGARSS 2020 - 2020 IEEE International Geoscience and Remote Sensing Symposium, pp. 1933–1936. doi:10.1109/IGARSS39084.2020. 9323755. Parajuli,J.,Fernandez-Beltran,R.,Kang,J.,Pla,F...
2020
-
[23]
International Journal of Applied Earth Observation and Geoinformation 84, 101977
Terra: Terrain extraction from elevation rasters through repetitive anisotropic filtering. International Journal of Applied Earth Observation and Geoinformation 84, 101977. doi:10.1016/j.jag. 2019.101977. Powell, R., Matzke, N., de Souza, C., Clark, M., Numata, I., Hess, L., R...
2019
-
[25]
Detection of old agricultural terraces in steep, vegetated terrain using airborne lidar: Case studies from hong kong, in: 33rd Asian Conference on Remote Sensing 2012, p. 408–417. URL:https://api.semanticscholar. org/CorpusID:15246203. Schneider, C.A., Rasband, W.S., Eliceiri, K.W.,
2012
-
[26]
Nature Methods 9, 671–675
NIH image to ImageJ: 25 years of image analysis. Nature Methods 9, 671–675. doi:10. 1038/nmeth.2089. Simonyan,K.,Zisserman,A.,2015. Verydeepconvolutionalnetworksforlarge-scaleimagerecognition. URL: https://arxiv.org/abs/1409. 1556, arXiv:1409.1556. Sofia, G., Marinello, F., Ta...
2015 arXiv
-
[29]
Ecology and Evolution 11, 13684–13691
Positive impacts of livestock and wild ungulate routes on functioning of dryland ecosystems. Ecology and Evolution 11, 13684–13691. doi: 10.1002/ece3.8147, arXiv:https://onlinelibrary.wiley.com/doi/pdf/10.1002/ece3.8147. J.F. Díez-Pastor et al.:Preprint submitted to Elsevier P...
-
[30]
URL: https://arxiv.org/abs/1602.07261, arXiv:1602.07261
Inception-v4, inception-resnet and the impact of residual connections on learning. URL: https://arxiv.org/abs/1602.07261, arXiv:1602.07261. Tan,M.,Le,Q.V.,2020.Efficientnet: Rethinkingmodelscalingforconvolutionalneuralnetworks.URL: https://arxiv.org/abs/1905.11946, arXiv:1905....
2020 arXiv
-
[31]
arXiv preprint arXiv:2206.04040
An improved one millisecond mobile backbone. arXiv preprint arXiv:2206.04040 . Washington-Allen, R.A., Niel, T.G.V., Ramsey, R.D., West, N.E.,
-
[32]
Remote Sensing of Environment 287, 113452
Semantic segmentation of water bodies in very high-resolution satellite and aerial images. Remote Sensing of Environment 287, 113452. doi:10.1016/j.rse.2023.113452. Wieren, S.E., Bakker, J.P.,
2023
-
[34]
International Journal of Applied Earth Observation and Geoinformation 112, 102885
Semantic image segmentation for sea ice parameters recognition using deep convolutional neural networks. International Journal of Applied Earth Observation and Geoinformation 112, 102885. doi:10.1016/j.jag.2022.102885. Zhang,X.,Jin,J.,Lan,Z.,Li,C.,Fan,M.,Wang,Y.,Yu,X.,Zhang,Y....
2022
-
[36]
Cantabrian
Pyramid scene parsing network, in: 2017 IEEE Conference on Computer Vision and Pattern Recognition (CVPR), IEEE Computer Society, Los Alamitos, CA, USA. pp. 6230–6239. doi:10.1109/CVPR.2017.660. J.F. Díez-Pastor et al.:Preprint submitted to Elsevier Page 17 of 17 Remote sensin...
2017 doi
-
[1982]
Zeitschrift fur Geomorphologie 26, 459–472
Grazing-step terracettes and their significanceGrazing-step terracettes and their significance. Zeitschrift fur Geomorphologie 26, 459–472. doi:10.1127/zfg/26/1982/459. ADS Bibcode: 1982ZGm....26..459H. Hiltbrunner, D., Schulze, S., Hagedorn, F., Schmidt, M.W., Zimmmermann, S.,
1982 doi
-
[1992]
Springer, pp
Individual comparisons by ranking methods, in: Breakthroughs in statistics: Methodology and distribution. Springer, pp. 196–202. Wurm,M.,Stark,T.,Zhu,X.X.,Weigand,M.,Taubenböck,H.,2019. Semanticsegmentationofslumsinsatelliteimagesusingtransferlearningon fully convolutional neu...
2019 doi
-
[2004]
Remote Sensing of Environment 90, 221–234
Sources of error in accuracy assessment of thematic land-cover maps in the brazilian amazon. Remote Sensing of Environment 90, 221–234. doi:10.1016/j.rse.2003.12.007. Robbins, C.,
2003 doi
-
[2008]
CATENA 75, 288–296
Grazing-induced spatial variability of soil bulk density and content of moisture, organic carbon and calcium carbonate in a semi-arid rangeland. CATENA 75, 288–296. doi:10.1016/j.catena.2008.07.007. Stavi, I., Yizhaq, H., Osem, Y., Argaman, E.,
2008 doi
-
[2012]
Geoderma 170, 369–377
Cattle trampling alters soil properties and changes soil microbial communities in a swiss sub-alpine pasture. Geoderma 170, 369–377. doi:10.1016/j.geoderma.2011.11.026. Hong, D., Zhang, B., Li, H., Li, Y., Yao, J., Li, C., Werner, M., Chanussot, J., Zipf, A., Zhu, X.X.,
2011 doi
-
[2014]
ISPRS Journal of Photogrammetry and Remote Sensing 96, 123–133
A new landscape metric for the identification of terraced sites: The slope local length of auto-correlation (sllac). ISPRS Journal of Photogrammetry and Remote Sensing 96, 123–133. doi:10.1016/j.isprsjprs.2014.06.018. Stavi, I., Ungar, E.D., Lavee, H., Sarah, P.,
2014 doi
-
[2016]
Ecosphere 7, e01337
Livestock tracks transform resource distribution on terracette landscapes of the loess plateau. Ecosphere 7, e01337. doi: 10.1002/ecs2.1337, arXiv:https://esajournals.onlinelibrary.wiley.com/doi/pdf/10.1002/ecs2.1337. Jones,C.G.,Lawton,J.H.,Shachak,M.,1994. Organismsasecosyste...
-
[2017]
URL:https://arxiv.org/abs/1610.02357, arXiv:1610.02357
Xception: Deep learning with depthwise separable convolutionsfefficient. URL:https://arxiv.org/abs/1610.02357, arXiv:1610.02357. da Costa, L.B., de Carvalho, O.L.F., de Albuquerque, A.O., Gomes, R.A.T., Guimarães, R.F., de Carvalho Júnior, O.A.,
-
[2018]
URL:https://arxiv.org/abs/ 1608.06993, arXiv:1608.06993
Densely connected convolutional networks. URL:https://arxiv.org/abs/ 1608.06993, arXiv:1608.06993. Iakubovskii, P.,
-
[2020]
Ecology Letters 23, 1298–1309
The effects of livestock grazing on biodiversity are multi-trophic: a meta-analysis. Ecology Letters 23, 1298–1309. doi: 10.1111/ele.13527, arXiv:https://onlinelibrary.wiley.com/doi/pdf/10.1111/ele.13527. Gordon, I.J., Prins, H.H.T.,
-
[2021]
Ecological Informatics 62, 101279
Amazon forest cover change mapping based on semantic segmentation by u-nets. Ecological Informatics 62, 101279. doi:10.1016/j.ecoinf.2021.101279. Cai, H., Li, J., Hu, M., Gan, C., Han, S.,
2021
-
[2022]
Geocarto International 37, 6538–6550
Deep semantic segmentation for detecting eucalyptus planted forests in the brazilian territory using sentinel-2 imagery. Geocarto International 37, 6538–6550. doi:10.1080/10106049.2021.1943009, arXiv:https://doi.org/10.1080/10106049.2021.1943009. DaniloGodone,D.G.,Baldo,M.,201...
2021
-
[2023]
Remote Sensing of Environment 299, 113856
Cross-city matters: A multimodal remote sensing benchmark dataset for cross-city semantic segmentation using high-resolution domain adaptation networks. Remote Sensing of Environment 299, 113856. doi:10.1016/j.rse.2023.113856. Hosseini, M., Miranda, F., Lin, J., Silva, C.T.,
2023
-
[2024]
arXiv preprint arXiv:2312.00752
Mamba: Linear-time sequence modeling with selective state spaces. arXiv preprint arXiv:2312.00752 . Guo,Y.,Liu,Y.,Georgiou,T.,Lew,M.,2018. Areviewofsemanticsegmentationusingdeepneuralnetworks. InternationalJournalofMultimedia Information Retrieval
2018 arXiv
-
[2025]
Phileobench: Evaluatinggeo-spatialfoundationmodels
Fibaek,C.,Camilleri,L.,Luyts,A.,Dionelis,N.,LeSaux,B.,2024. Phileobench: Evaluatinggeo-spatialfoundationmodels. arXiv:2401.04464. Filazzola, A., Brown, C., Dettlaff, M.A., Batbaatar, A., Grenke, J., Bao, T., Peetoom Heida, I., Cahill Jr, J.F.,
2024 arXiv
Reviewed August 16, 2026 · model on record in the stance chip above.
Discussion (0). Continue with ORCID to comment.