REVIEW 3 major objections 6 minor 89 references
Massive neighbor halos siphon cool gas from isolated galaxies, independent of black-hole mass.
Reviewed by Pith at T0; open to challenge. T0 means a machine referee read the full paper against a public rubric. the ladder, T0–T4 →
T0 review · deepseek-v4-flash
2026-08-02 03:11 UTC pith:ED4T2IPB
load-bearing objection A worthwhile empirical extension with a genuine new test, but the MBH control is not clean enough to support the strong 'independent of BH feedback' claim without more robustness work. the 3 major comments →
Even central galaxies feel their environment: cosmic siphoning of cool gas accretion
The pith
A machine-rendered reading of the paper's core claim, the machinery that carries it, and where it could break.
Core claim
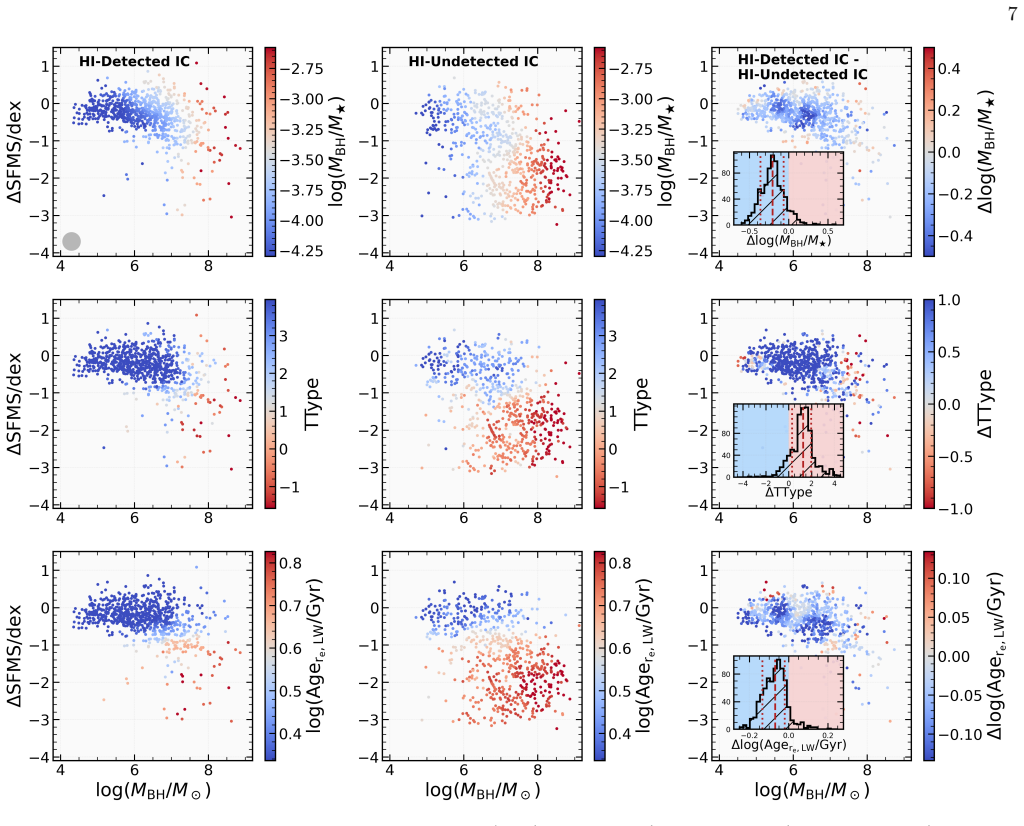
Building directly on the previously established μ_HI–M_BH relation, the paper shows that the galaxies most displaced from that relation are overwhelmingly isolated central galaxies (84% of outliers in the primary sample, 89% in a confirmation sample). At fixed black hole mass and star-formation offset, isolated centrals have lower HI detection fractions than group centrals. Among isolated centrals, the HI-undetected systems have higher black-hole-to-stellar-mass ratios, more bulge-dominated morphologies, older stellar populations, and—critically—a systematically higher probability of having a massive (≳10^12 solar masses) group within a projected megaparsec. The authors argue that this envir
What carries the argument
The analytical engine is the μ_HI–M_BH relation (with μ_HI = M_HI/M_*, the atomic-gas-to-stellar-mass ratio) established in prior work, used as a baseline from which deviations mark gas deficiency. To isolate environmental effects, the authors match galaxies on the two-dimensional plane of M_BH and ΔSFMS, then compare HI detection fractions, morphology, and environment between matched samples. The key environmental metrics are the fifth-nearest-neighbor projected density and the probability of a nearby massive (≳10^12 M_sun) group within 1 Mpc. The black hole masses themselves come from a recalibrated Fundamental Plane relation combined with a velocity-dispersion–M_BH scaling, which is the p
Load-bearing premise
The black hole masses are estimated from a Fundamental Plane calibration plus a velocity-dispersion scaling relation; if these estimates are systematically off for the very bulge-dominated, gas-poor galaxies being studied, then 'controlling for black hole mass' does not actually remove internal feedback, and the environmental claim would not be established.
What would settle it
Recompute black hole masses for the same galaxies using direct dynamical or reverberation measurements and redo the matching at fixed M_BH and ΔSFMS; if the HI detection fractions of isolated and group centrals converge, or if HI-undetected isolated centrals no longer show an excess of massive neighbors, the central claim is falsified.
If this is right
- Environment acts as a secondary, independent regulator of cool gas in central galaxies, so the μ_HI–M_BH relation alone is incomplete.
- Gas-poor isolated centrals near massive halos may be backsplash galaxies, offering a way to identify recently processed systems in the field.
- The 'cosmic siphoning' picture predicts that HI deficiency in isolated galaxies should increase with proximity to massive nodes and be strongest along filaments feeding those nodes.
- If verified, galaxy formation models must include competitive accretion and large-scale potential wells, not just halo mass and black-hole feedback, to reproduce the HI content of centrals.
Where Pith is reading between the lines
- The interpretation as 'siphoning' goes beyond the correlation; direct gas-flow observations, such as mapping the circumgalactic medium of isolated centrals near massive groups, could test whether gas is actually being diverted.
- The same logic should apply to other baryonic tracers—molecular gas and star-formation efficiency—predicting that CO-poor and quenched isolated galaxies also cluster near massive halos in matched samples.
- A testable extension: if the siphoning is competitive accretion, the effect should strengthen at lower halo masses and at smaller projected distances to the massive neighbor; this can be checked with larger, deeper surveys.
- If confirmed, galaxy scaling relations used for predicting gas content should incorporate a local environmental term alongside black-hole mass and stellar mass.
Editorial analysis
A structured set of objections, weighed in public.
Referee Report
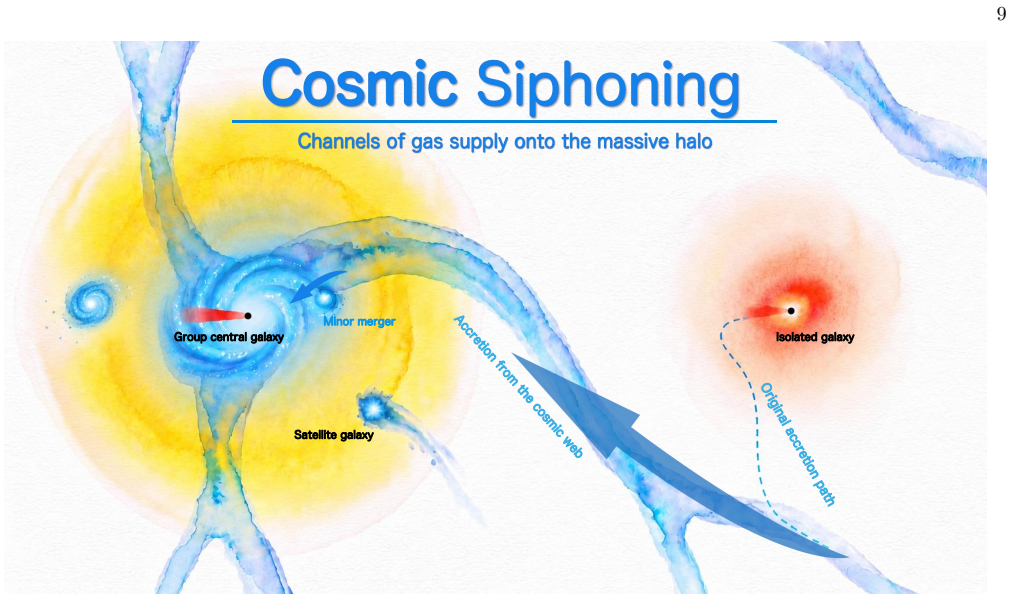
Summary. The paper extends the μ_HI–M_BH relation of Wang et al. (2024) to isolated central galaxies (ICs) and group central galaxies (GCs) using HI-MaNGA and xGASS data, with group membership from Yang et al. (2007). Black hole masses are derived from a K-band Fundamental Plane fit to σ_* followed by the van den Bosch (2016) MBH–σ relation. The authors report that (i) outliers below the μ_HI–M_BH relation are predominantly ICs; (ii) after matching on ΔSFMS and MBH, ICs have lower HI detection fractions and lower median μ_HI than GCs; (iii) among ICs, HI-undetected galaxies have higher MBH/M★, earlier T-Types, older stellar ages, and are preferentially located near massive (≳10^12 M⊙) neighboring halos; and (iv) they interpret this as ``cosmic siphoning''—competitive gas accretion on inter-halo scales plus central-satellite gas exchange on sub-halo scales. The central claim is that external environment suppresses cool gas in central galaxies independently of internal AGN feedback.
Significance. If the result holds, the paper provides an important observational constraint: the cool gas content of central galaxies is not fully determined by MBH and star-formation state, but also by the large-scale environment, specifically proximity to massive halos. The study has several genuine strengths: it treats HI upper limits with a Kaplan-Meier estimator, uses an external group catalog rather than fitting environmental parameters in this paper, reproduces the main results in two independent samples, and presents a falsifiable pattern (HI-undetected ICs near massive neighbors) rather than a purely interpretive claim. The 2D matching on ΔSFMS–MBH is a reasonable attempt to control for the two variables previously identified as dominant. However, the significance of the paper depends on whether MBH is measured well enough to support the claim that environmental effects are independent of internal black-hole feedback; this is not yet demonstrated.
major comments (3)
- [§3.1, Fig. 3; §3.2, Fig. 4; §3.3, Fig. 5] The matched differences shown in the third columns of Figs. 3–5 are presented with 16th/50th/84th percentiles of the pixel-level difference distributions, but no formal significance test or confidence interval is reported. The central claim—that ICs have lower HI detection fraction and lower μ_HI than GCs at fixed MBH and ΔSFMS, and that HI-undetected ICs are preferentially near massive halos—requires a statement of whether these offsets are distinguishable from zero given the finite bin counts, correlated smoothing, and matching-pair uncertainties. Bootstrap resampling of the matched pairs, or a paired permutation test, should be added.
- [§2.3, Fig. 1; §3.1–§3.3] The MBH estimates are load-bearing: they are used both for matching (Figs. 3–5) and for the μ_HI–M_BH baseline (Fig. 2). The paper does not propagate uncertainties from the Fundamental Plane fit into MBH, nor does it test robustness to alternative MBH calibrations (e.g., direct MBH–σ relations for late types, or bulge-mass-based estimators). The authors note in §3.1 that subtracting rotation changes MBH for low-MBH late types, showing the result is sensitive to the correction. Because HI-undetected ICs are systematically more bulge-dominated and older, any morphology- or environment-dependent bias in the FP-derived σ would masquerade as an independent environmental effect. A robustness test using a different MBH calibration, or adding T-Type/bulge mass as a third matching axis, is necessary to secure the ``independent of internal BH feedback'' conclusion.
- [§3.1, Fig. 2] The statement that 84% of μ_HI–M_BH outliers are ICs is difficult to interpret without accounting for the sample composition: the text itself acknowledges that ICs are more numerous. The background-color map in Fig. 2(a,c) is a step in the right direction, but the paper does not report the IC/GC number ratio at fixed MBH, nor does it give uncertainties on the outlier fractions. Since this is the opening result of the paper, a quantitative comparison (e.g., odds ratio with confidence interval) should be provided.
minor comments (6)
- [Abstract and §1] The phrase ``even central galaxies feel their environment'' is used throughout; consider clarifying in the abstract that ``central'' here means group central and isolated central galaxies, not cluster-centered galaxies.
- [§3.2] ``here we explore the its cause'' is a typo; should read ``its cause.'' Also, ``the possibility of finding...'' in the Fig. 5 caption is awkward; ``probability of finding'' would be clearer.
- [Author contributions] The text says ``KW was responsible for writing...'' but the authors are Ke Xu and Tao Wang; presumably this should be ``KX.'' Please correct.
- [Fig. 2 caption] The caption refers to ``panel c & f'' and ``panel e'' inconsistently; the text and caption should use a single panel-naming convention.
- [Appendix A] The xGASS MBH is derived from the MaNGA FP fit, but the ETG/LTG split uses a Sérsic-index division; the systematic offset between these morphology classifications and the MaNGA T-Type divisions should be mentioned in the main text or appendix.
- [§2.1] The HI upper-limit recalculation is described only by reference to Wang et al. (2024); a brief description of the line-width–stellar-mass relation used would make the paper self-contained.
Circularity Check
No significant circularity: the environmental signal is derived from external catalogs and direct sample matching, not from the self-cited μ_HI–M_BH relation.
full rationale
The central environmental comparison is self-contained: Fig. 3 directly matches GCs against ICs within 0.25 dex on the ΔSFMS–M_BH plane and computes the f_det difference, using M_BH from the external van den Bosch (2016) relation applied to σ measurements from Zhu et al. (2023) and group/isolated classifications from Yang et al. (2007). No constant is fit to HI data in this paper that would force the IC/GC difference. The Wang et al. (2024) μ_HI–M_BH relation is a self-citation, but it is used only as a reference baseline for defining outliers and as motivation; the paper explicitly states GCs are slightly below it and tests the IC/GC offset by direct matching, so the main result does not reduce to that relation. The M_BH estimator caveats (FP refit, rotation subtraction changing low-M_BH LTG masses) are correctness/systematics concerns, not identity-by-construction circularity. Therefore no circular step is identified.
Axiom & Free-Parameter Ledger
free parameters (7)
- FP slope for LTGs =
0.42 ± 0.02
- FP intercept for LTGs =
-2.27 ± 0.19
- FP slope for ETGs =
0.56 ± 0.02
- FP intercept for ETGs =
-3.70 ± 0.22
- Outlier threshold from μ_HI–M_BH relation =
0.5 dex
- Matching neighborhood radius on ΔSFMS–M_BH plane =
0.25 dex
- Nearby massive group threshold =
log(M_halo/M_sun) > 12 within 1 Mpc projected
axioms (7)
- domain assumption ΛCDM cosmology with ΩM=0.3, ΩΛ=0.7, H0=70 km/s
- domain assumption M_BH–σ relation of van den Bosch (2016) applies to all sample galaxies
- domain assumption Fundamental Plane calibrated in K-band is valid for both ETGs and LTGs
- domain assumption Yang et al. (2007) group catalog correctly identifies centrals, satellites, and halo masses
- domain assumption HI-MaNGA single-dish confusion probability <0.5 selects uncontaminated HI measurements
- standard math Kaplan-Meier estimator gives unbiased median μ_HI with upper limits
- domain assumption Renzini & Peng (2015) star-forming main sequence is the correct SFR normalization for ΔSFMS
read the original abstract
Identifying the key processes regulating cool gas accretion in galaxies is essential for understanding the baryon cycle within galactic ecosystems. Recent studies indicate that the most fundamental internal process is likely the competition between halos and central black holes. This is revealed through a universal relation between increasing black hole masses and decreasing cool gas fraction ($\mu_{\rm HI} \equiv M_{\rm HI}/M_{\star} \propto M_{\rm BH}^{-0.6}$). Here we further explore the primary external effects on cool gas accretion in central galaxies. We find that galaxies deviating significantly from the $\mu_{\rm HI}-M_{\rm BH}$ relation are overwhelmingly isolated central galaxies without substantial satellites. These isolated, gas-poor centrals exhibit systematically higher black-hole-to-stellar-mass ratios and more prominent bulges, suggesting a greater susceptibility to AGN feedback. At larger scales, they are preferentially located near massive neighboring halos. We interpret these as evidence of "cosmic siphoning'' -- a multi-scale, gravity-driven process in which cool gas is channeled into deeper potential wells. On inter-halo scales, it manifests as competitive accretion: massive dark matter halos intercept cold filamentary streams, starving neighboring low-mass halos and quenching their star formation. On sub-halo scales, an analogous siphoning operates within groups and clusters, where the central galaxy systematically drains gas from its satellites through tidal interactions and accretion of satellite circumgalactic medium. This multi-scale mechanism -- from inter-halo competition to central-satellite interplay -- naturally drives the observed differences in the cool gas fractions between isolated and group centrals, or among the isolated, between those with and without a massive neighboring halo, and embodies a cosmic "rich-get-richer" paradigm.
Figures





Reference graph
Works this paper leans on
-
[1]
Alberts, S., & Noble, A. 2022, Universe, 8, 554, doi: 10.3390/universe8110554 Argudo-Fern´ andez, M., Verley, S., Bergond, G., et al. 2015, A&A, 578, A110, doi: 10.1051/0004-6361/201526016 Astropy Collaboration, Robitaille, T. P., Tollerud, E. J., et al. 2013, A&A, 558, A33, doi: 10.1051/0004-6361/201322068 Astropy Collaboration, Price-Whelan, A. M., Sip˝...
-
[2]
Beifiori, A., Courteau, S., Corsini, E. M., & Zhu, Y. 2012, MNRAS, 419, 2497, doi: 10.1111/j.1365-2966.2011.19903.x
arXiv 2012
-
[3]
Benson, A. J. 2010, PhR, 495, 33, doi: 10.1016/j.physrep.2010.06.001
-
[4]
2011, AJ, 142, 31, doi: 10.1088/0004-6256/142/1/31
Price-Whelan, A. 2011, AJ, 142, 31, doi: 10.1088/0004-6256/142/1/31
-
[5]
Bluck, A. F. L., Maiolino, R., S´ anchez, S. F., et al. 2020, MNRAS, 492, 96, doi: 10.1093/mnras/stz3264
-
[6]
Borrow, J., Vogelsberger, M., O’Neil, S., McDonald, M. A., & Smith, A. 2023, MNRAS, 520, 649, doi: 10.1093/mnras/stad045
-
[7]
2022, A&A Rv, 30, 3, doi: 10.1007/s00159-022-00140-3
Boselli, A., Fossati, M., & Sun, M. 2022, A&A Rv, 30, 3, doi: 10.1007/s00159-022-00140-3
-
[8]
2019, A&A, 631, A114, doi: 10.1051/0004-6361/201936133
Boselli, A., Epinat, B., Contini, T., et al. 2019, A&A, 631, A114, doi: 10.1051/0004-6361/201936133
-
[9]
Brinchmann, J., Charlot, S., White, S. D. M., et al. 2004, MNRAS, 351, 1151, doi: 10.1111/j.1365-2966.2004.07881.x
arXiv 2004
-
[10]
2017, MNRAS, 466, 1275, doi: 10.1093/mnras/stw2991
Brown, T., Catinella, B., Cortese, L., et al. 2017, MNRAS, 466, 1275, doi: 10.1093/mnras/stw2991
-
[11]
Bundy, K., Bershady, M. A., Law, D. R., et al. 2015, ApJ, 798, 7, doi: 10.1088/0004-637X/798/1/7
-
[12]
2013, MNRAS, 432, 1709, doi: 10.1093/mnras/stt562
Cappellari, M., Scott, N., Alatalo, K., et al. 2013, MNRAS, 432, 1709, doi: 10.1093/mnras/stt562
-
[14]
2013, MNRAS, 436, 34, doi: 10.1093/mnras/stt1417
Catinella, B., Schiminovich, D., Cortese, L., et al. 2013, MNRAS, 436, 34, doi: 10.1093/mnras/stt1417
-
[15]
2018, MNRAS, 476, 875, doi: 10.1093/mnras/sty089
Catinella, B., Saintonge, A., Janowiecki, S., et al. 2018, MNRAS, 476, 875, doi: 10.1093/mnras/sty089
-
[16]
1988, A&A, 203, L9
Combes, F., Dupraz, C., Casoli, F., & Pagani, L. 1988, A&A, 203, L9
1988
-
[17]
Cotton, W. D., Thorat, K., Condon, J. J., et al. 2020, MNRAS, 495, 1271, doi: 10.1093/mnras/staa1240
-
[18]
Cramer, W. J., Noble, A. G., Massingill, K., et al. 2023, ApJ, 944, 213, doi: 10.3847/1538-4357/acae96 Crone Odekon, M., Hallenbeck, G., Haynes, M. P., et al. 2018, ApJ, 852, 142, doi: 10.3847/1538-4357/aaa1e8
-
[19]
2006, MNRAS, 368, 2, doi: 10.1111/j.1365-2966.2006.10145.x
Dekel, A., & Birnboim, Y. 2006, MNRAS, 368, 2, doi: 10.1111/j.1365-2966.2006.10145.x
arXiv 2006
-
[20]
2009, Nature, 457, 451, doi: 10.1038/nature07648
Dekel, A., Birnboim, Y., Engel, G., et al. 2009, Nature, 457, 451, doi: 10.1038/nature07648
-
[21]
Deo, D. K. 2026, https://arxiv.org/abs/2601.09846
arXiv 2026
-
[22]
Djorgovski, S., & Davis, M. 1987, ApJ, 313, 59, doi: 10.1086/164948 Dom ´ ınguez S´ anchez, H., Huertas-Company, M., Bernardi, M., Tuccillo, D., & Fischer, J. L. 2018, MNRAS, 476, 3661, doi: 10.1093/mnras/sty338
doi:10.1086/164948 1987
-
[23]
1987, ApJ, 313, 42, doi: 10.1086/164947
Dressler, A., Lynden-Bell, D., Burstein, D., et al. 1987, ApJ, 313, 42, doi: 10.1086/164947
doi:10.1086/164947 1987
-
[24]
Fabian, A. C. 2012, ARA&A, 50, 455, doi: 10.1146/annurev-astro-081811-125521
-
[25]
Fabian, A. C., Sanders, J. S., Ferland, G. J., et al. 2025, arXiv e-prints, arXiv:2508.14785. https://arxiv.org/abs/2508.14785 Falc´ on-Barroso, J., van de Ven, G., Peletier, R. F., et al. 2011, MNRAS, 417, 1787, doi: 10.1111/j.1365-2966.2011.19372.x
Pith/arXiv arXiv 2025
-
[26]
2000, ApJL, 539, L9, doi: 10.1086/312838
Ferrarese, L., & Merritt, D. 2000, ApJL, 539, L9, doi: 10.1086/312838
doi:10.1086/312838 2000
-
[27]
2000, ApJL, 539, L13, doi: 10.1086/312840
Gebhardt, K., Bender, R., Bower, G., et al. 2000, ApJL, 539, L13, doi: 10.1086/312840
doi:10.1086/312840 2000
-
[28]
Gunn, J. E., & Gott, III, J. R. 1972, ApJ, 176, 1, doi: 10.1086/151605
doi:10.1086/151605 1972
-
[29]
Harris, C. R., Millman, K. J., van der Walt, S. J., et al. 2020, Nature, 585, 357, doi: 10.1038/s41586-020-2649-2
-
[30]
Haynes, M. P., Giovanelli, R., Martin, A. M., et al. 2011, AJ, 142, 170, doi: 10.1088/0004-6256/142/5/170
-
[31]
Haynes, M. P., Giovanelli, R., Kent, B. R., et al. 2018, ApJ, 861, 49, doi: 10.3847/1538-4357/aac956
-
[32]
Hoosain, M., Blyth, S.-L., Skelton, R. E., et al. 2024, MNRAS, 528, 4139, doi: 10.1093/mnras/stae174
-
[33]
Hunter, J. D. 2007, Computing in Science and Engineering, 9, 90, doi: 10.1109/MCSE.2007.55 14
-
[34]
2017, MNRAS, 466, 4795, doi: 10.1093/mnras/stx046
Janowiecki, S., Catinella, B., Cortese, L., et al. 2017, MNRAS, 466, 4795, doi: 10.1093/mnras/stx046
-
[35]
H., Chester, T., Cutri, R., et al
Jarrett, T. H., Chester, T., Cutri, R., et al. 2000, AJ, 119, 2498, doi: 10.1086/301330
doi:10.1086/301330 2000
-
[36]
Kauffmann, G., Heckman, T. M., White, S. D. M., et al. 2003, MNRAS, 341, 33, doi: 10.1046/j.1365-8711.2003.06291.x Kereˇ s, D., Katz, N., Weinberg, D. H., & Dav´ e, R. 2005, MNRAS, 363, 2, doi: 10.1111/j.1365-2966.2005.09451.x
arXiv 2003
-
[37]
Kleiner, D., Pimbblet, K. A., Jones, D. H., Koribalski, B. S., & Serra, P. 2017, MNRAS, 466, 4692, doi: 10.1093/mnras/stw3328
-
[38]
Kormendy, J., & Ho, L. C. 2013, ARA&A, 51, 511, doi: 10.1146/annurev-astro-082708-101811
-
[39]
Lagos, P., Loubser, S. I., Scott, T. C., et al. 2022, MNRAS, 516, 5487, doi: 10.1093/mnras/stac2535
-
[40]
Larson, R. B., Tinsley, B. M., & Caldwell, C. N. 1980, ApJ, 237, 692, doi: 10.1086/157917
doi:10.1086/157917 1980
-
[41]
C., O’Sullivan, D., Matuszewski, M., et al
Martin, D. C., O’Sullivan, D., Matuszewski, M., et al. 2019, Nature Astronomy, 3, 822, doi: 10.1038/s41550-019-0791-2
-
[42]
2012, A&A, 540, A96, doi: 10.1051/0004-6361/201117281
Martinez-Badenes, V., Lisenfeld, U., Espada, D., et al. 2012, A&A, 540, A96, doi: 10.1051/0004-6361/201117281
-
[43]
Masters, K. L., Stark, D. V., Pace, Z. J., et al. 2019, MNRAS, 488, 3396, doi: 10.1093/mnras/stz1889
-
[45]
McCarthy, I. G., Schaye, J., Bower, R. G., et al. 2011, MNRAS, 412, 1965, doi: 10.1111/j.1365-2966.2010.18033.x
arXiv 2011
-
[46]
McConnell, N. J., & Ma, C.-P. 2013, ApJ, 764, 184, doi: 10.1088/0004-637X/764/2/184
-
[47]
McNamara, B. R., & Nulsen, P. E. J. 2007, ARA&A, 45, 117, doi: 10.1146/annurev.astro.45.051806.110625
Pith/arXiv arXiv 2007
-
[48]
E., Schinnerer, E., van de Ven, G., et al
Meidt, S. E., Schinnerer, E., van de Ven, G., et al. 2014, ApJ, 788, 144, doi: 10.1088/0004-637X/788/2/144
-
[49]
1983, ApJ, 264, 24, doi: 10.1086/160571
Merritt, D. 1983, ApJ, 264, 24, doi: 10.1086/160571
doi:10.1086/160571 1983
-
[50]
1996, Nature, 379, 613, doi: 10.1038/379613a0
Moore, B., Katz, N., Lake, G., Dressler, A., & Oemler, A. 1996, Nature, 379, 613, doi: 10.1038/379613a0
doi:10.1038/379613a0 1996
-
[51]
1998, ApJ, 495, 139, doi: 10.1086/305264
Moore, B., Lake, G., & Katz, N. 1998, ApJ, 495, 139, doi: 10.1086/305264
doi:10.1086/305264 1998
-
[52]
2025, arXiv e-prints, arXiv:2508.20276, doi: 10.48550/arXiv.2508.20276
Mtshweni, L. 2025, arXiv e-prints, arXiv:2508.20276, doi: 10.48550/arXiv.2508.20276
-
[53]
Naab, T., & Ostriker, J. P. 2017, ARA&A, 55, 59, doi: 10.1146/annurev-astro-081913-040019
-
[54]
2025, Astronomy and Computing, 53, 100972, doi: 10.1016/j.ascom.2025.100972
Nandi, A., & Pandey, B. 2025, Astronomy and Computing, 53, 100972, doi: 10.1016/j.ascom.2025.100972
arXiv 2025
-
[55]
2022, MNRAS, 513, 5988, doi: 10.1093/mnras/stac1260
Neumann, J., Thomas, D., Maraston, C., et al. 2022, MNRAS, 513, 5988, doi: 10.1093/mnras/stac1260
-
[56]
G., Muzzin, A., McDonald, M., et al
Noble, A. G., Muzzin, A., McDonald, M., et al. 2019, ApJ, 870, 56, doi: 10.3847/1538-4357/aaf1c6
-
[57]
A., Meidt, S., Van de Ven, G., et al
Norris, M. A., Meidt, S., Van de Ven, G., et al. 2014, ApJ, 797, 55, doi: 10.1088/0004-637X/797/1/55 O’Kane, C. J., Kuchner, U., Gray, M. E., & Arag´ on-Salamanca, A. 2024, MNRAS, 534, 1682, doi: 10.1093/mnras/stae2142
-
[58]
McCarthy, I. G. 2021, Universe, 7, 209, doi: 10.3390/universe7070209
-
[59]
2015, Nature, 521, 192, doi: 10.1038/nature14439
Peng, Y., Maiolino, R., & Cochrane, R. 2015, Nature, 521, 192, doi: 10.1038/nature14439
-
[60]
Wise, M. W. 2006, ApJ, 652, 216, doi: 10.1086/507672
doi:10.1086/507672 2006
-
[61]
2020, doi: 10.5281/zenodo.3938000
Reid, M. 2020, doi: 10.5281/zenodo.3938000
-
[62]
2021, doi: 10.5281/zenodo.5030847
Reid, M. 2021, doi: 10.5281/zenodo.5030847
-
[63]
Reines, A. E., & Volonteri, M. 2015, ApJ, 813, 82, doi: 10.1088/0004-637X/813/2/82
-
[64]
2015, ApJL, 801, L29, doi: 10.1088/2041-8205/801/2/L29
Renzini, A., & Peng, Y.-j. 2015, ApJL, 801, L29, doi: 10.1088/2041-8205/801/2/L29
-
[65]
Ritter, J., Arrigoni Battaia, F., Peng, B., et al. 2026, arXiv e-prints, arXiv:2606.30742, doi: 10.48550/arXiv.2606.30742
work page internal anchor Pith review Pith/arXiv arXiv doi:10.48550/arxiv.2606.30742 2026
-
[66]
Salim, S., Boquien, M., & Lee, J. C. 2018, ApJ, 859, 11, doi: 10.3847/1538-4357/aabf3c
-
[67]
Salim, S., Lee, J. C., Janowiecki, S., et al. 2016, ApJS, 227, 2, doi: 10.3847/0067-0049/227/1/2
-
[68]
2021, MNRAS, 507, 2423, doi: 10.1093/mnras/stab2319
Shi, Y., Yu, X., Mao, S., et al. 2021, MNRAS, 507, 2423, doi: 10.1093/mnras/stab2319
-
[69]
Skrutskie, M. F., Cutri, R. M., Stiening, R., et al. 2006, AJ, 131, 1163, doi: 10.1086/498708
doi:10.1086/498708 2006
-
[70]
Somerville, R. S., Hopkins, P. F., Cox, T. J., Robertson, B. E., & Hernquist, L. 2008, MNRAS, 391, 481, doi: 10.1111/j.1365-2966.2008.13805.x
arXiv 2008
-
[71]
Stark, D. V., Masters, K. L., Avila-Reese, V., et al. 2021, MNRAS, 503, 1345, doi: 10.1093/mnras/stab566
-
[72]
Team, T.-M. A. S. S. S. 2020, 2MASS All-Sky Extended Source Catalog (XSC), IPAC, doi: 10.26131/IRSA97
-
[73]
2018, ApJ, 858, 17, doi: 10.3847/1538-4357/aab9b0
Temi, P., Amblard, A., Gitti, M., et al. 2018, ApJ, 858, 17, doi: 10.3847/1538-4357/aab9b0
-
[74]
1972, ApJ, 178, 623, doi: 10.1086/151823
Toomre, A., & Toomre, J. 1972, ApJ, 178, 623, doi: 10.1086/151823
doi:10.1086/151823 1972
-
[75]
2002, ApJ, 574, 740, doi: 10.1086/341002
Tremaine, S., Gebhardt, K., Bender, R., et al. 2002, ApJ, 574, 740, doi: 10.1086/341002
doi:10.1086/341002 2002
-
[76]
Tremonti, C. A., Heckman, T. M., Kauffmann, G., et al. 2004, ApJ, 613, 898, doi: 10.1086/423264
doi:10.1086/423264 2004
-
[77]
Tumlinson, J., Peeples, M. S., & Werk, J. K. 2017, ARA&A, 55, 389, doi: 10.1146/annurev-astro-091916-055240 15 van den Bosch, R. C. E. 2016, ApJ, 831, 134, doi: 10.3847/0004-637X/831/2/134
-
[78]
2023, ApJL, 950, L22, doi: 10.3847/2041-8213/acd779
Wang, B., & Peng, Y. 2023, ApJL, 950, L22, doi: 10.3847/2041-8213/acd779
-
[79]
2023, MNRAS, 523, 1268, doi: 10.1093/mnras/stad1169
Wang, K., Peng, Y., & Chen, Y. 2023, MNRAS, 523, 1268, doi: 10.1093/mnras/stad1169
-
[80]
2024, Nature, 632, 1009, doi: 10.1038/s41586-024-07821-2
Wang, T., Xu, K., Wu, Y., et al. 2024, Nature, 632, 1009, doi: 10.1038/s41586-024-07821-2
-
[81]
2025, ApJ, 980, 107, doi: 10.3847/1538-4357/ada033
Wang, Y., Wang, T., Xu, K., et al. 2025, ApJ, 980, 107, doi: 10.3847/1538-4357/ada033
-
[82]
2025, ApJ, 993, 111, doi: 10.3847/1538-4357/adff7d
Wang, Y.-J., Chen, C.-C., Arrigoni Battaia, F., et al. 2025, ApJ, 993, 111, doi: 10.3847/1538-4357/adff7d
discussion (0)
Sign in with ORCID, Apple, or X to comment. Anyone can read and Pith papers without signing in.