REVIEW 4 major objections 4 minor 26 references
Localizing synergies of hidden factors across complex systems: resting brain networks and HeLa gene expression profile as case studies
T0 review · 4 major / 4 minor · reviewed 2026-08-07 · deepseek-v4-flash
Pith's one-line read The paper argues that the joint influence of latent factors on a variable is quantified by the O-information of the group formed by that variable plus the factors, and uses this to localize integrator variables in brain and gene data.
desk verdict Novel but rotation-sensitive method for localizing synergistic variables; correct math, but the main quantity is not identifiable without fixing a rotation. read the letter →
The pith
A machine-rendered reading of the paper's core claim, the machinery that carries it, and where it could break.
The reading
What carries the argument
The central object is O-information, a multivariate information measure built from Shannon entropies that is positive for redundancy-dominated systems and negative for synergy-dominated systems. In the Gaussian collider setup where one target variable is driven by several independent factors, Eq. (2) gives a closed form that is always non-positive, with $\mathrm{O}_{\mathrm{inf}} = 0$ only when a single loading is nonzero; the paper therefore reads $-\mathrm{O}_{\mathrm{inf}}$ as the net synergy contributed by the factors to that variable. This quantity carries the argument, turning a fitted latent-variable model into a per-variable integration score: first estimate the factors (by maximum-likelihood factor analysis, or by PCA when the sample size is too small), then evaluate O-information on each observed variable together with the factor scores.
What would settle it
Generate synthetic data from the paper's generative model with five independent Gaussian factors and one known integrator variable that depends on four of them; if the $-\mathrm{O}_{\mathrm{inf}}$ ranking does not put that variable at the top, the procedure fails. In the real HeLa data, repeat the analysis using the second through fifth principal components as factors instead of just PC2 and PC3; if STK-12 is no longer the top gene, the headline hit is an artifact of component selection.
Extended reading notes
Core claim
The central discovery is that the synergy of the joint influence of latent factors on an observed variable is captured by the O-information of the multiplet formed by the variable and the factors. In the Gaussian collider model $x = \sum_i L_i f_i + \eta$, this O-information is negative whenever at least two loadings are nonzero and vanishes when only one factor matters, so $-\mathrm{O}_{\mathrm{inf}}$ serves as a local synergy score. The paper derives the closed form in Eq. (2), proposes the practical recipe of fitting factor analysis, extracting factor scores, and computing $-\mathrm{O}_{\mathrm{inf}}$ for every variable, and applies that recipe to data: in resting fMRI, default-mode and frontoparietal networks are the most synergistic, and in HeLa cells the most synergistic gene is STK-12 (Aurora Kinase B).
Load-bearing premise
The whole method rests on the estimated factors faithfully representing the true hidden drivers, so the choice to fix 20 factors and then drop three in the fMRI analysis, and to use only the second and third principal components in the HeLa analysis, must be correct for the reported rankings to hold.
Editorial extensions
If this is right
- Any dataset that can be summarized by a factor model gets a per-variable synergy ranking, so the procedure is not tied to brain or gene data.
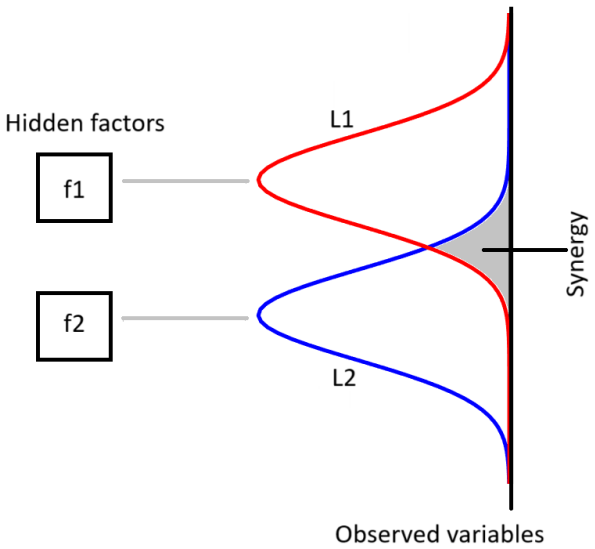
- In the Gaussian setting, a variable with nonzero loadings on at least two factors is automatically synergistic, making the score a quantitative version of the intuitive overlap picture in the paper's Figure 1.
- In resting-state fMRI, synergy concentrated in default-mode and frontoparietal networks would mean these associative regions act as information integrators while sensory-motor regions remain more modular.
- In HeLa cells, STK-12 being the most synergistic gene would single it out as a coordinator of cell-cycle control, consistent with its known role as a transcriptional brake.
Reading between the lines
- A direct extension the paper does not test is to feed the same score with factors obtained from any other latent-variable method, such as non-negative matrix factorization or sparse dictionary learning; Eq. (2) only needs loadings or factor-score samples.
- The case-study rankings inherit the hand-made factor choices, so a sensitivity analysis varying the number of factors (for example, 15 to 25) or keeping all 20 factors would reveal whether the DMN/FP and STK-12 results are stable or artifacts of those choices.
- Because the small-loading expansion gives $\mathrm{O}_{\mathrm{inf}} \sim -\sum_{i\neq k} L_i^2 L_k^2$, a variable with many moderate loadings can outrank one with a single strong loading; this could change how importance is assigned in factor-analytic studies.
Editorial analysis
A structured set of objections, weighed in public.
Referee Report
Summary. The manuscript proposes a method to quantify the joint, synergistic influence of latent factors on observed variables by evaluating the O-information of the group formed by each observed variable together with the estimated latent factors. Section II derives Eq. (2) for a Gaussian collider model, shows that Oinf is always negative, and outlines a four-step procedure: fix the number of factors, fit factor analysis (or PCA for small samples), extract factor scores, and rank observed variables by -Oinf. The method is applied to resting-state fMRI data (268 ROIs from 121 subjects, with 20 factors reduced to 17) and to HeLa gene expression data (94 genes, 48 time points, with PC2 and PC3 used as factors). The authors report that default mode and frontoparietal networks show the highest synergy in fMRI, and that STK-12 (AURKB) is the most synergistic gene in HeLa cells.
Significance. The derivation of Eq. (2) is correct for the stated Gaussian collider model, and the general idea of using O-information to measure how observed variables integrate latent factors is conceptually appealing and computationally straightforward. The two case studies address biologically meaningful questions and the reported findings, if valid, would be of interest to the neuroscience and genomics communities. However, the central measure is not identifiable from factor-analysis output under orthogonal rotations, and the case-study conclusions depend on a number of hand-picked analysis choices that are not adequately justified. The paper does not provide code or reproducible analysis scripts, but the analytical part is sufficiently explicit to be checked.
major comments (4)
- The O-information in Eq. (2) is not invariant under orthogonal rotations of the latent factors, but factor analysis identifies factors only up to an orthogonal rotation: the likelihood depends on LL^T, not on L individually. For a simple two-factor example with a single observed variable, loadings (0.7, 0.1) and (0.5, 0.5) give the same LL^T = 0.5 and the same observed covariance, yet Eq. (2) gives different values of Oinf. The manuscript does not state or justify any rotation convention; the actual analysis uses MATLAB's factoran, which applies a default rotation, so the reported rankings of -Oinf are properties of the chosen software rotation rather than of the data. This undermines the central claim that the procedure localizes 'synergies of hidden factors' as a well-defined system property. The authors must either fix and justify a rotation convention, demonstrate that the rankings are invariant across all orthogonal rotations, or replace Eq. (2) with a rotation-invariant quantity.
- The choice of the number of factors (fixed at 20) and the subsequent ad hoc removal of three factors 'mostly correlated to the common trend' are load-bearing analysis decisions. The text states that results are robust to slight variations of the number of factors, but no supporting sensitivity analysis is shown, and no objective criterion is given for excluding the three factors. Since the latent factors define the multiplet whose Oinf is computed, different factor counts or different exclusion rules could change the reported ranking of DMN and FP networks. The authors should provide a sensitivity analysis over factor numbers and a reproducible, data-driven rule for factor selection.
- For the HeLa analysis, PCA is substituted for factor analysis with only 48 time points, and the analysis uses PC2 and PC3 after discarding PC1, a choice made after observing that PC3 oscillates with a period close to 16 hours. This post hoc selection makes the reported ranking, including the top hit STK-12, conditional on the choice of components; no evidence is given that alternative components or a different number of retained components would yield similar results. In addition, the statistical significance of the synergies is assessed with permutation surrogates that ignore temporal autocorrelation in the 48 time points, which is likely to inflate significance for time series with strong autocorrelation. The authors should use block or Fourier-based surrogates that preserve the temporal structure, and they should demonstrate that the set of 24 significant genes and the top-ranking STK-12 are stable under alternative component selections.
- The fMRI analysis concatenates z-scored time series from 121 subjects into a single 18,392-sample matrix and then applies factor analysis to the pooled data. This treats all samples as exchangeable and mixes within-subject temporal structure with between-subject variability. No mixed-effects or random-effects analysis is provided, so the reported DMN/FP finding may reflect a subject-specific artifact rather than a general property of resting-state networks. The authors should either analyze subjects separately and then combine the resulting synergy maps, or apply a hierarchical model that accounts for subject identity.
minor comments (4)
- The sentence 'The 94 genes were selected, from the full dataset described in [21]' cites Hoerl and Kennard (1970), which is a statistics paper on ridge regression and not a gene expression dataset; presumably the intended reference is [20] (Whitfield et al.).
- The text says 'We applied the factor analysis function factoran of MATLAB to fit these four matrices', but only one concatenated matrix is described in the preceding paragraph; this is confusing and should be clarified.
- The figure captions do not specify the number of surrogates, the surrogate generation algorithm, or the exact Bonferroni correction threshold used to declare significance; this information should be added for reproducibility.
- Minor language issue: 'a recently introduced metrics' should be 'a recently introduced metric'.
Circularity Check
HeLa case-study conclusion is partly circular: PC3 is selected because it is cell-cycle-related and then STK-12's synergy with it is interpreted as cell-cycle control; the factor choice is imported from a self-cited prior analysis. The central O-information derivation itself is independent.
-
other
[Section III B, HeLa data]
"As described in [22], the first two principal components show exponentially decaying correlations whilst the third principal component seems to be connected with cell cycle as it shows oscillations with a period close to 16. We discard the first principal component and consider here the second and the third components to find the genes which exhibit synergy w.r.t. these two factors. The highest synergy is obtained in correspondence of STK-12 (Aurora Kinase B) ... our analysis shows that it may play a key role also in the control of HeLa cell cycle."
The latent factors used to define synergy are not chosen neutrally: PC3 is included specifically because it is cell-cycle-related. The subsequent finding that STK-12 is the most synergistic gene is then presented as evidence that STK-12 is involved in controlling the HeLa cell cycle. The conclusion is aligned with the selection criterion used to build the input factors; the ranking describes the chosen PCA subspace and is not an independent test of cell-cycle involvement.
-
self citation load bearing
[Section III B, citation [22]]
"As described in [22], the first two principal components show exponentially decaying correlations whilst the third principal component seems to be connected with cell cycle as it shows oscillations with a period close to 16."
The HeLa analysis would collapse without the premise that PC3 is a cell-cycle-related factor. That premise is taken from [22], whose authors include Stramaglia, an author of the present paper. The paper does not re-derive or independently verify this premise, and the main HeLa conclusion (STK-12's role in cell-cycle control) depends on it. This is a mild case of load-bearing self-citation, not a mathematical circularity.
full rationale
The mathematical core is self-contained: Eq. (2) is obtained by substituting Gaussian entropies into the O-information definition Eq. (1) under the stated collider model, and the negativity of Oinf is a theorem of that model, not an input disguised as a result. The general workflow (fit factor analysis or PCA, then compute -Oinf for each variable) is exploratory and descriptive; the paper makes no out-of-sample prediction, so there is no fitted-input-called-prediction problem at the methodological level. The fMRI case study is also largely free of circularity: fixing the factor count at 20 and removing three common-trend factors is a subjective modeling choice but not a self-referential reduction. The circularity is concentrated in the HeLa case study. There, the third principal component is included as a factor because it oscillates with a period close to 16 h, i.e., because it is cell-cycle-related, and the later conclusion that STK-12 is the most synergistic gene and 'may play a key role also in the control of HeLa cell cycle' is read off the same cell-cycle-aligned component. The conclusion is therefore partly encoded in the factor-selection step. Additionally, the cell-cycle attribution of PC3 is imported from [22], which shares an author with the present paper, making the selection step a mild load-bearing self-citation. Because the top gene is not logically forced by the selection (other genes could have had higher synergy within that subspace), the circularity is partial rather than complete. A separate rotation-invariance problem with Eq. (2) is a validity/identifiability issue, not a circularity, and is not scored here.
Assumptions & free parameters
free parameters (2)
- Number of fMRI latent factors =
20, reduced to 17 after removing 3 common-trend factors
- HeLa latent components =
PC2 and PC3 after discarding PC1
assumptions (5)
- standard math Multivariate Gaussian entropy formula H = 1/2 log[(2πe)^N det Sigma]
- domain assumption Observed variables follow x = L f + eta with independent unit-variance Gaussian factors and Gaussian noise
- domain assumption Negative O-information indicates net synergy, and this is the appropriate measure of joint factor influence
- domain assumption Factor scores estimated by maximum likelihood (or PCA components) can be used as the true latent variables in the per-variable O-information
- domain assumption Permuting target-region samples produces a valid null distribution for O-information
Cite this review
Pith. "Pith review of Localizing synergies of hidden factors across complex systems: resting brain networks and HeLa gene expression profile as case studies." pith.science (2026). https://pith.science/paper/ED5LMTUJ
@misc{pith2026250609053,
  author       = {Pith},
  title        = {Pith review of: Localizing synergies of hidden factors across complex systems: resting brain networks and HeLa gene expression profile as case studies},
  year         = {2026},
  howpublished = {\url{https://pith.science/paper/ED5LMTUJ}},
  note         = {Machine review of arXiv:2506.09053}
}
read the original abstract
Factor analysis is a well-known statistical method to describe the variability of observed variables in terms of a smaller number of unobserved latent variables called factors. Even though latent factors are conceptually independent of each other, their influence on the observed variables is often joint and synergistic. We propose to quantify the synergy of the joint influence of factors on the observed variables using the O-information, a recently introduced metrics to assess high order dependencies in complex systems, in a new framework where latent factors and observed variables are jointly analyzed in terms of their joint informational character. Two case studies are reported: analyzing resting fMRI data, we find that DMN and FP networks show the highest synergy, consistently with their crucial role in higher cognitive functions; concerning HeLa cells, we find that the most synergistic gene is STK-12 (AURKB), suggesting that this gene is involved in controlling the HeLa cell cycle. We believe that this approach, representing a bridge between factor analysis and the field of high-order interactions, will find wide application across several domains.
Figures


Reference graph
Works this paper leans on
-
[1]
S. Everitt. An Introduction to Latent Variable Model, Chapman and Hall, London, 1984
work page 1984
-
[2]
J. B. Carrol. Human Cognitive Abilities: A Survey of Factor-analytic Studies, Cambridge University Press, Cambridge, 1993
work page 1993
-
[3]
J. P. Stevens. Applied Multivariate Statistics for the Social Sciences, Psychology Press, Lon- don, 2002
work page 2002
-
[4]
H. H. Harman. Modern Factor Analysis, The University of Chicago Press, Chicago, 1976
work page 1976
-
[5]
D. Love, D. K. Hallbauer, A. Amos, R. K. Hranova. Physics and Chemistry of the Earth 29 (2004), 1135
work page 2004
-
[6]
D. W. Stewart. Journal of Marketing Research 18 (1981) 51
work page 1981
-
[7]
R. O. Duda, P. E. Hart, D. G. Stork. Pattern Classification, John Wiley & Sons, New York, 2001
work page 2001
-
[8]
M. E. Wall, A. Rechtsteiner, L. Rocha. Singular value decomposition and principal component analysis, in: D.Berrar, W.Dubitzky, M.Granzow(Eds.), A Practical Approach to Microarray Data Analysis, Kluwer Academic Publishers, 2003, pp.91–109
work page 2003
Show all 26 references
-
[9]
M. E. Tipping, C. M. Bishop. Journal of the Royal Statistical Society. Series B 21(1999), 611
1999
-
[10]
L., and Beer, R
Williams, P. L., and Beer, R. D. (2010). Nonnegative decomposition of multivariate informa- tion. ArXiv
2010
-
[11]
E., Mediano, P
Rosas, F. E., Mediano, P. A. M., Gastpar, M., and Jensen, H. J. (2019). Quantifying high- order interdependencies via multivariate extensions of the mutual information. Phys. Rev. E 100:032305
2019
-
[12]
Scagliarini et al
T. Scagliarini et al. Phys. Rev. Research 5, 013025 (2023) 10
2023
-
[13]
A., et al (2016)
Poldrack, R. A., et al (2016). A phenome-wide examination of neural and cognitive function. Scientific data, 3(1), 1-12
2016
-
[14]
Sannino, S
S. Sannino, S. Stramaglia, L. Lacasa, D. Marinazzo, Network Neuroscience (2017) 1 (3): 208–221
2017
-
[15]
Jenkinson, C.F
M. Jenkinson, C.F. Beckmann, T.E. Behrens, M.W. Woolrich, S.M. Smith. FSL. NeuroImage, 62:782-90, 2012
2012
-
[16]
T., Krienen, F
Yeo, B. T., Krienen, F. M., Sepulcre, J., Sabuncu, M. R., Lashkari, D., Hollinshead, M., et al (2011). The organization of the human cerebral cortex estimated by intrinsic functional connectivity. Journal of Neurophysiology, 106(3), 1125–1165
2011
-
[17]
Luppi et al, Nat Neurosci
A. Luppi et al, Nat Neurosci . 2022 June 01; 25(6): 771–782
2022
-
[18]
Scagliarini T, Sparacino L, Faes L, Marinazzo D and Stramaglia S (2024), Gradients of O- information highlight synergy and redundancy in physiological applications. Front. Netw. Physiol. 3:1335808
2024
-
[19]
F., Pope, M., Faskowitz, J
Varley, T. F., Pope, M., Faskowitz, J. et al. Multivariate information theory uncovers syner- gistic subsystems of the human cerebral cortex. Commun Biol 6, 451 (2023)
2023
-
[20]
M. L. Whitfield, et al., Molecular Biology of the Cell 13 (2002) 1977
2002
-
[21]
A. R. Hoerl, R. W. Kennard. Technometrics 12 (1970) 55
1970
-
[22]
Zamparo, S
M. Zamparo, S. Stramaglia, J.R. Banavar, and A. Maritan, Physica A 391 (2012) 3159–3169
2012
-
[23]
P., Tian C
Lin L., Wang S., Li X., He Q., Benz J. P., Tian C. (2019) STK-12 acts as a transcriptional brake to control the expression of cellulase-encoding genes in Neurospora crassa. PLoS Genet 15(11): e1008510
2019
-
[24]
Tang, J., Gautam, P., Gupta, A. et al. Network pharmacology modeling identifies synergistic Aurora B and ZAK interaction in triple-negative breast cancer. npj Syst Biol Appl 5, 20 (2019)
2019
-
[25]
J., Sato, T
Hwang, E. J., Sato, T. R., and Sato, T. K. (2021). A canonical scheme of bottom-up and top-down information flows in the frontoparietal network. Frontiers in neural circuits, 15, 691314
2021
-
[26]
Rosas et al., NATURE PHYSICS
F. Rosas et al., NATURE PHYSICS. 2022;18(5):476–7. 11
2022
Reviewed August 7, 2026 · model on record in the stance chip above.
Discussion (0). Sign in to comment.