REVIEW 3 major objections 5 minor 56 references
Isomorph invariance of dynamics of sheared glassy systems
T0 review · 3 major / 5 minor · reviewed 2026-08-14 · deepseek-v4-flash
Pith's one-line read The paper claims that isomorphs generated from potential-energy and virial fluctuations remain valid inside the glassy state: state points along a glassy isomorph have identical reduced-unit structure and steady-state shearing dynamics…
desk verdict First finite-temperature sheared-glass isomorph test: real empirical result, honest paper, but the aging assumption in generating the glass isomorphs is the load-bearing weakness. read the letter →
The pith
A machine-rendered reading of the paper's core claim, the machinery that carries it, and where it could break.
The reading
What carries the argument
The central object is the isomorph: a curve in the density–temperature plane along which reduced-unit structure and dynamics are invariant. Isomorphs are identified through hidden scale invariance, quantified by the correlation coefficient R between potential energy U and virial W fluctuations; the slope gamma = <$\Delta$ U $\Delta$ W> / <($\Delta$ U)^2> gives the configurational adiabat d ln T / d ln rho = gamma, integrated numerically to step between state points. Dynamics are probed by Couette shear via the SLLOD algorithm with Lees-Edwards boundary conditions, with the reduced strain rate gamma_dot_tilde = gamma_dot (T/m)^-1/2 $rho^{-1}$/3 held fixed along each isomorph. The avalanche analysis rests on histograms of reduced stress changes $\Delta$ $\sigma$ / (rho k_B T) over strain intervals, whose negative exponential tail marks correlated plastic events.
What would settle it
Generate the same glassy isomorph two ways — from the NVT potential-energy/virial fluctuations used here and from fluctuations measured during steady-state shearing at the same reduced strain rate — and compare the density–temperature pairs; systematic disagreement would show the equilibrium-based isomorphs are history-dependent. As a second check, run the shearing at each state point for several times more total strain and see whether the characteristic stress-decay strain continues to drift monotonically with density; a persistent drift beyond statistical error would mark a genuine limit of isomorph invariance.
Extended reading notes
Core claim
On the paper's own terms, the central discovery is that isomorphs generated in the glassy phase from equilibrium fluctuation formulas carry the dynamics of steady-state shearing: state points connected by the integration of d ln T / d ln rho = gamma, with gamma from potential-energy–virial correlations, have the same reduced-unit structure and the same statistical dynamics under shear, including the avalanche signature. The authors demonstrate this for two glassy isomorphs, one just below the glass transition and one deep in the glass, at nominal strain rates from $10^{-2}$ down to $10^{-5}$. The collapse holds for the mean flow stress, its standard deviation, the distribution of stress changes over strain intervals, and the transverse particle dynamics; the stress autocorrelation shows the poorest collapse, with a systematic decrease of the characteristic decay strain along the isomorph. The paper also identifies a hierarchy of strain scales — thermal/vibrational, avalanche, maximum-skewness, and correlation-decay — and shows that this structure is invariant along the isomorph.
Load-bearing premise
The load-bearing premise is that isomorphs can be generated inside the glass by ordinary NVT fluctuation formulas: the paper assumes aging is negligible during those runs, a point it explicitly flags in the section on future improvements, and if aging biases the potential-energy and virial fluctuations the resulting density–temperature pairs are not true isomorphs and the observed collapse could be approximate or coincidental.
Editorial extensions
If this is right
- Steady-state shearing of a glass is controlled by two variables, the isomorph coordinate and the reduced strain rate, rather than by density and temperature separately.
- Flow stress and its fluctuations are isomorph invariant in reduced units, so theories of glassy plasticity that treat temperature and density separately are incomplete.
- Avalanche statistics, read from the negative exponential tail of stress-change distributions, are unchanged along an isomorph at fixed reduced strain rate.
- Density dependence in existing flow-stress formulas can be absorbed into isomorph-invariant forms using the density-scaling function, and an alternative reduced-unit choice gives a well-behaved zero-temperature limit.
- Transverse particle diffusion is largely strain-rate controlled at low temperature, with thermal activation entering only on high-temperature isomorphs.
Reading between the lines
- A testable extension is to apply the same protocol to glass formers with weaker potential-energy/virial correlations: the quality of the stress-drop collapse would then serve as a quantitative predictor of how much density dependence a plasticity theory must contain.
- The hierarchy of strain scales the paper identifies — thermal/vibrational, avalanche, maximum-skewness, and correlation-decay — suggests that avalanche initiation and stress relaxation are governed by separate strain intervals roughly an order of magnitude apart, a separation that mesoscale plasticity models could target.
- Because the reduced flow stress differs by almost a factor of ten between the two isomorphs, the choice of reduced units is not neutral for comparing different isomorphs; the paper's alternative h(rho)-based units may be the more physical ones near zero temperature, a point worth testing on the same data.
Signed reviews
Editorial analysis
A structured set of objections, weighed in public.
Referee Report
Summary. This paper tests whether isomorph theory, developed for equilibrium liquids, applies to a sheared Kob-Andersen binary Lennard-Jones glass below the glass transition. The authors generate two glassy isomorphs by numerically integrating the configurational-adiabat equation, Eq. (4), using the potential-energy/virial fluctuation slope gamma from NVT simulations, starting from configurations cooled at constant pressure to T=0.55 and T=0.10. They then shear the glasses with SLLOD and Lees-Edwards boundary conditions at fixed reduced strain rates and compare, in reduced units, the radial distribution function, steady-state flow stress, stress fluctuations and their autocorrelation, stress-change histograms, transverse intermediate scattering functions, and mean-squared displacements. They report good collapse of most observables along each isomorph, including an exponential negative tail in the stress-change distribution that is interpreted as an avalanche signature and is claimed to be isomorph invariant. The paper also discusses how isomorph invariance constrains expressions for flow stress and proposes an alternative zero-temperature compatible reduced-unit system based on a density-scaling function h(rho).
Significance. If the main claim holds, the paper provides a nontrivial extension of isomorph theory into the non-equilibrium glassy regime, with practical consequences: structure and sheared dynamics, including avalanche statistics, would depend on density and temperature only through the isomorph and reduced strain rate, not separately. The test is genuinely predictive: the isomorphs are constructed from unsheared NVT fluctuations, while the tested observables come from independent sheared simulations, and the main collapse is not a fit. The paper is also refreshingly explicit about its limitations, flagging the aging assumption and the imperfect collapse of the stress autocorrelation. However, the evidence for the central claim is weakened by an unverified assumption in the construction of the high-temperature isomorph, a systematic unexplained drift in one key fit parameter, and the absence of any quantitative measure of collapse. With those points addressed, the result would be a solid contribution to the glassy-dynamics and isomorph-theory literature.
major comments (3)
- [Sec. IV, Eq. (5); Sec. VII C(1); Conclusion]
- [Sec. V, Fig. 6]
- [Secs. V and VI, Figs. 4, 5, 7, 8, 11, 12]
minor comments (5)
- [Sec. II A]
- [Sec. VII A, Eq. (9)]
- [Sec. III, Fig. 1 and Sec. IV]
- [Sec. V, Fig. 4 caption]
- [References]
Circularity Check
No significant circularity: the isomorphs are constructed from NVT potential-energy and virial fluctuations, while the tested sheared dynamics are independent predictions.
full rationale
The paper's central claim is that steady-state sheared dynamics are invariant along isomorphs in the glassy state. The isomorphs themselves are generated from Eq. (4) and Eq. (5) using the fluctuation-determined slope γ from NVT simulations of U and W; no sheared-dynamics observable enters this construction. The subsequent collapses of the radial distribution function, flow stress, stress-drop histograms, skewness, intermediate scattering function, and mean squared displacement are therefore genuine predictions rather than fits. The compressed-exponential and skewness analyses are auxiliary characterizations and do not define the isomorphs. The paper's reliance on prior isomorph theory by the same authors supplies the theoretical framework, but the framework is tested on new, previously unstudied glassy shear data, so it is not load-bearing circularity. The manuscript explicitly flags the assumption that aging is negligible when using equilibrium fluctuation formulas in the glass (Sec. IV and Sec. VII C(1)); this is an acknowledged limitation and a potential correctness risk, especially for the higher-temperature isomorph, but it is not a circular step because the tested quantities are not used to define the isomorphs. Overall, the derivation chain is self-contained with respect to the claimed invariance prediction.
Assumptions & free parameters
free parameters (2)
- epsilon_c (characteristic strain in compressed exponential fit) =
0.01 to 0.035
- beta (compression exponent) =
1.3 to 1.5 for stress autocorrelation; about 0.85 to 1.0 for ISF fits
assumptions (4)
- domain assumption Isomorphs are curves of constant excess entropy; Eq. (4) d ln T/d ln rho = gamma(rho,T) remains valid in the glassy state.
- domain assumption Aging is negligible during the NVT runs used to measure U and W fluctuations.
- domain assumption The Kob-Andersen system has good hidden scale invariance in the glassy phase despite R values as low as 0.82.
- domain assumption After 50% strain, the sheared system reaches a steady state depending only on rho, T, and reduced strain rate.
Cite this review
Pith. "Pith review of Isomorph invariance of dynamics of sheared glassy systems." pith.science (2026). https://pith.science/paper/EQ3S54IO
@misc{pith2026190806722,
  author       = {Pith},
  title        = {Pith review of: Isomorph invariance of dynamics of sheared glassy systems},
  year         = {2026},
  howpublished = {\url{https://pith.science/paper/EQ3S54IO}},
  note         = {Machine review of arXiv:1908.06722}
}
read the original abstract
We study hidden scale invariance in the glassy phase of the Kob-Andersen binary Lennard-Jones system. After cooling below the glass transition, we generate a so-called isomorph from the fluctuations of potential energy and virial in the NVT ensemble -- a set of density, temperature pairs for which structure and dynamics are identical when expressed in appropriate reduced units. To access dynamical features we shear the system using the SLLOD algorithm coupled with Lees-Edwards boundary conditions, and study the statistics of stress fluctuations and the particle displacements transverse to the shearing direction. We find good collapse of the statistical data showing that isomorph theory works well in this regime. The analysis of stress fluctuations, in particular the distribution of stress changes over a given strain interval, allows us to identify a clear signature of avalanche behavior in the form of an exponential tail on the negative side. This feature is also isomorph invariant. The implications of isomorphs for theories of plasticity are discussed briefly.
Figures


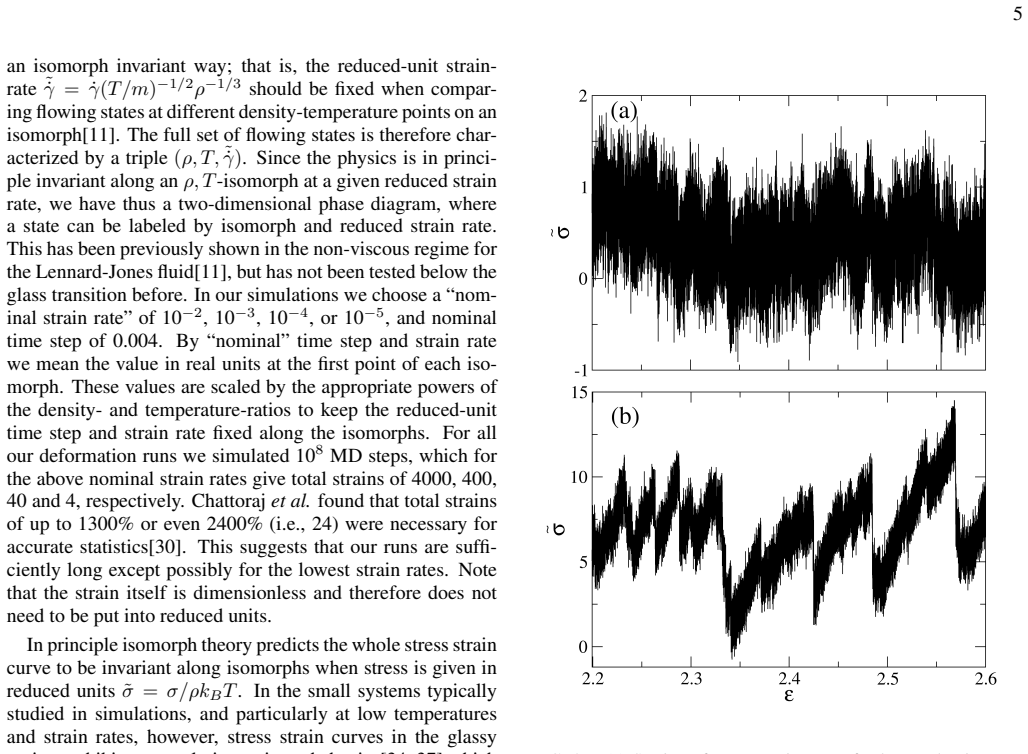
Figures from the paper (10 more)


Reference graph
Works this paper leans on
-
[1]
The smallest strain scales where stress fluctuations are purely thermal/vibrational
- [2]
-
[3]
The strain over which stress change distributions de- viate most from Gaussianity, εs, an order of magni- tude larger than εa. Here the exponential tails of the avalanches, and the changes due elastic loading be- tween them, merge to make a broader distribution, but signs of correlation remain
-
[4]
The characteristic strain εc identified via the stress au- tocorrelation function.εc is of order 2× 10⁻² which is a small factor (2-3) larger thanεs
-
[5]
Finally there the strain interval around 5× 10⁻² be- yond which all correlation has vanished (though this is not physically independent fromεc; rather it represents where the autocorrelation function is small compared to 1/e). VI. PARTICLE DYNAMICS UNDER SHEAR: TRANSVERSE DIFFUSIVITY As an alternative probe of dynamical processes under steady state sheari...
-
[6]
N. P. Bailey, T. Christensen, B. Jakobsen, K. Niss, N. B. Olsen, U. R. Pedersen, T. B. Schrøder, and J. C. Dyre, J. Phys.: Con- dens. Matter 20, 244113 (2008)
work page 2008
-
[7]
N. P. Bailey, U. R. Pedersen, N. Gnan, T. B. Schrøder, and J. C. Dyre, J. Chem. Phys. 129, 184507 (2008)
work page 2008
-
[8]
N. P. Bailey, U. R. Pedersen, N. Gnan, T. B. Schrøder, and J. C. Dyre, J. Chem. Phys. 129, 184508 (2008)
work page 2008
Show all 56 references
-
[9]
T. B. Schrøder, N. P. Bailey, U. R. Pedersen, N. Gnan, and J. C. Dyre, J. Chem. Phys. 131, 234503 (2009)
2009
-
[10]
N. Gnan, T. B. Schrøder, U. R. Pedersen, N. P. Bailey, and J. C. Dyre, J. Chem. Phys. 131, 234504 (2009)
2009
-
[11]
T. B. Schrøder, N. Gnan, U. R. Pedersen, N. P. Bailey, and J. C. Dyre, J. Chem. Phys. 134, 164505 (2011)
2011
-
[12]
T. S. Ingebrigtsen, T. B. Schrøder, and J. C. Dyre, Phys. Rev. X 2, 011011 (2012)
2012
-
[13]
T. S. Ingebrigtsen, T. B. Schrøder, and J. C. Dyre, J. Phys. Chem. B 116, 1018 (2012)
2012
-
[14]
Bøhling, T
L. Bøhling, T. S. Ingebrigtsen, A. Grzybowski, M. Paluch, J. C. Dyre, and T. B. Schrøder, New J. Phys.14, 113035 (2012)
2012
-
[15]
A. A. Veldhorst, J. C. Dyre, and T. B. Schrøder, J. Chem. Phys. 141, 054904 (2014)
2014
-
[16]
Separdar, N
L. Separdar, N. P. Bailey, T. B. Schrøder, S. Davatolhagh, and J. C. Dyre, J. Chem. Phys. 138, 154505 (2013)
2013
-
[17]
N. Gnan, C. Maggi, T. B. Schrøder, and J. C. Dyre, Phys. Rev. Lett. 104, 125902 (2010)
2010
-
[18]
J. C. Dyre, J. chem. Phys. 148, 154502 (2018)
2018
-
[19]
Lerner, N
E. Lerner, N. P. Bailey, and J. C. Dyre, Phys. Rev. E90, 052304 (2014)
2014
-
[20]
J. C. Dyre, J. Phys. Chem. B 118, 10007 (2014)
2014
-
[21]
J. C. Dyre, J. Phys.: Condens. Mat. 28, 323001 (2016)
2016
-
[22]
Lerner and I
E. Lerner and I. Procaccia, Phys. Rev. E 80, 026128 (2009)
2009
-
[23]
Kob and H
W. Kob and H. C. Andersen, Phys. Rev. Lett. 73, 1376 (1994)
1994
-
[24]
Kob and H
W. Kob and H. C. Andersen, Phys. Rev. E 51, 4626 (1995)
1995
-
[25]
Kob and H
W. Kob and H. C. Andersen, Phys. Rev. E 52, 4134 (1995)
1995
-
[26]
Toxvaerd, U
S. Toxvaerd, U. R. Pedersen, T. B. Schrøder, and J. C. Dyre, J. Chem. Phys. 130, 224501 (2009)
2009
-
[27]
T. S. Ingebrigtsen, J. C. Dyre, T. B. Schrøder, and C. P. Royall (2018), arxiv/1804.01378
2018 arXiv
-
[28]
T. B. Schrøder and J. C. Dyre, J. Chem. Phys. 141, 204502 (2014)
2014
-
[29]
M. P. Allen and D. J. Tildesley,Computer Simulation of Liquids (Oxford University Press, 1987)
1987
-
[30]
U. R. Pedersen, N. P. Bailey, T. B. Schrøder, and J. C. Dyre, Phys. Rev. Lett. 100, 015701 (2008). 14
2008
-
[31]
Hummel, G
F. Hummel, G. Kresse, J. C. Dyre, and U. R. Pedersen, Phys. Rev. B 92, 174116 (2015)
2015
-
[32]
Toxvaerd and J
S. Toxvaerd and J. C. Dyre, J. Chem. Phys.134, 081102 (2011)
2011
-
[33]
N. P. Bailey, J. S. Ingebrigtsen, T. S. amd Hansen, A. A. Veld- horst, L. Bøhling, C. A. Lemarchand, A. E. Olsen, L. Bacher, A. K. Costigliola, H. Pedersen, U. R. Larsen, J. C. Dyre, and T. B. Schrøder, SciPost Phys. 3, 038 (2017)
2017
-
[34]
(2018), RUMD software, version 3.3, is freely available at http://rumd.org
2018
-
[35]
Chattoraj, C
J. Chattoraj, C. Caroli, and A. Lema ˆıtre, Phys. Rev. E 84, 011501 (2011)
2011
-
[36]
Kob and J.-L
W. Kob and J.-L. Barrat, Eur. Phys. J. B 13, 319 (2000)
2000
-
[37]
D. J. Evans and G. P. Morriss, Phys. Rev. A 30, 1528 (1984)
1984
-
[38]
A. J. C. Ladd, Mol. Phys. 53, 459 (1984)
1984
-
[39]
D. L. Malandro and D. J. Lacks, Phys. Rev. Lett. 81, 5576 (1998)
1998
-
[40]
Maloney and A
C. Maloney and A. Lema ˆıtre, Phys. Rev. Lett. 93, 016001 (2004)
2004
-
[41]
C. E. Maloney and A. Lema ˆıtre, Phys. Rev. E 74, 016118 (2006)
2006
-
[42]
N. P. Bailey, J. Schiøtz, A. Lemaˆıtre, and K. W. Jacobsen, Phys. Rev. Lett. 98, 095501 (2007)
2007
-
[43]
Berthier and J.-L
L. Berthier and J.-L. Barrat, J. Chem. Phys. 116, 6228 (2002)
2002
-
[44]
V oigtmann, Curr
T. V oigtmann, Curr. Opin. Colloid In.19, 549 (2014)
2014
-
[45]
Lerner and I
E. Lerner and I. Procaccia, Phys. Rev. E 79, 066109 (2009)
2009
- [46]
-
[47]
Chattoraj, C
J. Chattoraj, C. Caroli, and A. Lema ˆıtre, Phys. Rev. Lett. 105, 266001 (2010)
2010
-
[48]
Rottler and M
J. Rottler and M. O. Robbins, Phys. Rev. E. 68, 011507 (2003)
2003
-
[49]
Lema ˆıtre and C
A. Lema ˆıtre and C. Caroli, Phys. Rev. E76, 036104 (2007)
2007
-
[50]
Lemaˆıtre and C
A. Lemaˆıtre and C. Caroli, Phys. Rev. Lett.103, 065501 (2009)
2009
-
[51]
Karmakar, E
S. Karmakar, E. Lerner, I. Procaccia, and J. Zylberg, Phys. Rev. E 82, 031301 (2010)
2010
-
[52]
H. G. E. Hentschel, S. Karmakar, E. Lerner, and I. Procaccia, Phys. Rev. Lett. 104, 025501 (2010)
2010
-
[53]
T. S. Ingebrigtsen, L. Bøhling, T. B. Schrøder, and J. C. Dyre, J. Chem. Phys. 136, 061102 (2012)
2012
-
[54]
Bøhling, N
L. Bøhling, N. P. Bailey, T. B. Schrøder, and J. C. Dyre, J. Chem. Phys. 140, 124510 (2014)
2014
-
[55]
T. B. Schrøder, private communication (2019)
2019
-
[56]
Note that this would presumably also happen even without any deformation by waiting long enough for liquid dynamics to be- come relevant — in that case time, rather than strain, becomes the relevant parameter
Reviewed August 14, 2026 · model on record in the stance chip above.
Discussion (0). Continue with ORCID to comment.