REVIEW 4 major objections 6 minor 21 references
A New Way: Kronecker-Factored Approximate Curvature Deep Hedging and its Benefits
T0 review · 4 major / 6 minor · reviewed 2026-08-12 · deepseek-v4-flash
Pith's one-line read This paper argues that substituting K-FAC for Adam in an LSTM deep hedging model trained on simulated Heston paths cuts mean transaction costs by 78.3% and P&L variance by 34.4%.
desk verdict Honest incremental extension of existing K-FAC deep hedging work, undermined by a single training run and an abstract that overstates a non-significant P&L result. read the letter →
The pith
A machine-rendered reading of the paper's core claim, the machinery that carries it, and where it could break.
The reading
What carries the argument
K-FAC is the load-bearing mechanism. It approximates the Fisher information matrix for a network's parameters as a Kronecker product of smaller activation and gradient covariance matrices, making a second-order parameter update roughly linear rather than cubic in layer size. The model passes normalized asset price and volatility sequences into an LSTM and then a fully connected output layer with tanh activation that emits hedge ratios in [-1, 1]; K-FAC is applied to that fully connected layer. This curvature information, which Adam does not use, is what the paper identifies as the source of accelerated convergence and reduced transaction costs.
What would settle it
Re-run the same experiment with, say, 20 independent random seeds and the same Heston parameters, hyperparameters, and 100-epoch schedule; if the K-FAC mean transaction cost is not consistently below the Adam mean with a cross-seed confidence interval that excludes zero, and if the P&L variance reduction is not consistently replicated, the paper's headline numbers are a single-run artifact rather than a stable property of the method.
Extended reading notes
Core claim
On the paper's own terms, the central claim is that K-FAC, applied to the output layer of an LSTM deep-hedging network, learns hedge positions that are cheaper and more stable than those learned by Adam on simulated Heston paths. K-FAC estimates the Fisher information matrix as a Kronecker product of small covariance matrices and uses that curvature information to scale parameter updates; the paper credits this with smoother hedge-ratio adjustments and lower rebalancing costs. The paper takes the results as evidence that second-order optimization can be integrated into recurrent deep hedging without a training-time penalty, despite the method's extra per-step computation.
Load-bearing premise
The load-bearing premise is that the hypothesis test in Section 4.5.1 treats every hedged path in one training run as an independent observation drawn from a single seed; if paths within a run are correlated or that seed is not representative, the 78.3 percent transaction-cost reduction is not established as a general property.
Editorial extensions
If this is right
- If the central claim holds, a K-FAC-trained deep hedging model can rebalance less often and pay lower transaction costs without sacrificing hedging quality.
- The reported convergence acceleration suggests practitioners could retrain the model more frequently under changing market conditions at a similar wall-clock cost.
- Because K-FAC is applied only to the final fully connected layer, extending second-order updates to the full LSTM is a natural next step that could yield additional gains, as the paper itself notes.
- A positive Sharpe ratio, if reproducible, would support the use of K-FAC-trained hedges in settings where risk-adjusted return matters.
Reading between the lines
- The headline percentages are point estimates from one random seed; repeating the comparison over multiple seeds would produce a confidence interval for the 78.3 percent transaction-cost reduction, which the paper does not provide.
- A natural extension is to benchmark K-FAC against other curvature-aware or adaptive optimizers on the same Heston task, which would show whether the advantage comes from second-order information generally or from K-FAC's specific Kronecker structure.
- Testing the trained hedge policies on historical or intraday data with a market-impact transaction cost model would reveal whether the smooth hedge ratios survive realistic price dynamics and frictions.
Editorial analysis
A structured set of objections, weighed in public.
Referee Report
Summary. The paper proposes integrating Kronecker-Factored Approximate Curvature (K-FAC) second-order optimization into an LSTM-based deep hedging model trained on simulated Heston stochastic volatility paths, and compares it with Adam optimization. The reported results claim a 78.3% reduction in mean transaction costs and a 34.4% reduction in P&L variance, along with a higher Sharpe ratio and faster convergence. The experiments use a single simulated dataset with separate training/validation sets, and statistical significance is assessed with t-tests across validation paths. Code is provided on GitHub.
Significance. If the empirical claims were fully supported, the paper would offer a practically relevant result: second-order optimization could materially improve deep hedging training. The manuscript has some strengths: it uses a standard Heston model, provides a public code repository, and the main text in Section 4.5.1 and Section 5.1 honestly reports that the P&L differential is non-significant. However, the abstract headlines the non-significant 34.4% P&L variance reduction, the entire comparison rests on a single training run with no repeated seeds, and key hyperparameters and loss weights are not reported. These issues currently undermine the load-bearing claims.
major comments (4)
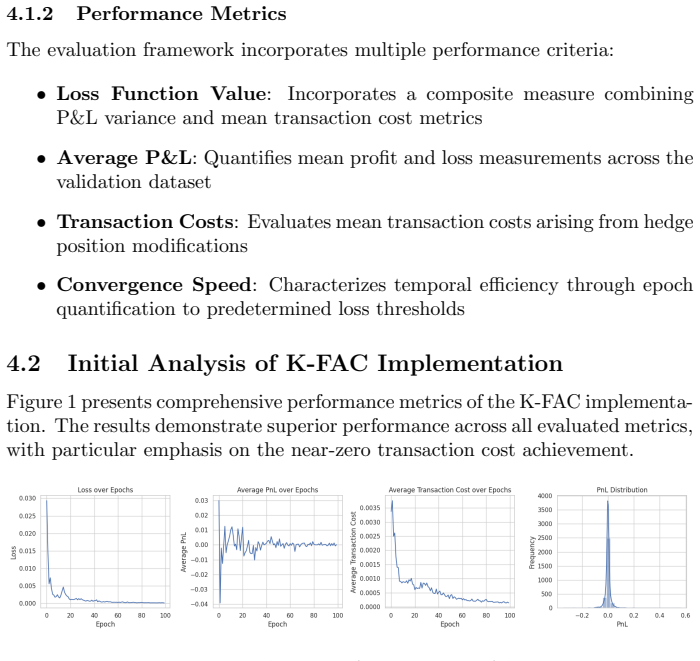
- [Abstract and Section 4.5.1, Table 1] The abstract's prominent claim of a 34.4% decrease in P&L variance is directly contradicted by the paper's own statistical test in Section 4.5.1, Table 1, which reports t = -1.5372 and p = 0.1243, i.e., non-significant. A non-significant result should not be headlined as a key benefit. The abstract and introduction should be revised to present the transaction-cost reduction as the statistically supported effect and to explicitly state that the P&L variance improvement is not significant in the reported experiment.
- [Section 4.5.1 and Table 2] The t-tests are computed across validation hedging paths within a single training run of each optimizer. Because all paths share the same fitted weights and the same simulated market, these observations are not independent replicates; the test does not estimate the variability of the optimizer-induced improvement across training runs or random seeds. The headline magnitudes (78.3% transaction-cost reduction, 34.4% P&L variance reduction) therefore have no error bars or generalization guarantee. The paper should report results over multiple independent training runs or seeds, with paired comparisons across runs, before claiming practical benefit in Sections 5.2 and 5.5.
- [Section 3.3.2 and Section 4.1.1] The K-FAC implementation is applied only to the fully connected output layer, yet no K-FAC hyperparameters are given (e.g., damping parameter, learning rate, update frequency, covariance estimation window), and the composite loss weights in Section 4.1.2 are not specified. Without these details, the empirical comparison between K-FAC and Adam may reflect hidden configuration differences rather than an optimizer effect. The manuscript must state all optimizer hyperparameters and the exact loss weighting used in the experiments.
- [Section 4.1.2 and Section 5.1] The metrics used to demonstrate 'hedging efficacy' (P&L variance and transaction costs) are the same components used to define the training loss. Reporting that K-FAC achieves lower values of these metrics partly restates that K-FAC minimized the training objective better than Adam. To support the claim of practical hedging benefit, the authors should add an independent evaluation, such as out-of-sample expected utility, expected shortfall, or a transaction-cost model that was not part of the training objective.
minor comments (6)
- [Section 3.1.1, Eq. (1)] The notation for the Wiener processes, W^S_t and W^V_t, is typeset in a confusing way in the PDF; please use consistent subscripts/superscripts throughout.
- [Section 3.4.3] The number of training and validation paths is never stated. Please report these dataset sizes for reproducibility.
- [References [19] and [22]] References [19] and [22] appear to describe the same work, 'Fast Deep Hedging with Second-Order Optimization'; please disambiguate or consolidate them to avoid duplicate citation.
- [Figures 1-5] The figures are referenced but not embedded or captioned in the text as submitted; please include the actual figures with descriptive captions.
- [Section 4.1.2 and Table 2] The Sharpe ratio calculation is not defined (e.g., whether a risk-free rate is used and whether the ratio is annualized), and the values 0.0401 and -0.0025 are reported without confidence intervals or significance tests.
- [Abstract and Table 1] The abstract reports p < 0.001 for the transaction-cost t-statistic, while Table 1 lists p = 0.0000; please use a consistent and conventional format such as p < 0.001.
Circularity Check
No circularity: the reported K-FAC vs Adam gains are empirical outputs of a held-out simulation benchmark, not quantities fixed by the loss definition or by self-citation.
full rationale
No load-bearing circular step is present. The paper is an empirical optimizer comparison: an LSTM deep-hedging policy is trained with K-FAC (applied to the fully connected output layer) and with Adam on the same simulated Heston paths, and the claimed improvements (78.3% transaction-cost reduction: 0.000745 vs 0.003432; 34.4% P&L-variance reduction: 0.002084 vs 0.003176) are measured validation metrics, not quantities set by construction. It is true that the composite training loss defined in Section 4.1.2 ('a composite measure combining P&L variance and mean transaction cost metrics') overlaps with the evaluation metrics, so the evaluation partly restates the training objective. However, both optimizers minimize the same objective, and which optimizer attains a lower value, on held-out simulated paths, after 100 epochs is an empirical training outcome rather than a definitional equivalence. There is no equation in the paper that reduces the reported improvements to their own inputs. The K-FAC method itself is attributed to external prior work (Martens and Grosse, 2015; Grosse and Martens, 2016), and the prior 'Fast Deep Hedging with Second-Order Optimization' references ([19], [22]) are not authored by the present author, so no load-bearing self-citation chain is invoked, and no uniqueness theorem or ansatz is imported from the author's own prior work. Concerns that the statistical test is computed over paths within a single training run, that the P&L-variance difference is non-significant (p = 0.124 in Table 1), that K-FAC is limited to the output layer, and that K-FAC hyperparameters are not reported are correctness, reproducibility, and generalization concerns, not circularity; under the review rules they do not raise the circularity score.
Assumptions & free parameters
free parameters (3)
- Heston simulation parameter set =
S0=100, V0=0.04, theta=0.04, kappa=2.0, xi=0.5, rho=-0.7, dt=1/250, T=1y
- Optimizer hyperparameters =
Adam LR 1e-3, weight decay 1e-4, batch size 32, 100 epochs; K-FAC details unspecified
- Composite loss weighting =
Unspecified
assumptions (4)
- domain assumption The Heston stochastic volatility model is the correct data-generating process for evaluating hedging strategies.
- domain assumption Euler-Maruyama discretization with dt=1/250 provides sufficiently accurate simulated paths.
- ad hoc to paper Applying K-FAC only to the fully connected output layer is a sufficient approximation for an LSTM-based deep hedging model.
- domain assumption Path-level observations are independent for the t-tests in Section 4.5.1.
Cite this review
Pith. "Pith review of A New Way: Kronecker-Factored Approximate Curvature Deep Hedging and its Benefits." pith.science (2026). https://pith.science/paper/EWILZTQW
@misc{pith2026241115002,
  author       = {Pith},
  title        = {Pith review of: A New Way: Kronecker-Factored Approximate Curvature Deep Hedging and its Benefits},
  year         = {2026},
  howpublished = {\url{https://pith.science/paper/EWILZTQW}},
  note         = {Machine review of arXiv:2411.15002}
}
abstract
This paper advances the computational efficiency of Deep Hedging frameworks through the novel integration of Kronecker-Factored Approximate Curvature (K-FAC) optimization. While recent literature has established Deep Hedging as a data-driven alternative to traditional risk management strategies, the computational burden of training neural networks with first-order methods remains a significant impediment to practical implementation. The proposed architecture couples Long Short-Term Memory (LSTM) networks with K-FAC second-order optimization, specifically addressing the challenges of sequential financial data and curvature estimation in recurrent networks. Empirical validation using simulated paths from a calibrated Heston stochastic volatility model demonstrates that the K-FAC implementation achieves marked improvements in convergence dynamics and hedging efficacy. The methodology yields a 78.3% reduction in transaction costs ($t = 56.88$, $p < 0.001$) and a 34.4% decrease in profit and loss (P&L) variance compared to Adam optimization. Moreover, the K-FAC-enhanced model exhibits superior risk-adjusted performance with a Sharpe ratio of 0.0401, contrasting with $-0.0025$ for the baseline model. These results provide compelling evidence that second-order optimization methods can materially enhance the tractability of Deep Hedging implementations. The findings contribute to the growing literature on computational methods in quantitative finance while highlighting the potential for advanced optimization techniques to bridge the gap between theoretical frameworks and practical applications in financial markets.
Figures


Figures from the paper (2 more)


Reference graph
Works this paper leans on
-
[1]
Heston, S. L. (1993). A Closed-Form Solution for Options with Stochastic Volatility with Applications to Bond and Currency Options. The Review of Financial Studies , 6(2), 327-343
work page 1993
-
[2]
Kloeden, P. E., Platen, E. (1992). Numerical Solution of Stochastic Differ- ential Equations . Springer-Verlag
work page 1992
-
[3]
Glasserman, P. (2004). Monte Carlo Methods in Financial Engineering . Springer
work page 2004
-
[4]
Hochreiter, S., Schmidhuber, J. (1997). Long Short-Term Memory. Neural Computation, 9(8), 1735-1780
work page 1997
-
[5]
Siami-Namini, S., Tavakoli, N., Siami Namin, A. (2018). A Comparison of ARIMA and LSTM in Forecasting Time Series. 2018 17th IEEE In- ternational Conference on Machine Learning and Applications (ICMLA) , 1394-1401
work page 2018
-
[6]
LeCun, Y., Bengio, Y., Hinton, G. (2015). Deep Learning. Nature, 521(7553), 436-444
work page 2015
-
[7]
Saxe, A. M., McClelland, J. L., Ganguli, S. (2014). Exact Solutions to the Nonlinear Dynamics of Learning in Deep Linear Neural Networks. Inter- national Conference on Learning Representations . 14
work page 2014
-
[9]
Grosse, R., Martens, J. (2016). A Kronecker-Factored Approximate Fisher Matrix for Convolution Layers. In Proceedings of the 33rd International Conference on Machine Learning
work page 2016
Show all 21 references
-
[10]
P., Ba, J
Kingma, D. P., Ba, J. (2014). Adam: A Method for Stochastic Optimiza- tion. arXiv preprint arXiv:1412.6980
2014 arXiv
-
[11]
J., Sheppard, K
Patton, A. J., Sheppard, K. (2015). Good Volatility, Bad Volatility: Signed Jumps and the Persistence of Volatility. The Review of Economics and Statistics, 97(3), 683-697
2015
-
[12]
Goodfellow, I., Bengio, Y., Courville, A. (2016). Deep Learning. MIT Press
2016
-
[13]
Chen, T., He, T., Benesty, M., et al. (2018). Neural Network Optimization with Deep Reinforcement Learning. Journal of Computational Finance , 21(1), 71-90
2018
-
[14]
Buehler, H., Gonon, L., Teichmann, J., Wood, B. (2019). Deep Hedging. Quantitative Finance, 19(8), 1271-1291
2019
-
[15]
Martens, J., Grosse, R. (2015). Optimizing Neural Networks with Kronecker-Factored Approximate Curvature. In Proceedings of the 32nd International Conference on Machine Learning (pp. 2408-2417)
2015
-
[16]
N., Ritter, G
Kolm, P. N., Ritter, G. (2019). Dynamic Replication and Hedging: A Re- inforcement Learning Approach. The Journal of Financial Data Science , 1(1), 159-171
2019
-
[17]
Han, J., Long, J. (2020). Convergence of Deep BSDE Method for Coupled FBSDEs. Probability, Uncertainty and Quantitative Risk , 5(1), 1-33
2020
-
[18]
Yang, S., Yu, Q. (2018). Pricing and Hedging of Derivatives in Financial Markets: A Deep Learning Approach. arXiv preprint arXiv:1802.03042
2018 arXiv
-
[19]
J.P. Morgan. (2024). Fast Deep Hedging with Second-Order Optimization
2024
-
[20]
L., Bach, F
Schmidt, M., Roux, N. L., Bach, F. (2019). Deep Learning and Optimiza- tion in Financial Engineering. Financial Markets and Portfolio Manage- ment, 33(4), 375-402
2019
-
[21]
N., Topin, N
Smith, L. N., Topin, N. (2018). A Disciplined Approach to Neural Network Optimization. arXiv preprint arXiv:1803.09820
2018 arXiv
-
[22]
Mueller, K., Akkari, A., Gonon, L., Wood, B. (2024). Fast Deep Hedging with Second-Order Optimization. arXiv preprint arXiv:2410.22568 . 15 7 Code Availability The implementation of the K-F AC optimizer and Deep Hedging model, including all relevant scripts and configuration f...
2024 arXiv
Reviewed August 12, 2026 · model on record in the stance chip above.
Discussion (0). Continue with ORCID to comment.