REVIEW 3 major objections 3 minor 95 references
This paper proves that raw cognitive-screening scores can be guaranteed to outperform demographically-corrected scores in classification accuracy, under three explicit conditions, and that corrections fail to guarantee fairness.
Reviewed by Pith at T0; open to challenge. T0 means a machine referee read the full paper against a public rubric. the ladder, T0–T4 →
T0 review · deepseek-v4-flash
2026-08-02 09:21 UTC pith:EY5QA3SH
load-bearing objection Genuinely useful framework and a real step forward for continuous scores, but the main theorem's proof breaks down for discrete scores — and the application is discrete. the 3 major comments →
On the choice of using raw or demographically-corrected scores
The pith
A machine-rendered reading of the paper's core claim, the machinery that carries it, and where it could break.
Core claim
The central claim is Theorem 1. For a fixed false-positive rate α, the difference between the raw and corrected ROC curves is bounded below by an expectation involving the joint likelihood ratio of (X,V) and the covariate-specific false-positive rate; when the co-monotonicity assumption holds, the weighted Chebyshev inequality forces that lower bound nonnegative. Thus raw scores dominate corrected scores pointwise in the ROC plane. The proof works for discrete and continuous scores and for a general class of corrections (Definition 1), and a multivariate extension is given in Appendix C. Under the symmetric counter-monotonicity assumption, corrected scores dominate instead, and if both hold
What carries the argument
The machinery is the comparison of marginal ROC curves through covariate-specific ROC curves, whose slopes are likelihood ratios. Because a correction is an increasing transformation within each demographic stratum, covariate-specific ROC curves of raw and corrected scores coincide (Lemma 1); the marginal comparison therefore reduces to a covariance between the likelihood ratio and the deviation of the stratum-specific false-positive rate from the marginal rate. The decisive tool is the weighted Chebyshev inequality, applied under the probabilistic co-monotonicity condition (Assumption 3), which says the demographic gradient in raw scores among healthy people and the demographic gradient in
Load-bearing premise
The load-bearing premise is Assumption 3, probabilistic co-monotonicity: among healthy people the demographic group with lower raw scores must also be the group in which impairment is more likely at a fixed raw score; if those two gradients ever point in opposite directions, the proof's Chebyshev step changes sign and corrected scores can be the better classifier.
What would settle it
Find a large cohort in which, among cognitively healthy people, older age is associated with lower raw scores, but conditional on a fixed raw score older age is associated with lower (not higher) dementia prevalence — then Assumption 3 fails at that threshold and the predicted raw-score edge need not appear. Equivalently, a precise estimate of the lower bound τ(α) that is significantly negative at any false-positive rate α would directly contradict Theorem 1's sufficient condition applied to that setting.
If this is right
- If Assumption 3 holds at every false-positive rate, the area under the ROC curve of the raw score is at least that of the corrected score (Corollary 3).
- If Assumption 4 (counter-monotonicity) holds instead, the corrected score wins; when both hold, raw and corrected scores have identical marginal ROC curves.
- A well-designed correction equalizes false-positive rates across demographic groups but need not equalize true-positive rates; demographic corrections therefore do not by themselves deliver demographic insensitivity of decisions.
- The results give a nonparametric explanation for the repeated empirical finding that age and education corrections do not improve dementia screening accuracy.
- In the open neuroimaging dataset analyzed, point estimates of the lower bound favor raw scores at most thresholds, though the nonparametric confidence intervals include zero; a parametric model gives significant evidence for raw-score superiority and for Assumption 3.
Where Pith is reading between the lines
- A natural next step is a pre-registered accuracy study that estimates the lower bound τ(α) with enough precision to settle the sign; the paper's inequality turns that sign into a decision rule.
- The same inequality could be used to decide when to keep or drop demographic corrections in other fields — kidney-function, osteoporosis, lung-function, and cardiovascular risk scores all have analogous demographic adjustments.
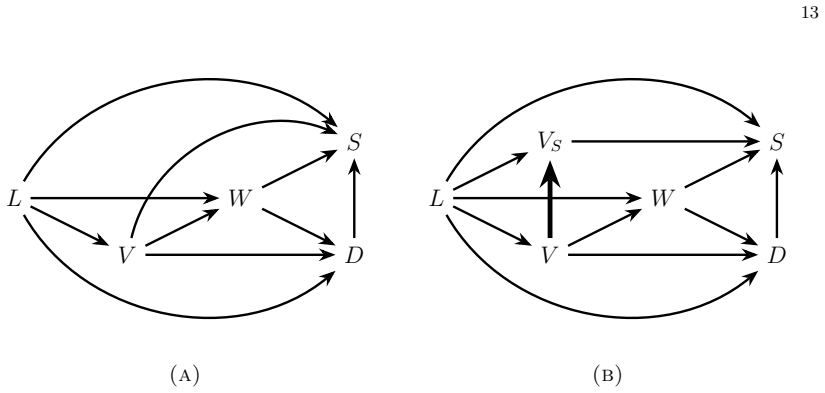
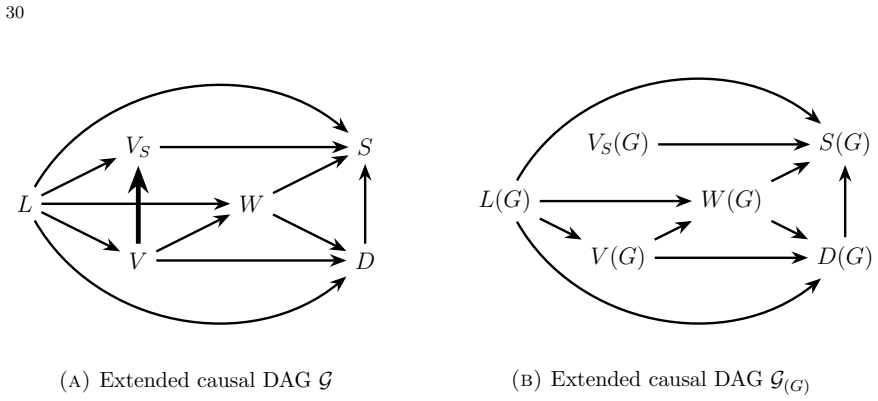
- The demographic-insensitivity framework suggests a testable criterion: a corrected score is fair in the paper's sense only if intervention on the sensitive attribute changes neither true- nor false-positive classification probabilities; the analysis finds the age-corrected score remains age-sensitive among impaired individuals.
- The nonparametric part of the data analysis is inconclusive; the empirical conclusion that raw scores win in this cohort depends on a correctly specified parametric model, so the applied claim is weaker than the theoretical one.
Editorial analysis
A structured set of objections, weighed in public.
Referee Report
Summary. The paper studies whether raw cognitive-screening scores or demographically corrected scores have better classification accuracy. It defines a general class of corrections, states sufficient conditions for raw scores to dominate corrected scores at a fixed FPR (Theorem 1), gives a converse condition for corrected scores (Theorem 2), adds a causal interpretation of the key co-monotonicity assumption, and proposes formal notions of demographic insensitivity. The theory is applied to MMSE data from OASIS-3, with a nonparametric analysis of the lower-bound quantity τ(t) and a parametric analysis supporting raw-score superiority. The paper is transparent about assumptions and includes substantial appendix proofs.
Significance. If the central theorem were correct, the paper would provide a useful, largely assumption-light explanation for the recurring empirical finding that demographic corrections do not improve, and can worsen, classification accuracy in cognitive screening. The multivariate extension in Appendix C, the causal interpretation in Section 2.3, and the intervening-variable formalization of demographic insensitivity in Appendix D are thoughtful and go beyond existing parametric analyses. The authors are also commendably explicit about the inconclusiveness of their nonparametric estimates. However, the main theorem is not established for discrete scores, and the paper's primary application (the MMSE) is discrete; the stress-test concern is real. A concrete counterexample falsifies Theorem 1 as stated under the paper's own ROC definition.
major comments (3)
- [§2.1–2.2 and Appendix B.1, Theorem 1] The proof fails at atoms of the score distribution. It defines t_S(α)=F^{-1}_{S,0}(α) and uses the identity E[α^X_V−α|D=0]=0, where α^S_v=P(S≤t_S(α)|D=0,V=v). For discrete S, F_{S,0}(t_S(α))=c_S≥α, generally strictly, so this identity is false; under Assumption 2, α^Z_v=c_Z, not α. Thus the comparison is not at the claimed FPR α and the Chebyshev step collapses. Remark 1's interpolation convention is not used in the proof; if it is used, the proof's first equality ROC_X(α)−ROC_Z(α)=P(X≤t_X(α)|D=1)−P(Z≤t_Z(α)|D=1) is also false. Concretely: let V∈{0,1} be equiprobable, P(D=1|V=0)=0.2, P(D=1|V=1)=0.8; X|D=0,V=0 uniform on {0,1}, X|D=0,V=1 uniform on {−1,0}, X|D=1,V=0 supported on {0,1} with masses .8,.2, and X|D=1,V=1 supported on {−1,0} with masses .8,.2. The z-score correction satisfies Assumptions 1–3. For α=0.6, F^{-1}_{X,0}(0.6)=0 and F^{-1}_{Z,0}(0.6)=1; the displayed ROC definition
- [§4.2, Table 1] The empirical implementation inherits the discrete-score problem. The reparametrized quantity τ(t)=E[LR_{X,V}(t,V)(α^X_V(t)−α(t))|D=0] is the theorem's lower bound only if t=F^{-1}_{X,0}(F_{X,0}(t)); for discrete X this is generally false, and the theorem's inequality is false at atoms. Therefore the claim that rejecting H0:τ(t)<0 provides evidence for raw superiority is not supported by Theorem 1. In addition, all reported right-sided 95% confidence intervals in Table 1 contain zero, so the nonparametric analysis is inconclusive; the parametric normal model is the only analysis that yields significance, and it assumes continuous scores rather than the observed discrete MMSE.
- [Assumption 2 and discrete corrections] Assumption 2 is much more restrictive for discrete scores than the text suggests. For a deterministic strictly increasing correction, Z⊥V|D=0 requires that, after alignment of the transformed support points, the conditional probability masses of X|D=0,V=v are identical across strata; location-scale shifts are a special case. For age-group-specific MMSE distributions, the usual z-score correction will generally violate Assumption 2. Since Theorem 1 and the Section 4 application rely on Assumption 2, the paper should either characterize when Assumption 2 holds for discrete tests or explicitly use the Appendix C.1 route without it.
minor comments (3)
- [Throughout] Typos: Definition 2 says 'neither or Type I nor II'; Appendix B.1 says 'Regrading' instead of 'Regarding'; Appendix D.2 says 'at leats' instead of 'at least'. These should be corrected.
- [§4.2] The bootstrap p-values are only described as 'considerably below 5%'. Please report the actual p-values or the bootstrap confidence intervals.
- [Appendix D.3] After defining bν_weighted,D(s), the next paragraph states that bν_weighted,S(s) is consistent; this appears to be a typo for bν_weighted,D(s). Also, Tables 2 and 3 are large; a compact summary of which intermediate nulls are rejected would improve readability.
Circularity Check
No significant circularity: Theorem 1 is derived from explicit Assumptions 1–3 using standard inequalities; the OASIS-3 analysis checks the assumptions rather than fitting the conclusion; self-citations are background only.
full rationale
Walking the derivation chain, Definition 1 does define corrected scores as per-stratum increasing transforms of X, and Lemma 1's equality of covariate-specific ROC curves is a direct consequence of that definition. The paper does not present this as a prediction; the claimed result is the marginal ROC comparison, which is not encoded in Definition 1. Theorem 1 is proved in Appendix B.1 from Assumptions 1–3: Assumption 1 gives concavity, Assumption 2 gives α^Z_v = α by stipulation (a well-designed correction), and Assumption 3 is a substantive co-monotonicity condition on observable quantities, used only to apply Chebyshev's weighted inequality. No fitted constants enter the proof, and the lower bound in Eq. (2) is a genuine sufficient-statistic expression rather than a restatement of ROC_X ≥ ROC_Z. The OASIS-3 application is an empirical check: Section 4.2 estimates τ(t) nonparametrically and fits parametric models only to translate Assumption 3 into coefficient conditions; it does not fit a parameter to the raw-minus-corrected ROC difference and call it a prediction. The demographic-insensitivity analysis (Section 4.3, Appendices D/F) gives identification theorems and plug-in estimators, again without fitting the target conclusion. References [21,22] include the authors' prior work, but they are cited for background, motivation, and causal interpretation; the main theorem does not rely on them, and no uniqueness or ansatz result is imported from those papers. The reviewer's discrete-score objection is a correctness concern about whether the quantile identity E[α^X_V−α|D=0]=0 holds for MMSE-like discrete scores under the generalized-inverse definition; that is not a circular reduction of the conclusion to the assumptions, so it is outside the circularity score.
Axiom & Free-Parameter Ledger
free parameters (5)
- β0, β1 (logistic model for D|V*) =
not reported
- μ0, μ1, μ2, σ² (normal model for X|D,V*) =
not reported
- η0, η1, δ0, δ1, δ2 (conditional model for Assumption 3) =
η1δ1 product CI (−0.0025, −0.0012)
- z-score correction mean/SD in normative group =
not reported
- age-quartile cutoffs (65, 70, 75) =
65/70/75
axioms (8)
- domain assumption Definition 1: corrected score is a strictly increasing differentiable transform of the raw score within each V stratum
- domain assumption Assumption 1: the conditional likelihood ratio LR_{X|V}(x|v) is decreasing in x
- domain assumption Assumption 2: Z⊥V|D=0
- domain assumption Assumption 3: co-monotonicity of α^X_v and P(D=1|X=t,V=v)
- domain assumption Assumption 4: counter-monotonicity for corrected-score superiority
- domain assumption Causal DAG V→D→X and V→X with no unmeasured common causes
- domain assumption Identification conditions in Appendix D: positivity, consistency, dismissible component conditions, faithfulness, V^S partial isolation
- standard math Standard measure-theoretic tools: Chebyshev's weighted inequality, Bayes rule, δ-method, multinomial CLT
invented entities (1)
-
V^S (sensitive attributes / intervening variable)
no independent evidence
read the original abstract
Demographic corrections are routinely performed in many disciplines, including psychology. Yet, there are ongoing debates about whether these corrections are appropriate and improve classification accuracy. Here, we focus on cognitive screening tests, and show that common demographic corrections, like the z-score correction, can be detrimental for classification in some settings. Formally, we present sufficient conditions ensuring that raw scores outperform the demographically-corrected ones, and give a substantive interpretation of this result. We also investigate the claim that using demographically-corrected scores results in more fair decisions compared to using raw scores. We apply our results to the Mini-Mental State Examination in the OASIS-3 dataset.
Figures

Reference graph
Works this paper leans on
-
[1]
Petersen.Mild Cognitive Impairment: Aging to Alzheimer’s Disease
Ronald C. Petersen.Mild Cognitive Impairment: Aging to Alzheimer’s Disease. Oxford Uni- versity Press, January 2003
2003
-
[2]
Are raw scores on memory tests better than age- and education- adjusted scores for predicting progression from amnesic mild cognitive impairment to alzheimer disease ?Curr
Davide Quaranta, Guido Gainotti, Maria Gabriella Vita, Giordano Lacidogna, Eugenia Scari- camazza, Chiara Piccininni, and Camillo Marra. Are raw scores on memory tests better than age- and education- adjusted scores for predicting progression from amnesic mild cognitive impairment to alzheimer disease ?Curr. Alzheimer Res., 13(12):1414–1420, 2016
2016
-
[3]
Boone, Jill Razani, and Louis F
Maura Mitrushina, Kyle B. Boone, Jill Razani, and Louis F. D’Elia.Handbook of Normative Data for Neuropsychological Assessment. Oxford University Press, February 2005
2005
-
[4]
Bradfield and David Ames
Nicholas I. Bradfield and David Ames. Mild cognitive impairment: narrative review of tax- onomies and systematic review of their prediction of incident alzheimer’s disease dementia. BJPsych Bull, 44(2):67–74, April 2020
2020
-
[5]
American Psychiatric Pub, May 2013
American Psychiatric Association.Diagnostic and Statistical Manual of Mental Disorders (DSM-5®). American Psychiatric Pub, May 2013
2013
-
[6]
Petersen, Glenn E
Ronald C. Petersen, Glenn E. Smith, Stephen C. Waring, Robert J. Ivnik, Emre Kokmen, and Eric G. Tangelos. Aging, memory, and mild cognitive impairment.International psy- chogeriatrics, 9(S1):65–69, 1997
1997
-
[7]
Evans, Robert F
Breda Cullen, Brian O’Neill, Jonathan J. Evans, Robert F. Coen, and Brian A. Lawlor. A review of screening tests for cognitive impairment.Journal of Neurology, Neurosurgery & Psychiatry, 78(8):790–799, 2007
2007
-
[8]
Belle, Eric C
Steven H. Belle, Eric C. Seaberg, Mary Ganguli, Graham Ratcliff, Steven DeKosky, and Lewis H. Kuller. Effect of education and gender adjustment on the sensitivity and specificity of a cognitive screening battery for dementia: Results from the movies project.Neuroepi- demiology, 15(6):321–329, 10 1996
1996
-
[9]
Correcting the 3ms for bias does not improve accuracy when screening for cognitive impairment or dementia.Journal of Clinical and Experimental Neuropsychology, 26(7):970–980, 2004
ME O’Connell, H Tuokko, RE Graves, and H Kadlec. Correcting the 3ms for bias does not improve accuracy when screening for cognitive impairment or dementia.Journal of Clinical and Experimental Neuropsychology, 26(7):970–980, 2004
2004
-
[10]
A. J. Larner.Cognitive Screening Instruments: A Practical Approach. Springer, November 2016
2016
-
[11]
Kraemer, Deborah J
Helena C. Kraemer, Deborah J. Moritz, and Jerome Yesavage. Adjusting mini-mental state examination scores for age and educational level to screen for dementia: correcting bias or reducing validity?International Psychogeriatrics, 10(1):43–51, 1998
1998
-
[12]
Cunnane, Jo¨ el Macoir, and Carol Hudon
Eddy Larouche, Marie-Pier Tremblay, Olivier Potvin, Sophie Laforest, David Bergeron, Robert Laforce, Laura Monetta, Linda Boucher, Pascale Tremblay, Sylvie Belleville, Do- minique Lorrain, Jean-Fran¸ cois Gagnon, Nadia Gosselin, Christian-Alexandre Castellano, Stephen C. Cunnane, Jo¨ el Macoir, and Carol Hudon. Normative data for the montreal cog- nitive ...
2016
-
[13]
Gregory.Psychological testing: History, principles, and applications
Robert J. Gregory.Psychological testing: History, principles, and applications. Allyn & Ba- con, 2004
2004
-
[14]
Mini- mental state examination: a normative study in italian elderly population.European journal of neurology, 3(3):198–202, 1996
Eugenio Magni, Giuliano Binetti, Angelo Bianchetti, R Rozzini, and M Trabucchi. Mini- mental state examination: a normative study in italian elderly population.European journal of neurology, 3(3):198–202, 1996
1996
-
[15]
Crum, James C
Rosa M. Crum, James C. Anthony, Susan S. Bassett, and Marshal F. Folstein. Population- based norms for the mini-mental state examination by age and educational level.Jama, 269(18):2386–2391, 1993
1993
-
[16]
Stewart, David Masur, and Richard B
Martin Sliwinski, Herman Buschke, Walter F. Stewart, David Masur, and Richard B. Lipton. The effect of dementia risk factors on comparative and diagnostic selective reminding norms. Journal of the International Neuropsychological Society, 3(4):317–326, 1997
1997
-
[17]
Lisa F. Berkman. The association between educational attainment and mental status exam- inations: of etiologic significance for senile dementias or not?Journal of chronic diseases, 39(3):171–174, 1986
1986
-
[18]
O’Connell and Holly Tuokko
Megan E. O’Connell and Holly Tuokko. Age corrections and dementia classification accuracy. Archives of Clinical Neuropsychology, 25(2):126–138, 2010. 19
2010
-
[19]
Age- correction of test scores reduces the validity of mild cognitive impairment in predicting pro- gression to dementia.PLoS One, 9(8):e106284, 2014
Johannes Hessler, Oliver Tucha, Hans F¨ orstl, Edelgard M¨ osch, and Horst Bickel. Age- correction of test scores reduces the validity of mild cognitive impairment in predicting pro- gression to dementia.PLoS One, 9(8):e106284, 2014
2014
-
[20]
De- mographically unadjusted cognitive test scores may enhance the validity of mild cognitive impairment as a dementia prodrome.Applied Neuropsychology: Adult, page 1–11, June 2025
Mathilde Suhr Hemminghyth, Monica Haraldseid Breitve, Luiza Jadwiga Chwiszczuk, Berglind G ´ ıslad´ ottir, Erik Hessen, Nikias Siafarikas, Ragnhild Eide Skogseth, Gøril Rolfseng Grøntvedt, Henrik Karlsen, Arvid Rongve, Tormod Fladby, and Bjørn-Eivind Kirsebom. De- mographically unadjusted cognitive test scores may enhance the validity of mild cognitive im...
2025
-
[21]
Rohmann, Maximilian Wechsung, Giancarlo Logroscino, and Tobias Kurth
Marco Piccininni, Jessica L. Rohmann, Maximilian Wechsung, Giancarlo Logroscino, and Tobias Kurth. Should cognitive screening tests be corrected for age and education? insights from a causal perspective.American Journal of Epidemiology, 192(1):93–101, 2023
2023
-
[22]
Conse- quences of age and education correction of cognitive screening tests–a simulation study of the moca test in italy.Neurological Sciences, 45(12):5697–5706, 2024
Hans-Aloys Wischmann, Giancarlo Logroscino, Tobias Kurth, and Marco Piccininni. Conse- quences of age and education correction of cognitive screening tests–a simulation study of the moca test in italy.Neurological Sciences, 45(12):5697–5706, 2024
2024
-
[23]
Ilardi, Alina Menichelli, Giovanni Federico, Marco Salvatore, and Paolo Manganotti
Ciro R. Ilardi, Alina Menichelli, Giovanni Federico, Marco Salvatore, and Paolo Manganotti. No matter how big it is, but how you use it: the importance of demographic adjustment in clinical neuropsychology.Neurological Sciences, 46(2):1027–1030, 2025
2025
-
[24]
Screening properties of the updated normative framework for the italian mmse in mci and dementia.Neurological Sciences, 46(5):2073–2080, January 2025
Edoardo Nicol` o Aiello, Federico Verde, Beatrice Curti, Giulia De Luca, Lorenzo Diana, Mar- tina Andrea Sirtori, Alessio Maranzano, Chiara Curatoli, Alice Zanin, Elisa Camporeale, Alessandra Gnesa, Vincenzo Silani, Nadia Bolognini, Nicola Ticozzi, and Barbara Poletti. Screening properties of the updated normative framework for the italian mmse in mci and...
2073
-
[25]
LaMontagne, Tammie LS
Pamela J. LaMontagne, Tammie LS. Benzinger, John C. Morris, Sarah Keefe, Russ Hornbeck, Chengjie Xiong, Elizabeth Grant, Jason Hassenstab, Krista Moulder, Andrei G. Vlassenko, Marcus E. Raichle, Carlos Cruchaga, and Daniel Marcus. Oasis-3: Longitudinal neuroimag- ing, clinical, and cognitive dataset for normal aging and alzheimer disease.medRxiv, 2019
2019
-
[26]
mini-mental state
Marshal F. Folstein, Susan E. Folstein, and Paul R. McHugh. “mini-mental state”.Journal of Psychiatric Research, 12(3):189–198, November 1975
1975
-
[27]
Krzanowski and David J
Wojtek J. Krzanowski and David J. Hand.ROC curves for continuous data. Chapman and Hall/CRC, 2009
2009
-
[28]
Nasreddine, Natalie A
Ziad S. Nasreddine, Natalie A. Phillips, Val´ erie B´ edirian, Simon Charbonneau, Victor White- head, Isabelle Collin, Jeffrey L. Cummings, and Howard Chertkow. The montreal cognitive assessment, moca: A brief screening tool for mild cognitive impairment.Journal of the Amer- ican Geriatrics Society, 53(4):695–699, March 2005
2005
-
[29]
Green, John A
David M. Green, John A. Swets, et al.Signal detection theory and psychophysics, volume 1. Wiley New York, 1966
1966
-
[30]
An introduction to roc analysis.Pattern recognition letters, 27(8):861–874, 2006
Tom Fawcett. An introduction to roc analysis.Pattern recognition letters, 27(8):861–874, 2006
2006
-
[31]
Receiver operating characteristic (roc) curves: equiva- lences, beta model, and minimum distance estimation.Machine learning, 111(6):2147–2159, 2022
Tilmann Gneiting and Peter Vogel. Receiver operating characteristic (roc) curves: equiva- lences, beta model, and minimum distance estimation.Machine learning, 111(6):2147–2159, 2022
2022
-
[32]
Roc and auc with a binary predictor: a potentially misleading metric
John Muschelli III. Roc and auc with a binary predictor: a potentially misleading metric. Journal of classification, 37(3):696–708, 2020
2020
-
[33]
Holly Janes and Margaret S. Pepe. Adjusting for covariate effects on classification accuracy using the covariate-adjusted receiver operating characteristic curve.Biometrika, 96(2):371– 382, 2009
2009
-
[34]
Margaret S. Pepe. A regression modelling framework for receiver operating characteristic curves in medical diagnostic testing.Biometrika, 84(3):595–608, 1997
1997
-
[35]
Margaret S. Pepe. Three approaches to regression analysis of receiver operating characteristic curves for continuous test results.Biometrics, pages 124–135, 1998
1998
-
[36]
Tianxi Cai and Margaret S. Pepe. Semiparametric receiver operating characteristic anal- ysis to evaluate biomarkers for disease.Journal of the American statistical Association, 97(460):1099–1107, 2002
2002
-
[37]
Pardo-Fern´ andez, and Ingrid van Keilegom
Wenceslao Gonz´ alez-Manteiga, Juan C. Pardo-Fern´ andez, and Ingrid van Keilegom. Roc curves in non-parametric location-scale regression models.Scandinavian Journal of Statis- tics, 38:169–184, 2011. 20
2011
-
[38]
Pepe, and Ziding Feng
Ying Huang, Margaret S. Pepe, and Ziding Feng. Logistic regression analysis with standard- ized markers.The annals of applied statistics, 7(3):10–1214, 2013
2013
-
[39]
Transformation models for roc analysis.arXiv preprint arXiv:2208.03679, 2022
Ainesh Sewak and Torsten Hothorn. Transformation models for roc analysis.arXiv preprint arXiv:2208.03679, 2022
Pith/arXiv arXiv 2022
-
[40]
Louren¸ co, Miguel de Carvalho, Richard A
Vanda In´ acio, Vanda M. Louren¸ co, Miguel de Carvalho, Richard A. Parker, and Vincent Gnanapragasam. Robust and flexible inference for the covariate-specific receiver operating characteristic curve.Statistics in Medicine, 40(26):5779–5795, 2021
2021
-
[41]
Pesce, Charles E
Lorenzo L. Pesce, Charles E. Metz, and Kevin S. Berbaum. On the convexity of roc curves estimated from radiological test results.Academic radiology, 17(8):960–968, 2010
2010
-
[42]
Armstrong
Thomas E. Armstrong. Chebyshev inequalities and comonotonicity.Real Analysis Exchange, 19(1):266 – 268, 1994
1994
-
[43]
Pepe.The statistical evaluation of medical tests for classification and prediction
Margaret S. Pepe.The statistical evaluation of medical tests for classification and prediction. Oxford university press, 2003
2003
-
[44]
James M. Robins. A new approach to causal inference in mortality studies with a sustained exposure period—application to control of the healthy worker survivor effect.Mathematical modelling, 7(9-12):1393–1512, 1986
1986
-
[45]
Richardson and James M
Thomas S. Richardson and James M. Robins. Single world intervention graphs (swigs): A unification of the counterfactual and graphical approaches to causality.Center for the Sta- tistics and the Social Sciences, University of Washington Series. Working Paper, 128(30), 2013
2013
-
[46]
Robins and Thomas S
James M. Robins and Thomas S. Richardson. Alternative graphical causal models and the identification of direct effects.Causality and psychopathology: Finding the determinants of disorders and their cures, pages 103–158, 2010
2010
-
[47]
Cambridge University Press, 2000
Judea Pearl.Causality: Models, Reasoning and Inference 2nd Edition. Cambridge University Press, 2000
2000
-
[48]
VanderWeele and James M
Tyler J. VanderWeele and James M. Robins. Minimal sufficient causation and directed acyclic graphs.The Annals of Statistics, 37(3):1437 – 1465, 2009
2009
-
[49]
VanderWeele and James M
Tyler J. VanderWeele and James M. Robins. Signed directed acyclic graphs for causal infer- ence.Journal of the Royal Statistical Society Series B: Statistical Methodology, 72(1):111–127, 2010
2010
-
[50]
Norms for the mini-mental state examination in a healthy population.Neurology, 53(2):315–315, 1999
Francesco Grigoletto, Giuseppe Zappal` a, Dallas W Anderson, and Barry D Lebowitz. Norms for the mini-mental state examination in a healthy population.Neurology, 53(2):315–315, 1999
1999
-
[51]
Emma Nichols, Jaimie D Steinmetz, Stein Emil Vollset, Kai Fukutaki, Julian Chalek, Foad Abd-Allah, Amir Abdoli, Ahmed Abualhasan, Eman Abu-Gharbieh, Tayyaba Tayyaba Akram, et al. Estimation of the global prevalence of dementia in 2019 and forecasted preva- lence in 2050: an analysis for the global burden of disease study 2019.The Lancet Public Health, 7(2...
2019
-
[52]
Age and education correc- tion of mini-mental state examination for english-and spanish-speaking elderly.Neurology, 46(3):700–706, 1996
Dan Mungas, SC Marshall, M Weldon, M Haan, and BR Reed. Age and education correc- tion of mini-mental state examination for english-and spanish-speaking elderly.Neurology, 46(3):700–706, 1996
1996
-
[53]
Fairness definitions explained
Sahil Verma and Julia Rubin. Fairness definitions explained. InProceedings of the interna- tional workshop on software fairness, pages 1–7, 2018
2018
-
[54]
Scheffels, Isabell Ballasch, Nadine Scheichel, Martin Voracek, Elke Kalbe, and Josef Kessler
Jannik F. Scheffels, Isabell Ballasch, Nadine Scheichel, Martin Voracek, Elke Kalbe, and Josef Kessler. The influence of age, gender and education on neuropsychological test scores: Up- dated clinical norms for five widely used cognitive assessments.Journal of Clinical Medicine, 12(16):5170, 2023
2023
-
[55]
Stensrud
Lan Wen, Aaron Sarvet, and Mats J. Stensrud. Causal effects of intervening variables in settings with unmeasured confounding.Journal of Machine Learning Research, 25(345):1–54, 2024
2024
-
[56]
Stensrud, Miguel A
Mats J. Stensrud, Miguel A. Hern´ an, Eric J. Tchetgen Tchetgen, James M. Robins, Vanessa Didelez, and Jessica G. Young. A generalized theory of separable effects in competing event settings.Lifetime data analysis, 27(4):588–631, 2021
2021
-
[57]
Stensrud, Jessica G
Mats J. Stensrud, Jessica G. Young, Vanessa Didelez, James M. Robins, and Miguel A. Hern´ an. Separable effects for causal inference in the presence of competing events.Journal of the American Statistical Association, 117(537):175–183, 2022. 21
2022
-
[58]
Stensrud, James M
Mats J. Stensrud, James M. Robins, Aaron Sarvet, Eric J. Tchetgen Tchetgen, and Jes- sica G. Young. Conditional separable effects.Journal of the American Statistical Association, 118(544):2671–2683, 2023
2023
-
[59]
James M. Robins, Thomas S. Richardson, and Ilya Shpitser. An interventionist approach to mediation analysis.arXiv preprint arXiv:2008.06019, 2020
Pith/arXiv arXiv 2008
-
[60]
Heuer, Leah Forsberg, Danielle Brushaber, Amy Rindels, Hiroko Dodge, Sandra Weintraub, et al
John Kornak, Julie Fields, Walter Kremers, Sara Farmer, Hilary W. Heuer, Leah Forsberg, Danielle Brushaber, Amy Rindels, Hiroko Dodge, Sandra Weintraub, et al. Nonlinear z- score modeling for improved detection of cognitive abnormality.Alzheimer’s & Dementia: Diagnosis, Assessment & Disease Monitoring, 11(1):797–808, 2019
2019
-
[61]
A. C. Davison and D. V. Hinkley.Bootstrap Methods and their Application. Cambridge Series in Statistical and Probabilistic Mathematics. Cambridge University Press, 1997
1997
-
[62]
Possin, Elena Tsoy, and Charles C
Katherine L. Possin, Elena Tsoy, and Charles C. Windon. Perils of race-based norms in cognitive testing: The case of former nfl players.JAMA neurology, 78(4):377–378, 2021
2021
-
[63]
Levey, Lesley A
Andrew S. Levey, Lesley A. Stevens, Christopher H. Schmid, Yaping Zhang, Alejandro F. Cas- tro III, Harold I. Feldman, John W. Kusek, Paul Eggers, Frederick Van Lente, Tom Greene, et al. A new equation to estimate glomerular filtration rate.Annals of internal medicine, 150(9):604–612, 2009
2009
-
[64]
Go, Rishi V
Chi-yuan Hsu, Wei Yang, Alan S. Go, Rishi V. Parikh, and Harold I. Feldman. Analysis of estimated and measured glomerular filtration rates and the ckd-epi equation race coefficient in the chronic renal insufficiency cohort study.JAMA Network Open, 4(7):e2117080–e2117080, 07 2021
2021
-
[65]
Diao, Gloria J
James A. Diao, Gloria J. Wu, Herman A. Taylor, John K. Tucker, Neil R. Powe, Isaac S. Kohane, and Arjun K. Manrai. Clinical implications of removing race from estimates of kidney function.JAMA, 325(2):184–186, 01 2021
2021
-
[66]
Christopher L Moore, Scott Bomann, Brock Daniels, Seth Luty, Annette Molinaro, Dinesh Singh, and Cary P Gross. Derivation and validation of a clinical prediction rule for uncom- plicated ureteral stone—the stone score: retrospective and prospective observational cohort studies.Bmj, 348, 2014
2014
-
[67]
Christopher L Moore, Cary P Gross, Louis Hart, Annette M Molinaro, Deborah Rhodes, Dinesh Singh, and Cristiana Baloescu. Construction and performance of a clinical prediction rule for ureteral stone without the use of race or ethnicity: A new stone score.Journal of the American College of Emergency Physicians Open, 5(6):e13324, 2024
2024
-
[68]
Prevent equations: a new era in cardiovascular disease risk assessment.Circulation: Cardiovascular Quality and Outcomes, 17(4):e010763, 2024
Alexander C Razavi, Payal Kohli, Darren K McGuire, Seth S Martin, Tamar S Polonsky, John W McEvoy, Seamus P Whelton, and Roger S Blumenthal. Prevent equations: a new era in cardiovascular disease risk assessment.Circulation: Cardiovascular Quality and Outcomes, 17(4):e010763, 2024
2024
-
[69]
Development and validation of a simple questionnaire to facilitate identification of women likely to have low bone density.American Journal of Managed Care, 4(1):37–48, 1998
Eva Lydick, Karen Cook, Jennifer Turpin, Mary Melton, Robert Stine, Christine Byrnes, et al. Development and validation of a simple questionnaire to facilitate identification of women likely to have low bone density.American Journal of Managed Care, 4(1):37–48, 1998
1998
-
[70]
Spirometric reference values from a sample of the general us population.American journal of respiratory and critical care medicine, 159(1):179–187, 1999
John L Hankinson, John R Odencrantz, and Kathleen B Fedan. Spirometric reference values from a sample of the general us population.American journal of respiratory and critical care medicine, 159(1):179–187, 1999
1999
-
[71]
Springer Science & Business Media, 2013
Larry Wasserman.All of statistics: a concise course in statistical inference. Springer Science & Business Media, 2013
2013
-
[72]
Girshick.Theory of Games and Statistical Decisions
David Blackwell and Meyer A. Girshick.Theory of Games and Statistical Decisions. John Wiley & Sons, New York, 1954
1954
-
[73]
Comparison of experiments: A short review.Lecture Notes-Monograph Series, pages 127–138, 1996
Lucien Le Cam. Comparison of experiments: A short review.Lecture Notes-Monograph Series, pages 127–138, 1996
1996
-
[74]
Cambridge University Press, 1991
Erik Torgersen.Comparison of statistical experiments, volume 36. Cambridge University Press, 1991
1991
-
[75]
Springer science & business media, 2013
Jean-Baptiste Hiriart-Urruty and Claude Lemar´ echal.Convex analysis and minimization al- gorithms I: Fundamentals, volume 305. Springer science & business media, 2013
2013
-
[76]
Hardy, John E
Godfrey H. Hardy, John E. Littlewood, and George P´ olya.Inequalities. Cambridge university press, 1952. 22
1952
-
[77]
Theodore E. Harris. A lower bound for the critical probability in a certain percolation process. Mathematical Proceedings of the Cambridge Philosophical Society, 56(1):13–20, 1960
1960
-
[78]
Kleitman
Daniel J. Kleitman. Families of non-disjoint subsets.Journal of Combinatorial Theory, 1(1):153–155, 1966
1966
-
[79]
Hern´ an and James M
Miguel A. Hern´ an and James M. Robins.Causal inference. CRC Boca Raton, FL, 2010
2010
-
[80]
Glymour, and Richard Scheines.Causation, prediction, and search
Peter Spirtes, Clark N. Glymour, and Richard Scheines.Causation, prediction, and search. MIT press, 2000
2000
discussion (0)
Sign in with ORCID, Apple, or X to comment. Anyone can read and Pith papers without signing in.