REVIEW 4 major objections 6 minor 32 references
Street design and driving behavior: evidence from a large-scale study in Milan, Amsterdam, and Dubai
T0 review · 4 major / 6 minor · reviewed 2026-08-06 · deepseek-v4-flash
Pith's one-line read Lowering a street's speed limit from 50 to 30 km/h changes measured speeds by only 2.29 km/h once visually similar streets are compared, so the paper concludes that signs alone do not enforce slower driving.
desk verdict A useful city-scale descriptive study of street design and speed, with a headline causal claim that the matching design cannot support. read the letter →
The pith
A machine-rendered reading of the paper's core claim, the machinery that carries it, and where it could break.
The reading
What carries the argument
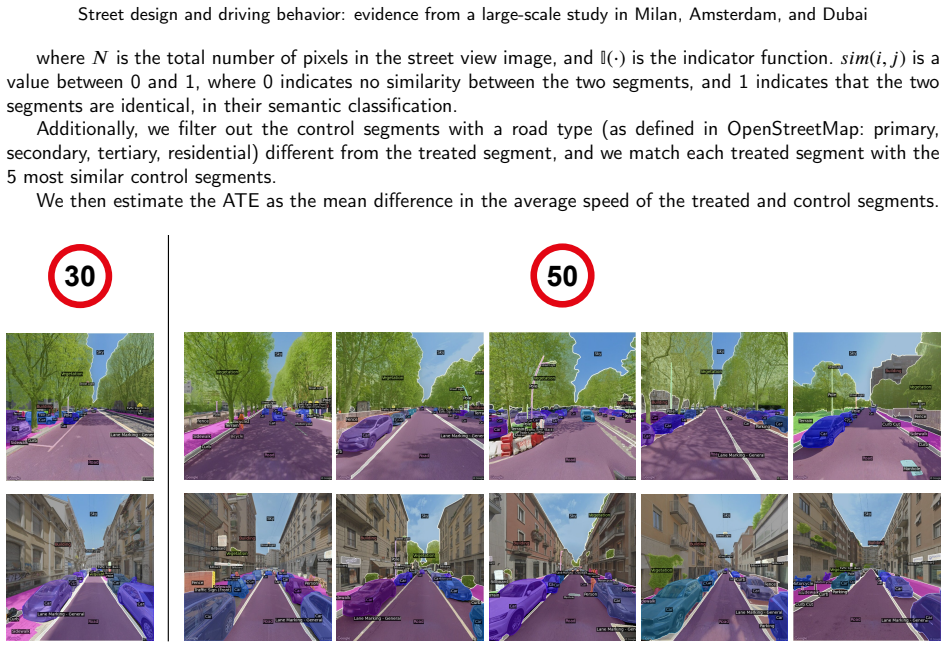
The central object is a matching estimator built on pixel-level visual similarity of street segments. Each segment is described by the class distribution produced by a panoptic segmentation model applied to street-view images; the similarity between two segments is the fraction of pixels assigned to the same semantic class, and each 30 km/h treated segment is paired with the five 50 km/h control segments that share its road type and have the highest similarity. The average treatment effect is then the mean speed difference between treated and matched control segments. The same image-derived features, combined with street geometry from open street-map data (width, length, lanes, sinuosity, one-way status, nearby stops and signals), feed a gradient-boosting regressor that predicts the compliance score (85th percentile speed divided by the posted limit), which is then applied to all current 50 km/h streets in Milan to forecast where a city-wide 30 km/h policy would succeed.
What would settle it
Collect speeds on streets where the posted limit changes from 50 to 30 km/h while the street design stays identical, recording enforcement activity and traffic counts; if speeds fall by much more than 2.29 km/h once those are accounted for, the small matching estimate would be wrong, and if they fall by a similar small amount, the paper's central claim is supported.
Extended reading notes
Core claim
On its own terms, the paper establishes that the speed-limit reduction from 50 to 30 km/h has a small causal effect on observed speeds in urban Milan. Matching each of 1,694 treated 30 km/h street segments to five 50 km/h control segments with the same road type and the most similar street-view appearance, the estimated average treatment effect is −2.29 km/h in mean speed and −3.45 km/h in the 85th percentile speed. A direct before-after study in the two areas where the limit was actually changed in 2023 (Porta Volta and Isola) finds no statistically significant speed change, which the paper reads as supporting evidence that signage alone does not change behavior. The same analysis of high- versus low-compliance streets shows that design features predict speed, and the street-design associations are largely replicated in Amsterdam and preliminarily in Dubai. The paper's conclusion is that the mere introduction of lower speed limits is not sufficient to reduce driving speeds effectively, and that street design should be the focus of interventions to improve adherence.
Load-bearing premise
The estimate assumes that after matching on road type and visual appearance, treated 30 km/h streets and control 50 km/h streets differ only in the posted limit; if unmeasured factors such as traffic volume, enforcement, or proximity to schools or hospitals differ between the two groups, the 2.29 km/h figure is not the causal effect of the limit.
Editorial extensions
If this is right
- A sign-only reduction from 50 to 30 km/h will not deliver the safety and noise benefits cities expect; those benefits require design changes or enforcement.
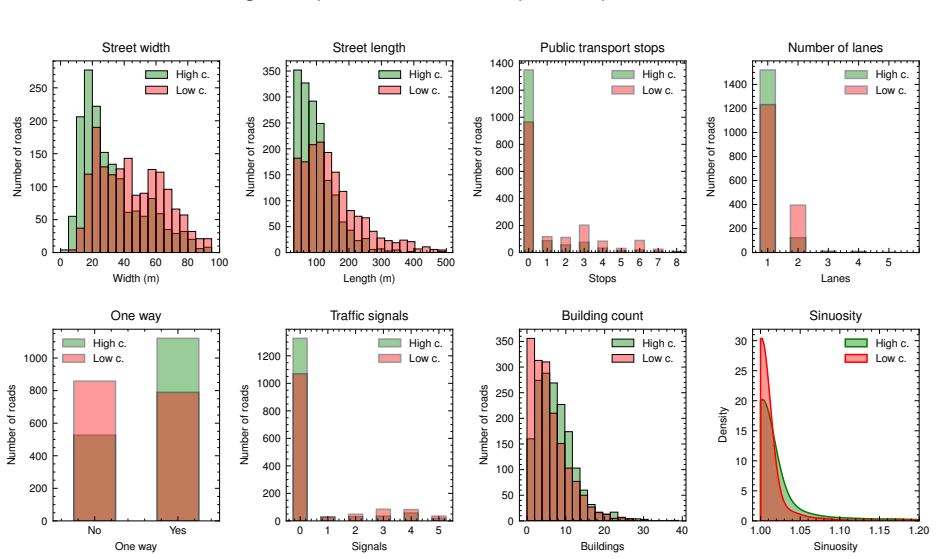
- Narrow streets with dense building fronts, few lanes, and short segments are where a 30 km/h limit will likely be respected without extra cost.
- Wide, open, multi-lane roads are where new limits will fail; planners should either redesign, enforce, or exempt them.
- The prediction model gives a street-by-street triage map: in Milan, roughly 17% of the 50 km/h network could convert cleanly, about 41% needs accompanying measures, and about 42% is likely to ignore the limit.
- The Amsterdam replication (with Dubai as a preliminary case) implies the design-to-speed relationships are not Milan-specific and can inform guidelines elsewhere.
Reading between the lines
- If 30 km/h zones were originally placed in naturally slow streets, the true effect of the sign may be even weaker than 2.29 km/h; the paper's own before-after null results point in that direction.
- A natural test of the model's transferability is to take the Milan-trained compliance model to Amsterdam or Dubai without retraining; the paper notes the ability is plausible but has not been demonstrated.
- The compliance score bundles physical design with traffic volume and driver mix; separating those drivers would require quasi-experiments that vary enforcement or congestion at fixed street geometry, which this dataset does not provide.
- If design predicts speed, it likely predicts crash risk as well, so the same street-view features could be tested against safety records as a lower-cost substitute for traditional crash studies.
Editorial analysis
A structured set of objections, weighed in public.
Referee Report
Summary. This paper analyzes 50.98 million vehicle speed observations from Milan in 2023, matched to OpenStreetMap segments and Google Street View images processed with OneFormer panoptic segmentation. The authors estimate the causal effect of a 30 versus 50 km/h speed limit by matching 1,694 treated segments to five visually similar control segments, obtaining -2.29 km/h for mean speed and -3.45 km/h for the 85th percentile (§3.2.2). They supplement this with a before-after study of two Milan neighborhoods (§3.2.1), cross-sectional street-feature comparisons, replication in Amsterdam and Dubai (§§6-7), and a gradient-boosting model that predicts speed-limit compliance (§5). The paper's headline claim is that merely lowering speed limits is insufficient to reduce driving speeds effectively and that street design matters for compliance.
Significance. The descriptive core of the paper is valuable: the dataset is unusually large, the use of street-view semantic segmentation to characterize street layout is methodologically interesting, the Amsterdam replication supports the robustness of the street-design associations, and the ML model is evaluated on held-out data (R²=0.719 with traffic density, §5). The cross-city comparison, even if Dubai is preliminary, is a useful step. However, the causal claim—the load-bearing result in the abstract and discussion—rests on an exchangeability assumption that the paper itself concedes is questionable (§3.2.3), so the current framing overstates what the analysis establishes. With a reanalysis or substantially weaker causal language, the descriptive findings could still be a solid contribution; as written, the central causal inference is not yet supported.
major comments (4)
- [§2.4, §3.2.2, §3.2.3] The headline estimate of -2.29 km/h is identified only under conditional exchangeability after matching on road type and pixel-level semantic similarity. The matching variables do not include traffic volume, enforcement intensity, proximity to schools or hospitals, pedestrian density, or neighborhood-level characteristics; and 30 km/h zones are spatially clustered (Global Moran's I = 0.38, §3.1.1), so unobserved local confounders are not balanced by controls that may lie far away. The paper's own §3.2.3 states that 'the City might have reduced the speed limits in areas where vehicles were already traveling at lower speeds,' which is exactly the selection mechanism that would bias the ATE toward the small negative value found. Because the before-after study (§3.2.1) is underpowered and cannot rescue the city-wide estimate, the paper does not currently support the causal statement in the abstract. I recommend either (i) adding a placebo test—for example, comparing matched treated and control segments on pre-treatment speeds if any pre-2023 data can be obtained, or on outcomes that should be unaffected by the speed limit—and reporting covariate balance and the spatial distribution of matches; or (ii) reframing the §3.2 results as descriptive differences and removing the causal wording from the abstract and discussion.
- [§2.4] The matching similarity is defined as the fraction of pixels with the same semantic class, sim(i,j), but the manuscript does not specify how the two images per segment (front and back, §2.3) are combined for matching, nor how pixel correspondences are established for images with different camera positions and orientations. Pixel-level overlap is highly sensitive to geometric alignment, and a low sim value could reflect camera pose rather than layout dissimilarity. This matters because the validity of the matched control group depends on the similarity metric actually capturing 'street layout and built environment.' At minimum, the authors should describe the image alignment, report the distribution of sim values for matched pairs, and show that the results are robust to using aggregated category fractions instead of raw pixel overlap.
- [§3.2.1] The before-after analysis reports t-test p-values of 0.11 and 0.051 and concludes that speeds did not significantly change. The Isola result is borderline at conventional 0.05 and, more importantly, the analysis does not control for time trends, traffic volume, or regression to the mean. The absence of a statistically significant change in two small areas cannot be read as evidence of no effect, and the confidence intervals are not reported. Please report effect sizes and confidence intervals, and refrain from using these results to support the city-wide causal conclusion.
- [§5.1] The model trained on existing 30 km/h zones is extrapolated to 50 km/h streets (excluding primary and secondary roads) to predict compliance under city-wide adoption. The target distribution differs from the training distribution in road hierarchy and speed limit, and no external validation is available because city-wide adoption has not occurred. The categorical statements that 335 km 'would likely be successful' and that 828 km are 'likely to be unsuccessful' overstate the precision of an out-of-distribution prediction. Please provide prediction intervals or other uncertainty quantification, and explicitly discuss the extrapolation risk. Also, the R² reported for the gradient boosting model is 0.719 in §5 but 0.697 in §8; the discrepancy should be resolved.
minor comments (6)
- [§2.4] The sentence 'By comparing the speed of the same road segment before and after the treatment, we can only observe one of the potential outcomes' is internally contradictory; in a before-after comparison, both potential outcomes are not independently observed, and the sentence should be rewritten to describe the fundamental problem of causal inference.
- [§2.3] The citation [16] for OneFormer's mIoU is incorrect; [16] is an emissions study. The reference should be to the OneFormer paper [18].
- [Figure 9] The caption says 'Predicted speed 85th speed percentile' but the color scale is labeled 'Predicted violation score'; the caption and axis labels should be aligned.
- [§7] The Dubai section states that the street-view analysis 'will be included in the final publication'; as it stands, the abstract's claim that results 'largely confirm' the findings in Dubai is premature.
- [Table 3] The header 'Features with most significant change' would be clearer as 'Features with the smallest Mann-Whitney U p-values'.
- [§4] In the text, the units of d for 'building_width' are meters but for pixel features they are percentage points; consider standardizing effect sizes, as Cohen's d is already reported in Table 3.
Circularity Check
No significant circularity: the causal estimate and the speed predictions are independent of their inputs; the sole self-citation is illustrative and not load-bearing.
full rationale
The paper's central causal estimate (-2.29 km/h) is obtained by comparing observed mean speeds of 30 km/h segments with matched 50 km/h segments (Section 2.4, Section 3.2.2); this is an empirical difference between groups, not a parameter fitted to the conclusion. The ML model (Section 5) is trained on held-out data and its city-wide 30 km/h adoption scenario is an out-of-sample application of a model trained on existing 30 km/h zones; the target compliance score is p85 divided by the speed limit, and applying it to 50 km/h streets with a hypothetical 30 km/h limit is a modeling extrapolation, not a definitional identity. The single author-overlapping citation ([25], on street view imagery and perceived value of the built environment) is used only as an example of prior work and carries no load in the derivation. The paper explicitly acknowledges the main threat to its causal claim in Section 3.2.3 (unobserved confounders such as schools, hospitals, pedestrian areas, and traffic), and the before-after studies are reported as underpowered (p = 0.11, p = 0.051). These are validity concerns, not circularity: no step in the derivation chain is equivalent to its inputs by construction, and no self-citation chain forces the conclusion.
Assumptions & free parameters
free parameters (7)
- median speed P85 split for compliance groups =
39.43 km/h
- map matching distance threshold =
6 m
- map matching heading threshold =
45 degrees
- OSM feature buffer radius =
20 m
- segment length filters =
30 m to 500 m
- Gradient Boosting hyperparameters (all-data model) =
max_depth=5, min_samples_leaf=1, min_samples_split=10, n_estimators=1000, loss=absolute_error
- Gradient Boosting hyperparameters (zones-30 model) =
max_depth=7, min_samples_leaf=4, min_samples_split=10, n_estimators=500, loss=absolute_error
assumptions (5)
- domain assumption Speed observations from UnipolTech OBUs and TomTom are representative of actual driving behavior at the segment level.
- domain assumption OSM maxspeed attributes are accurate or default to 50 km/h when absent.
- domain assumption Semantic segmentation of Google Street View images captures the street design features relevant to speed.
- domain assumption Matching on road type and visual similarity removes confounding between 30 km/h and 50 km/h segments.
- domain assumption The speed-compliance relationship estimated on existing 30 km/h streets transfers to streets currently posted at 50 km/h.
Cite this review
Pith. "Pith review of Street design and driving behavior: evidence from a large-scale study in Milan, Amsterdam, and Dubai." pith.science (2026). https://pith.science/paper/FIIWKFMG
@misc{pith2026250704434,
  author       = {Pith},
  title        = {Pith review of: Street design and driving behavior: evidence from a large-scale study in Milan, Amsterdam, and Dubai},
  year         = {2026},
  howpublished = {\url{https://pith.science/paper/FIIWKFMG}},
  note         = {Machine review of arXiv:2507.04434}
}
read the original abstract
In recent years, cities have increasingly reduced speed limits from 50 km/h to 30 km/h to enhance road safety, reduce noise pollution, and promote sustainable modes of transportation. However, achieving compliance with these new limits remains a key challenge for urban planners. This study investigates drivers' compliance with the 30 km/h speed limit in Milan and examines how street characteristics influence driving behavior. Our findings suggest that the mere introduction of lower speed limits is not sufficient to reduce driving speeds effectively, highlighting the need to understand how street design can improve speed limit adherence. To comprehend this relationship, we apply computer vision-based semantic segmentation models to Google Street View images. A large-scale analysis reveals that narrower streets and densely built environments are associated with lower speeds, whereas roads with greater visibility and larger sky views encourage faster driving. To evaluate the influence of the local context on speeding behaviour, we apply the developed methodological framework to two additional cities: Amsterdam, which, similar to Milan, is a historic European city not originally developed for cars, and Dubai, which instead has developed in recent decades with a more car-centric design. The results of the analyses largely confirm the findings obtained in Milan, which demonstrates the broad applicability of the road design guidelines for driver speed compliance identified in this paper. Finally, we develop a machine learning model to predict driving speeds based on street characteristics. We showcase the model's predictive power by estimating the compliance with speed limits in Milan if the city were to adopt a 30 km/h speed limit city-wide. The tool provides actionable insights for urban planners, supporting the design of interventions to improve speed limit compliance.
Figures


Figures from the paper (16 more)




Reference graph
Works this paper leans on
-
[1]
Open panorama.https://amsterdam.github.io/projects/open-panorama/
of Amsterdam, C., 2025. Open panorama.https://amsterdam.github.io/projects/open-panorama/
work page 2025
-
[2]
Local indicators of spatial association—lisa
Anselin, L., 1995. Local indicators of spatial association—lisa. Geographical Analysis 27, 93–115. doi:10.1111/j.1538-4632. 1995.tb00338.x
-
[3]
From the street to the metropolitan region: Pedestrian perspective in urban fabric analysis
Araldi, A., Fusco, G., 2019. From the street to the metropolitan region: Pedestrian perspective in urban fabric analysis. Environment and Planning B: Urban Analytics and City Science 46, 1243–1263. doi:10.1177/2399808319832612
-
[4]
Automobile Club d’Italia, 2021. Codice della strada - art. 142 limiti di velocità. URL: https://www.aci.it/i-servizi/ normative/codice-della-strada/titolo-v-norme-di-comportamento/art-142-limiti-di-velocita.html
work page 2021
-
[5]
Speeding drivers’ attitudes and perceptions of speed cameras in rural england
Blincoe, K.M., Jones, A.P., Sauerzapf, V., Haynes, R., 2006. Speeding drivers’ attitudes and perceptions of speed cameras in rural england. Accident Analysis & Prevention 38, 371–378. URL:https://www.sciencedirect.com/science/article/pii/ S0001457505001806, doi:https://doi.org/10.1016/j.aap.2005.10.008
-
[6]
Chacra, D.B.A., Zelek, J.S., 2017. Fully automated road defect detection using street view images, in: 2017 14th Conference on Computer and Robot Vision (CRV), pp. 353–360. doi:10.1109/CRV.2017.50
-
[7]
Comune di Milano, . Aree a velocità limitata. URL: https://dati.comune.milano.it/dataset/ds1438_aree_velocita_ limitata
-
[8]
Danielson, R.W., 1956. The relationship of fields of vision to safety in driving: with a report of 680 drivers examined by various screening methods. Transactions of the American Ophthalmological Society 54, 369
work page 1956
Show all 32 references
-
[9]
Spain switches most urban roads to 30 km/h amid calls for action in several eu member states
European Transport Safety Council, 2021. Spain switches most urban roads to 30 km/h amid calls for action in several eu member states. URL:http://archive.is/SXB7I
2021
-
[10]
momepy: Urban morphology measuring toolkit
Fleischmann, M., 2019. momepy: Urban morphology measuring toolkit. Journal of Open Source Software 4, 1807. doi:10.21105/joss.01807
2019 doi
-
[11]
Estimating city-level travel patterns using street imagery: A case study of using Google Street View in Britain
Goel, R., Garcia, L.M.T., Goodman, A., Johnson, R., Aldred, R., Murugesan, M., Brage, S., Bhalla, K., Woodcock, J., 2018. Estimating city-level travel patterns using street imagery: A case study of using Google Street View in Britain. PLOS ONE 13, e0196521. doi:10.1371/journal...
2018 doi
-
[12]
Investigating the impacts of urban speed limit reduction through microscopic traffic simulation
Gressai, M., Varga, B., Tettamanti, T., Varga, I., 2021. Investigating the impacts of urban speed limit reduction through microscopic traffic simulation. Communications in Transportation Research 1, 100018. doi: https://doi.org/10.1016/j. commtr.2021.100018
2021
-
[13]
Effect of 20 mph traffic speed zones on road injuries in London, 1986-2006: controlled interrupted time series analysis
Grundy, C., Steinbach, R., Edwards, P., Green, J., Armstrong, B., Wilkinson, P., 2009. Effect of 20 mph traffic speed zones on road injuries in London, 1986-2006: controlled interrupted time series analysis. BMJ 339, b4469–b4469. doi:10.1136/bmj.b4469
2009 doi
-
[14]
Built environment and violent crime: An environmental audit approach using google street view
He, L., Páez, A., Liu, D., 2017. Built environment and violent crime: An environmental audit approach using google street view. Computers, Environment and Urban Systems 66, 83–95
2017
-
[15]
Causal inference
Hernán, M.A., Robins, J.M., 2010. Causal inference
2010
-
[16]
Pm, nox and co2 emission reductions from speed management policies in europe
Int Panis, L., Beckx, C., Broekx, S., De Vlieger, I., Schrooten, L., Degraeuwe, B., Pelkmans, L., 2011. Pm, nox and co2 emission reductions from speed management policies in europe. Transport Policy 18, 32–37. URL:https://www.sciencedirect.com/ science/article/pii/S0967070X100...
2011 doi
-
[17]
Ordinance of 11 april 2024.https://www.gazzettaufficiale.it/eli/id/2024/05/28/ 24A02643/sg
Italian Ministry of Transport, 2024. Ordinance of 11 april 2024.https://www.gazzettaufficiale.it/eli/id/2024/05/28/ 24A02643/sg. Accessed: 2024-07-22
2024
-
[18]
OneFormer: One Transformer to Rule Universal Image Segmentation
Jain, J., Li, J., Chiu, M., Hassani, A., Orlov, N., Shi, H., 2023. OneFormer: One Transformer to Rule Universal Image Segmentation
2023
-
[19]
Take a look around: Using street view and satellite images to estimate house prices
Law, S., Paige, B., Russell, C., 2019. Take a look around: Using street view and satellite images to estimate house prices. ACM Trans. Intell. Syst. Technol. 10. doi:10.1145/3342240
2019 doi
-
[20]
Costing lives or saving lives: a detailed evaluation of the impact of speed cameras
Mountain, L., Hirst, W., Maher, M., 2004. Costing lives or saving lives: a detailed evaluation of the impact of speed cameras. Traffic, Engineering and Control 45, 280–287
2004
-
[21]
The mapillary vistas dataset for semantic understanding of street scenes, in: 2017 IEEE International Conference on Computer Vision (ICCV), pp
Neuhold, G., Ollmann, T., Bulò, S.R., Kontschieder, P., 2017. The mapillary vistas dataset for semantic understanding of street scenes, in: 2017 IEEE International Conference on Computer Vision (ICCV), pp. 5000–5009. doi:10.1109/ICCV.2017.534
2017 doi
-
[22]
Planet dump retrieved from https://planet.osm.org .https://www.openstreetmap.org
OpenStreetMap contributors, 2017. Planet dump retrieved from https://planet.osm.org .https://www.openstreetmap.org
2017
-
[23]
Quantifying the Effects of Visual Road Information on Drivers’ Speed Choices to Promote Self-Explaining Roads
Qin, Y., Chen, Y., Lin, K., 2020. Quantifying the Effects of Visual Road Information on Drivers’ Speed Choices to Promote Self-Explaining Roads. International Journal of Environmental Research and Public Health 17, 2437. URL: https://www.mdpi.com/1660-4601/17/7/2437, doi:10.33...
2020 doi
-
[24]
Milano, limite a 30 km/h in tutta la città dal 2024
Quattroruote, 2023. Milano, limite a 30 km/h in tutta la città dal 2024. URL:http://archive.is/UyckV. accessed: 2024-07-22
2023
-
[25]
Desirable streets: Using deviations in pedestrian trajectories to measure the value of the built environment
Salazar Miranda, A., Fan, Z., Duarte, F., Ratti, C., 2021. Desirable streets: Using deviations in pedestrian trajectories to measure the value of the built environment. Computers, Environment and Urban Systems 86, 101563. doi:10.1016/j.compenvurbsys. 2020.101563
2021
-
[26]
Speed 30 km/h on arterial roads – limits and implementation URL:http://archive.is/ CGtlv
Swiss Federal Roads Office, 2019. Speed 30 km/h on arterial roads – limits and implementation URL:http://archive.is/ CGtlv
2019
-
[27]
Assessing the impact of vehicle speed limits and fleet composition on air quality near a school
Tang, J., McNabola, A., Misstear, B., Pilla, F., Alam, M.S., 2019. Assessing the impact of vehicle speed limits and fleet composition on air quality near a school. International Journal of Environmental Research and Public Health 16. URL: https://www.mdpi.com/1660-4601/16/1/14...
2019 doi
-
[28]
Self-Explaining Roads: Effects of road design on speed choice
Theeuwes, J., Snell, J., Koning, T., Bucker, B., 2024. Self-Explaining Roads: Effects of road design on speed choice. Transportation Research Part F: Traffic Psychology and Behaviour 102, 335–361. URL: https://linkinghub.elsevier. com/retrieve/pii/S1369847824000524, doi:10.101...
2024 doi
-
[29]
Unipoltech website.https://www.unipoltech.it/
UnipolTech, 2024. Unipoltech website.https://www.unipoltech.it/
2024
-
[30]
Effect of speed limits on speed and safety: A review
Wilmot, C.G., Khanal, M., 1999. Effect of speed limits on speed and safety: A review. Trans- port Reviews 19, 315–329. URL: https://doi.org/10.1080/014416499295420, doi: 10.1080/014416499295420, arXiv:https://doi.org/10.1080/014416499295420
1999 doi
-
[31]
Review of City-Wide 30 km/h Speed Limit Benefits in Europe
Yannis, G., Michelaraki, E., 2024. Review of City-Wide 30 km/h Speed Limit Benefits in Europe. Sustainability 16, 4382. doi:10.3390/su16114382
2024 doi
-
[32]
A close examination of speed limit credibility and compliance on UK roads
Yao, Y., Carsten, O., Hibberd, D., 2020. A close examination of speed limit credibility and compliance on UK roads. IATSS Research 44, 17–29. URL:https://linkinghub.elsevier.com/retrieve/pii/S0386111218300876, doi:10.1016/j.iatssr. 2019.05.003. G. Orsi al.: Preprint submitted ...
2020 doi
Reviewed August 6, 2026 · model on record in the stance chip above.
Discussion (0). Continue with ORCID to comment.