REVIEW 3 major objections 5 minor 28 references
Automated Rib Fracture Detection of Postmortem Computed Tomography Images Using Machine Learning Techniques
T0 review · 3 major / 5 minor · reviewed 2026-08-14 · deepseek-v4-flash
Pith's one-line read The paper claims the HOMFLY knot invariant can separate fractured from intact rib CT images at 0.60 precision, but cannot yet label new images.
desk verdict Novel idea, honest write-up, but the reported HOMFLY 'classifier' is a descriptive list-overlap statistic, not a predictor. read the letter →
The pith
A machine-rendered reading of the paper's core claim, the machinery that carries it, and where it could break.
The reading
What carries the argument
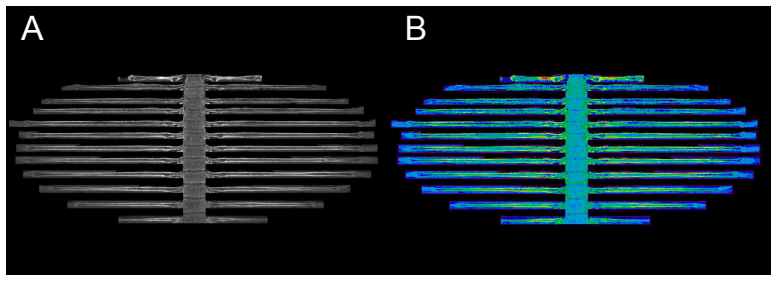
The load-bearing object is the HOMFLY polynomial, a two-variable knot invariant computed from the closed piecewise-linear curve formed by joining 52 coordinates in RGB color space. The coordinates are produced by taking a pseudo-colored, unfolded rib CT image, convolving each RGB channel separately with 13 hand-picked $3\times3$ kernels, and softmax-pooling repeatedly until a $2\times2$ feature map per channel supplies four coordinate values; 13 kernels times four coordinates gives the 52 vertices of the curve. The HOMFLY polynomial is then computed from this curve with a program supplied by reference [20], and each image is assigned the corresponding knot type. The mechanism works if geometrically similar images yield topologically equivalent curves, and the paper measures class separation by counting which knot types appear in only one of the two class lists.
What would settle it
Take a fresh cohort of rib CT images, run the same 13-kernel, 52-coordinate pipeline, and check whether each image's HOMFLY polynomial falls exclusively into the fracture or no-fracture list; if a substantial share of new images has a knot type present in both lists or in neither, the claimed classification breaks, and the paper's own statement that unlabelled images cannot yet be predicted already points toward this outcome.
Extended reading notes
Core claim
The central discovery, stated by the authors as a demonstration rather than a finished tool, is that rib CT images can be mapped to knot types whose HOMFLY polynomials separate, with measurable overlap, into a fracture list and a no-fracture list: precision is 0.60 for images with rib fractures and 0.52 for images without fractures, computed as the proportion of knot types not shared between classes. This separation is achieved without training any weights, using only the 52-coordinate curves derived from 13 convolution kernels on the pseudo-colored unfolded rib cage. The authors compare against two convolutional neural network baselines, which reach F1 scores of 0.72 and 0.73, and they report that the topology method cannot predict labels for unseen images because the current dataset does not cover the full catalogue of polynomials. On the paper's own terms, the result is an existence proof: a knot invariant can be inserted into an image-classification pipeline and yield a real, if modest, class signal.
Load-bearing premise
The whole method rests on the assumption that images from the same class produce closed curves with the same knot type, so that a single HOMFLY polynomial identifies the class; the paper's data already undermine this, since more than one knot type appears within a single class.
Editorial extensions
If this is right
- If the topology-based separation holds on larger cohorts, rib-fracture screening could run without neural network training, using only hand-crafted kernels and a knot invariant.
- The reported precision values set a measurable baseline: a larger dataset is expected to improve them, because the paper attributes the current ceiling to an incomplete catalogue of knot types.
- Because both CNN baselines plateau around F1 0.72-0.73, the topology pipeline's 0.60 precision gives a non-statistical reference point for future automated fracture detection.
- The same image-to-knot recipe should transfer to other grayscale medical images where a pathology manifests as stable shape or texture changes, since nothing in the pipeline is rib-specific.
Reading between the lines
- A fair reading is that what is established is a class-separation statistic, not a classifier: the list-overlap rule cannot label a new image whose knot type appears in both lists or in neither, which the paper concedes.
- A natural extension is to treat the HOMFLY polynomial type as a categorical feature and fit a small probabilistic model over knot-type distributions, instead of requiring strict exclusivity between the two class lists.
- Using a coarser invariant (for instance, only the unknot versus a small set of low-crossing types) could mitigate the instability from multiple knot types per class; this direction is untested but follows directly from the paper's own observation.
Signed reviews
Editorial analysis
A structured set of objections, weighed in public.
Referee Report
Summary. The paper proposes a pipeline for automated detection of rib fractures in postmortem CT images by converting images into closed curves in RGB color space, computing HOMFLY polynomial knot invariants, and comparing the distribution of knot types between fracture and no-fracture classes. The authors report a 'precision' of 0.60 for the fracture class using this topological approach, alongside F1 scores of 0.72–0.73 for two convolutional neural network baselines (MobileNet and a custom Keras model). The paper claims in the abstract and conclusion that the method can classify CT images of rib fractures.
Significance. The application domain is relevant: automated rib fracture detection in forensic PMCT could reduce radiologist workload. The paper includes a legitimate comparison of two CNN baselines, with reported recall, precision, and F1 scores, which is a strength. However, the central novel claim—that HOMFLY polynomial knot invariants classify rib fracture images—is not supported by the experiments as presented. The reported 0.60 precision is not a predictive accuracy but a descriptive list-overlap statistic with no train/test split and no decision rule for new images. The paper's own Discussion (Section 4) explicitly states that the pipeline cannot be used for predicting unlabelled images. Consequently, the title, abstract, and conclusion overstate what was demonstrated. The work is at best a preliminary exploration of a topological descriptor, not a validated classifier.
major comments (3)
- [Eq. (2), Section 2.8, and Section 3] The quantity called 'precision' for the HOMFLY approach is defined as (K1 - K12)/K1, where K1 is the number of knot types in one class and K12 is the number shared between classes. This is a measure of list disjointness, not classification precision in the sense of TP/(TP+FP). It is computed over the entire dataset without any train/test split, and the paper provides no decision rule that would assign a label to a new image. Section 4 explicitly states: 'we could not use this pipeline for predicting unlabelled images.' Therefore, the abstract's claim of a 'precision of 0.60' and the conclusion's statement that the method 'can be applied to classify CT images of rib fractures' are not supported.
- [Section 4] The load-bearing invariance assumption stated in Section 4—that variations in size, color, and shape for the same object translate into small geometrical variations of the closed curve, so that distinct objects produce distinct curves with different topological properties—is contradicted by the authors' own finding: 'we ended up with more than one knot type for a given class.' This means the topological invariant is not stable within a class, and the method is reduced to comparing lists of knot types between two fixed collections of images. The claimed classification mechanism therefore does not hold, and the observed separation may be an artifact of the particular dataset rather than a generalizable property.
- [Sections 2.5 and 2.6] The hyperparameters of the topological pipeline—the number of convolution cycles (4), the subset of 13 out of 28 kernels, and the use of 52 vertices—were selected using the full dataset. Equation (1) defines the kernel-selection criterion D as a function of the centroids of the two classes' feature clusters, and Figure 3 shows the resulting values for all 28 kernels. No held-out validation or cross-validation is performed for the topological pipeline. As a result, even the descriptive list-overlap statistic is optimistically biased, and no reliable estimate of generalization performance is provided.
minor comments (5)
- [Abstract] 'To access the performance' should read 'To assess the performance'.
- [Section 2.7] There is a typographical error: 'HOMLFY polynomial' should be 'HOMFLY polynomial'.
- [Throughout] The word 'Euclidian' appears in Section 2.7 and elsewhere; the standard spelling is 'Euclidean'.
- [Section 2.5] The phrase 'we convolved each channel of the input images with a 3 × 3 kernel function ... followed by a downsampling using the softmax function' is unclear: softmax is not a downsampling operation. Please clarify the exact pooling or downsampling procedure used.
- [Section 3] The statement 'Using 52 vertices, we could classify all fractures' is ambiguous because the subsequent precision values indicate that knot types are shared between classes; please clarify what 'classify all fractures' means in this context.
Circularity Check
The reported HOMFLY precision is a descriptive list-overlap statistic computed on the same images used to build the lists, not a predictive classifier result; the paper itself concedes the pipeline cannot predict unlabelled images.
-
fitted input called prediction
[Section 2.8 (Eq. 2) and Section 4 (Discussion)]
"In case of the polynomial knot invariant the precision was modified to account for the relative proportion of knot types that were not shared between the two classes, i.e. (K1− K12)/K1 (2) where K1 is the total number of knot types in one class and K12 is the total number of knot types in both classes. ... Hence, although we can show this approach can classify rib fracture with a precision of 0.60, we could not use this pipeline for predicting unlabelled images."
The claimed precision of 0.60 is defined by Eq. 2 as the fraction of knot types appearing in only one class list. Both lists are constructed from the full dataset of images, and the same images are then used to compute the overlap statistic. There is no train/test split and no decision rule that maps a new image to a class; the paper explicitly states that the pipeline cannot predict unlabelled images. Therefore the 'classification precision' is not a predictive performance measure but a restatement of how distinct the two label-conditioned lists of polynomials are. The conclusion that the method 'can be applied to classify CT images' is thus forced by the way precision was defined, not by any demonstrated predictive result.
-
fitted input called prediction
[Section 2.5 and Section 2.6 (Eq. 1)]
"The number of convolution cycles was determined to be 4 for the current dataset. This value was obtained by maximizing the following quantity D = ||v1c− v2c|| / (Σ||v1i− v1c|| + Σ||v2j− v2c||) (1) ... A total of 13 kernel functions out of the 28 listed in Table 1 were chosen to generate a final set of 52 coordinates per image."
The convolutional pipeline is tuned directly on the entire dataset: the number of convolution cycles is chosen by maximizing the cluster-separation statistic D, and the selection of 13 kernels is made on the same images. The subsequent HOMFLY polynomials and the overlap-based precision are then computed from these same tuned features on the same images. The reported 0.60 precision therefore measures how well the manually selected kernels and cycle count separate the already-seen data, rather than how the method would generalize to new images. This is a form of evaluating a fitted representation on its own training input, which makes the claimed classification performance optimistically biased and statistically dependent on the choices made from the data.
full rationale
The core topological claim reduces by construction: the paper defines its HOMFLY 'precision' as a list-overlap ratio (Eq. 2) computed from the knot-type lists of the training images themselves, and then explicitly concedes in Section 4 that the pipeline cannot predict unlabelled images. Because no held-out data, cross-validation, or classification rule for new images is involved, the reported 0.60 precision is a descriptive statistic about the two label-conditioned polynomial lists, not a measured classification performance. The kernel selection and convolution-cycle count are also optimized on the full dataset, compounding the dependence between the reported number and the data that produced it. This is not a self-citation or imported-uniqueness problem: the HOMFLY computation uses an external program by Ewing and Millett, and the CNN baselines are evaluated with standard train/validation splits and are independent. The circularity is instead that the paper's central 'HOMFLY classifier' claim is supported only by a metric that is, by Eq. 2, an overlap count on the training set, with the paper's own admission ruling out prediction. That warrants a score of 6: some 'predictions' reduce by construction, while the independent CNN comparison and the genuine mathematical computation of knot invariants keep the paper from being entirely definitionally circular.
Assumptions & free parameters
free parameters (3)
- Number of convolution cycles =
4
- Subset of kernels =
13 of 28
- Image resolution =
950x950 for HOMFLY, 60x60 for Keras
assumptions (4)
- standard math HOMFLY polynomial is a knot invariant that distinguishes knots
- domain assumption Small variations in image properties produce small geometrical variations in the closed curve, preserving knot type within a class
- domain assumption Rib unfolding tool produces consistent, informative projections across cases
- ad hoc to paper The selected 13 kernels and 4 convolution cycles capture fracture-relevant features
Cite this review
Pith. "Pith review of Automated Rib Fracture Detection of Postmortem Computed Tomography Images Using Machine Learning Techniques." pith.science (2026). https://pith.science/paper/FMVRWM2X
@misc{pith2026190805467,
  author       = {Pith},
  title        = {Pith review of: Automated Rib Fracture Detection of Postmortem Computed Tomography Images Using Machine Learning Techniques},
  year         = {2026},
  howpublished = {\url{https://pith.science/paper/FMVRWM2X}},
  note         = {Machine review of arXiv:1908.05467}
}
abstract
Imaging techniques is widely used for medical diagnostics. This leads in some cases to a real bottleneck when there is a lack of medical practitioners and the images have to be manually processed. In such a situation there is a need to reduce the amount of manual work by automating part of the analysis. In this article, we investigate the potential of a machine learning algorithm for medical image processing by computing a topological invariant classifier. First, we select retrospectively from our database of postmortem computed tomography images of rib fractures. The images are prepared by applying a rib unfolding tool that flattens the rib cage to form a two-dimensional projection. We compare the results of our analysis with two independent convolutional neural network models. In the case of the neural network model, we obtain an $F_1$ Score of 0.73. To access the performance of our classifier, we compute the relative proportion of images that were not shared between the two classes. We obtain a precision of 0.60 for the images with rib fractures.
Figures


Figures from the paper (2 more)


Reference graph
Works this paper leans on
-
[1]
Y . LeCun, A Learning Scheme for Asymmetric Threshold Networks), Proceedings of Cognitiva 85, 1985, 599–604
work page 1985
- [2]
-
[3]
Y . LeCun and Y . Bengio and G. Hinton,Deep learning, Nature 521, 2015, 436–444
work page 2015
-
[4]
J. W. Alexander, Topological invariants of knots and links, Trans. Am. Math. Soc. 30, 1928, 275–306
work page 1928
-
[5]
P. Freyd and D. Yetter and J. Hoste and W. B. R Lickorish and K. C. Millett and A. Ocneanu, A new polynomial invariant of knots and links, Bull. Amer. Math. Soc. 12, 1985, 239–246
work page 1985
-
[6]
V . F. R. Jones, A polynomial invariant for knots via von Neumann algebras , Bull. Amer. Math. Soc. 12, 1985, 103–111. 9
work page 1985
-
[7]
L.C. Ebert, G Ampanozi, T.D. Ruder, G Hatch, M.J. Thali and T Germerott, CT based volume measurement and estimation in cases of pericardial effusion, Journal of Forensic and Legal Medicine 19(3), 2012, 126–131
work page 2012
- [8]
Show all 28 references
-
[9]
Gaonkar, L
B. Gaonkar, L. Macyszyn, M. Bilello, M.S. Sadaghiani, H. Akbari, M.A. Atthiah, Z.S. Ali, X. Da, Y . Zhan, D.O. Rourke, S.M. Grady and C. Davatzikos, Automated Tumor Volumetry Using Computer-Aided Image Segmen- tation, Academic Radiology 22(5), 2015, 653–661
2015
-
[10]
Collado-Mesa, E
F. Collado-Mesa, E. Alvarez and K. Arheart, The Role of Artificial Intelligence in Diagnostic Radiology: A Survey at a Single Radiology Residency Training Program, Journal of the American College of Radiology 15(12), 2018, 1753–1757
2018
-
[11]
Andriole, J.M
K.P. Andriole, J.M. Wolfe, R. Khorasani, S.T. Treves, D.J. Getty, F.L. Jacobson, M.L. Steigner, J.J. Pan, A. Sitek and S.E. Seltzer, Optimizing Analysis, Visualization, and Navigation of Large Image Data Sets: One 5000-Section CT Scan Can Ruin Your Whole Day, Radiology 259(2),...
2011
-
[12]
Schulze, H
C. Schulze, H. Hoppe, W. Schweitzer, N. Schwendener, S. Grabherr and C. Jackowski,Rib fractures at postmortem computed tomography (PMCT) validated against the autopsy, Forensic Science International 233(1-3), 2013, 90– 98
2013
-
[13]
K.M. Yang, M. Lynch and C. O’Donnell, ”Buckle” rib fracture: An artifact following cardio-pulmonary resusci- tation detected on postmortem CT, Legal Medicine 13(5), 2011, 233–239
2011
-
[14]
Cattaneo, E
C. Cattaneo, E. Marinelli, A. Di Giancamillo, M. Di Giancamillo, O. Travetti, L. Vigano, P. Poppa, D. Porta, A. Gentilomo and M. Grandi, Sensitivity of autopsy and radiological examination in detecting bone fractures in an animal model: Implications for the assessment of fatal...
2006
-
[15]
Glemser, M
P.A. Glemser, M. Pfleiderer, A. Heger, J. Tremper, A. Krauskopf, H.P. Schlemmer, K. Yen and D. Simons, New bone post-processing tools in forensic imaging: a multi-reader feasibility study to evaluate detection time and diagnostic accuracy in rib fracture assessment, Internation...
2017
-
[16]
Egger, P
C. Egger, P. Vaucher, F. Doenz, C. Palmiere, P. Mangin and S. Grabherr, Development and validation of a post- mortem radiological alteration index: the RA-Index , International Journal of Legal Medicine 126(4), 2012, 559– 566
2012
-
[17]
Ringl, M
H. Ringl, M. Lazar, M. Topker, R. Woitek, H. Prosch, U. Asenbaum, C. Balassy, D. Toth, M. Weber, S. Hajdu, G. Soza, A. Wimmer and T. Mang, The ribs unfolded – a CT visualization algorithm for fast detection of rib fractures: effect on sensitivity and specificity in trauma patien...
2015
-
[18]
J. D. Hunter, Matplotlib: A 2d graphics environment, Computing in Science and Engineering 9, 2007, 90–95
2007
-
[19]
Dankerl, H
P. Dankerl, H. Seuss, S. Ellmann, A. Cavallaro, M. Uder and M. Hammon,Evaluation of Rib Fractures on a Single- in-plane Image Reformation of the Rib Cage in CT Examinations, Academic Radiology 24(2), 2017, 153–159
2017
-
[20]
Ewing and K.C
B. Ewing and K.C. Millett, Progress in knot theory and related topics, Paris, France: Hermann. 1997, 51–68
1997
-
[21]
Abadi, P
M. Abadi, P. Barham, J. Chen, Z. Chen, A. Davis, J. Dean et al., TensorFlow: A system for large-scale machine learning, CoRR, 2016, abs/1605.08695
2016 arXiv
-
[22]
Howard, M
A.G. Howard, M. Zhu, B. Chen, D. Kalenichenko, W. Wang, T. Weyandet al., MobileNets: Efficient Convolutional Neural Networks for Mobile Vision Applications, CoRR, 2017, ccabs/1704.04861
2017 arXiv
-
[23]
Alexander and G.B
J.W. Alexander and G.B. Briggs, On types of knotted curves, Ann. of Math. 28, 1927, 562–586
1927
-
[24]
Hoste, M
J. Hoste, M. Thistlethwaite and J. Weeks, The First 1,701,936 Knots, The Mathematical Intelligencer 20(4), 1998, 33–48
1998
-
[25]
Krizhevsky and S
A. Krizhevsky and S. Ilya and H. Geo ffrey, ImageNet Classification with Deep Convolutional Neural Networks , Advances in Neural Information Processing Systems 25, Curran Associates, Inc., 2012, 1097–1105
2012
-
[26]
Schmidhuber, Deep learning in neural networks: An overview, Neural Networks 61, 2015, 85–117
J. Schmidhuber, Deep learning in neural networks: An overview, Neural Networks 61, 2015, 85–117
2015
-
[27]
Cao and F
C. Cao and F. Liu and H. Tan and D. Song and W. Shu and W. Li and Y . Zhou and X. Bo and Z. Xie,Deep Learning and Its Applications in Biomedicine, Genomics, Proteomics and Bioinformatics 16(1), 2018, 17–32
2018
-
[28]
(A) Regular projection of a knot
Supplementary Materials 10 A B C D Figure 4: Crossing convention for projecting a knot onto a 2D plane. (A) Regular projection of a knot. (B to D) Degenerate projections of a knot. In (B) the projection is degenerate due to triple crossings. In (C) one edge is normal to the pr...
Reviewed August 14, 2026 · model on record in the stance chip above.
Discussion (0). Continue with ORCID to comment.