REVIEW 4 major objections 5 minor 34 references
Application of Sensitivity Analysis Methods for Studying Neural Network Models
T0 review · 4 major / 5 minor · reviewed 2026-08-16 · deepseek-v4-flash
Pith's one-line read This paper demonstrates that sensitivity-analysis methods can identify which inputs a neural network actually depends on, from glucose, BMI, and age in a diabetes model to B-lines, consolidations, and A-lines in lung ultrasound.
desk verdict A straightforward, reproducible demonstration of standard sensitivity/interpretability tools on small models; the diabetes feature-ranking part holds up reasonably, but the lung-ultrasound claim needs held-out accuracy before it earns its conclusion. read the letter →
The pith
A machine-rendered reading of the paper's core claim, the machinery that carries it, and where it could break.
The reading
What carries the argument
The machinery is fourfold, each tied to a measurement. First, Sobol's variance decomposition splits the network output $f(x_1,\dots,x_k)$ into $f_0 + \sum_i f_i(x_i) + \sum_{i<j} f_{ij}(x_i,x_j) + \cdots$, with first-order index $S_i = V_i/V(y)$ and total index $S_{Ti} = 1 - V_{\sim i}/V(y)$; this is what produces the Glucose/BMI/Age ranking. Second, local sensitivity computes, for each pixel and color channel, the change in the block output norm when that pixel is perturbed: $s_{ij}^C = \|B_q(\dots,x_{ij}+\varepsilon,\dots)\|_2 - \|B_q(\dots,x_{ij},\dots)\|_2$, giving the heatmaps that show depth-dependent decay. Third, activation maximization solves $x^* = \arg\max_x a_{ij}(\theta,x)$ by gradient ascent, regularized by total variation so the synthetic images stay close to natural ones; this yields the feature-visualization and lung-ultrasound images. Fourth, the residual block $\mathrm{Res}(x)=x+F_{\mathrm{act}}(x)$ is the structural reason ResNet-18 preserves sensitivity in deep layers, since the identity shortcut lets input perturbations survive propagation.
What would settle it
Recompute the Sobol indices using samples drawn from the empirical joint distribution of the eight clinical variables (for example, resampling from the actual dataset or a fitted copula) instead of independent uniform ranges, then retrain the four-feature network. If Glucose, BMI, and Age stop dominating the ranking, or if the four-feature accuracy falls well below the reported 80%, the feature-selection conclusion is an artifact of the independence assumption rather than a stable property of the diabetes data.
Extended reading notes
Core claim
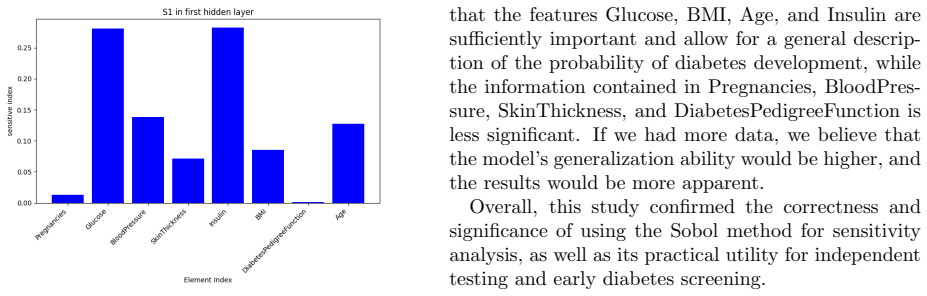
The central discovery is that sensitivity analysis is not just a diagnostic curiosity but a usable tool for deciding what a network really uses. For the eight-input fully connected diabetes network, Sobol global sensitivity indices rank Glucose, BMI, and Age as the dominant first-order contributors; retraining the same architecture on the four most influential features (Glucose, BMI, Age, Insulin) keeps test accuracy at about 80% against 82.5% with all eight inputs, while the four least influential features alone reach only about 69%. In the convolutional setting, the paper finds that local perturbation sensitivity in VGG-16 declines through the five blocks (reaching scale $10^{-2}$), that ResNet-18's residual blocks keep later-layer sensitivity near $10^0$, and that activation maximization with total-variation regularization produces class images that capture distinctive contours (airplane wings, deer antlers, cat ears). Applied to lung ultrasound, the same activation-maximization method highlights B-lines for COVID-19, consolidations for bacterial pneumonia, and A-lines for healthy lungs, matching clinical signs and Grad-CAM heatmaps but with a more focused sensitive area.
Load-bearing premise
The ranking of Glucose, BMI, and Age as the dominant diabetes features rests on treating the eight clinical inputs as independent random variables sampled uniformly over their observed ranges, and on assuming this particular small network's sensitivities mirror the true relationship between those features and diabetes.
Editorial extensions
If this is right
- On tabular clinical data with few features, Sobol indices can serve as a feature-selection step: the paper's four-feature network retains roughly 80% test accuracy, only about 2.5 points below the full model.
- VGG-16's sensitivity falls from scale $10^0$ in early blocks to $10^{-2}$ in the fifth block, implying that adding ever-deeper plain convolutional blocks has diminishing returns for capturing input-level features.
- ResNet-18's residual blocks maintain deep-layer sensitivity around $10^0$, so the identity shortcut is a concrete mechanism that keeps later layers responsive to input perturbations.
- Activation maximization on lung ultrasound highlights clinically named signs—B-lines, consolidations, A-lines—and matches Grad-CAM observations, but with narrower high-sensitivity regions, suggesting it can complement gradient-based attribution in medical imaging.
- When a class image is activated by parameters of another class, the network inserts features of the target class (e.g., antlers into a deer image), showing how activation maximization can reveal class-confusing cues that adversarial attacks might exploit.
Reading between the lines
- A natural next test the paper does not run: recompute the Sobol indices with correlated sampling from the empirical joint distribution. If the Glucose/BMI/Age ranking survives, the method becomes a low-cost screening tool for other small clinical models; if not, the ranking is an artifact of the independence assumption.
- The depth-sensitivity decay in VGG-16 suggests a quantitative architectural heuristic: plot the mean local-sensitivity magnitude per block and stop adding blocks once it drops below a threshold. This is implied by the paper's data but not stated as a design rule.
- The paper's claim that activation maximization is more effective than Grad-CAM on ultrasound is qualitative; a localization benchmark (e.g., comparing highlighted regions against expert-annotated A/B-lines) would turn that comparison into a measurable claim.
- Because the same activation-maximization procedure exposes boundary artifacts that mimic B-lines, it could double as a data-audit tool: run it before training a medical classifier to see which image features are spuriously learnable.
Signed reviews
Editorial analysis
A structured set of objections, weighed in public.
Referee Report
Summary. The paper demonstrates three sensitivity-analysis tools on neural-network models: Sobol global sensitivity analysis on a small fully connected network trained on tabular diabetes data; local input-pixel perturbation sensitivity heatmaps on VGG-16 and ResNet-18 trained on CIFAR-10; and activation maximization (AM) on the same convolutional models, applied finally to a lung-ultrasound (LUS) classification task. The central claims are that Sobol indices identify Glucose, BMI, and Age as the leading diabetes predictors and that reducing the input features from eight to the four most influential (Glucose, BMI, Age, Insulin) loses little accuracy; that local sensitivity maps show decreasing sensitivity with depth in VGG-16 and preserved sensitivity in ResNet-18; and that AM highlights clinically plausible features (B-lines, consolidations, A-lines) in LUS images, more focused than Grad-CAM. The authors provide code repositories for the experiments.
Significance. If the claims hold, the paper would provide a useful empirical illustration that global sensitivity analysis can guide feature pruning in small tabular MLPs and that activation maximization can localize diagnostically relevant ultrasound features. The strengths are the availability of code, the use of established libraries (SALib), the convergence check of Sobol indices with increasing sample size, and the comparisons with PCA and Grad-CAM. However, the load-bearing evidence is qualitative and single-run in the convolutional and medical-imaging parts, and the feature-reduction claim is not supported by statistical confidence measures. As it stands, the contribution is a set of demonstrations rather than a validated methodology.
major comments (4)
- [Section 4 and Conclusion] The claim that the VGG-16 model 'successfully distinguishes' COVID-19, bacterial pneumonia, and normal lungs in Section 4, and that activation maximization 'effectively highlights the medical features', rests on a model for which only 94% training accuracy is reported. Without a held-out test accuracy, per-class metrics, the train/test split, and class balance, the AM heatmaps in Figures 15-16 cannot be separated from patterns learned on dataset artifacts such as probe positioning, gain settings, or text overlays. The manuscript itself acknowledges that 'some boundaries might be mistakenly recognized as significant medical features,' but this does not rescue the claim. Please report test/validation accuracy and per-class performance, and ideally quantify or blind-evaluate the AM and Grad-CAM localizations against clinician annotations.
- [Section 2.2-2.3] The Sobol analysis treats the eight clinical inputs as independent random variables sampled uniformly over their observed ranges via SALib. Clinical variables such as Glucose and Insulin, or Age and BMI, are correlated, and Sobol indices are not uniquely interpretable under dependent inputs; the ranking of Glucose, BMI, Age, and Insulin, and consequently the feature-subset experiment, could change under the true joint distribution. Please state explicitly the sampling ranges and either sample from a dependence-aware distribution (e.g., an empirical copula or a Gaussian copula fitted to the data) or provide a sensitivity check showing that the ranking is robust to the independence assumption. This is load-bearing for the paper's main feature-identification claim.
- [Section 2.3] The feature-reduction comparison reports test accuracy of 82.5% for the full model, 'about 80%' for the four-feature model, and 'about 69%' for the remaining four features, without confidence intervals, number of seeds, or run-to-run variability. At the dataset size used, these differences are within typical training noise, so the statement that feature reduction occurs 'without significant loss of the accuracy' is not supported by the presented evidence. Please report means and standard deviations over multiple random seeds and a statistical comparison (e.g., a paired test or McNemar's test).
- [Section 3.1 and 3.4] The conclusion that sensitivity 'gradually decreases with depth' in VGG-16 and that ResNet-18 preserves sensitivity is based on visual inspection of heatmaps for a single class (airplanes) from a single model, and the plotted scales in Figures 5-10 differ by orders of magnitude (10^0 down to 10^-2). This trend may be partly an artifact of the chosen normalization or output scaling rather than a property of the models. Please provide quantitative summary statistics (e.g., mean or quantiles of the sensitivity per block or layer, aggregated over multiple classes) under a fixed normalization across layers, before drawing conclusions about depth-dependent sensitivity.
minor comments (5)
- [Throughout] There are several typos and grammatical errors, including 'ust' for 'use', 'Iy' for 'It', 'classily' for 'classify', and inconsistent capitalization of 'Grad-Cam' versus 'Grad-CAM'; a thorough proofread is needed.
- [Section 3] The local-sensitivity formula in Section 3 is typeset poorly and is not numbered; the notation for the block operator B_q and the perturbation epsilon should be defined more carefully, including the norm used (the formula shows a squared L2 norm, but the surrounding text says 'sensitivity of the pixel').
- [Section 3.3] The activation maximization update in equation (4) uses two coefficients epsilon_1 and epsilon_2, while equation (5) only has epsilon_1; the relationship between these coefficients and the reported values (epsilon_1 = 0.1, epsilon_2 = 0.1) should be clarified.
- [Section 2.4] The PCA comparison is reported without methodological details, such as whether the features were standardized before PCA, how many components were retained, and how 'most important indicators' were derived from the loadings; please add these details.
- [References] Some references appear mismatched: reference [13] is cited for the diabetes dataset but appears to describe the ADAP learning algorithm, and reference [14] is listed as a Kaggle dataset; please verify the citation-to-source correspondence.
Circularity Check
No significant circularity: the sensitivity and activation-maximization results are post-hoc calculations on fixed trained networks, and the feature-ranking claim is validated by an independent retraining experiment.
full rationale
The paper's central claims are (i) Sobol indices computed on a fixed two-layer network rank Glucose, BMI, and Age as leading inputs; (ii) retraining on the four top-ranked features gives roughly 80% test accuracy versus about 69% for the remaining features; (iii) local sensitivity heatmaps and activation maximization on VGG-16/ResNet-18 reveal depth-dependent sensitivity and class-typical patterns, including lung ultrasound features. Each of these steps computes a statistic of an already-trained network or tests a feature ranking by an independent retraining experiment; no sensitivity index, heatmap value, or activation-maximized image is fed back to adjust network parameters, nor is any fitted constant later renamed as a prediction. The self-citations [7, 12, 20, 27] are background references to visualization and sensitivity methodology and are not load-bearing: they do not supply a uniqueness theorem, an ansatz, or a fitted value that the present experiments merely restate. The absence of reported held-out accuracy for the lung ultrasound model is a correctness or validation concern, not a circularity concern, because even a memorizing model would still produce activation-maximization outputs that are computed from the trained weights rather than being equivalent to the input labels or to a fitted target. Accordingly, no step in the derivation chain reduces by construction to its own inputs.
Assumptions & free parameters
free parameters (3)
- Sobol input ranges for each clinical feature =
min-max from the diabetes dataset
- Network hyperparameters (hidden size 10, lambda 0.001, learning rate 0.01, batch size, epochs) =
chosen by parameter tuning, exact values not fully specified
- Number of Sobol samples =
65,536
assumptions (4)
- domain assumption Sobol analysis assumes input features are independent random variables with specified ranges.
- domain assumption The sensitivity of the trained network reflects the true relation between clinical features and diabetes outcome.
- domain assumption Local pixel perturbations and activation maximization reveal features the network actually uses.
- domain assumption The lung ultrasound labels in the COVID-19 repository are correct.
Cite this review
Pith. "Pith review of Application of Sensitivity Analysis Methods for Studying Neural Network Models." pith.science (2026). https://pith.science/paper/FMZXY2LK
@misc{pith2026250415100,
  author       = {Pith},
  title        = {Pith review of: Application of Sensitivity Analysis Methods for Studying Neural Network Models},
  year         = {2026},
  howpublished = {\url{https://pith.science/paper/FMZXY2LK}},
  note         = {Machine review of arXiv:2504.15100}
}
read the original abstract
This study demonstrates the capabilities of several methods for analyzing the sensitivity of neural networks to perturbations of the input data and interpreting their underlying mechanisms. The investigated approaches include the Sobol global sensitivity analysis, the local sensitivity method for input pixel perturbations and the activation maximization technique. As examples, in this study we consider a small feedforward neural network for analyzing an open tabular dataset of clinical diabetes data, as well as two classical convolutional architectures, VGG-16 and ResNet-18, which are widely used in image processing and classification. Utilization of the global sensitivity analysis allows us to identify the leading input parameters of the chosen tiny neural network and reduce their number without significant loss of the accuracy. As far as global sensitivity analysis is not applicable to larger models we try the local sensitivity analysis and activation maximization method in application to the convolutional neural networks. These methods show interesting patterns for the convolutional models solving the image classification problem. All in all, we compare the results of the activation maximization method with popular Grad-CAM technique in the context of ultrasound data analysis.
Figures


Figures from the paper (12 more)


Reference graph
Works this paper leans on
-
[1]
Neural networks and physical sys- tems with emergent collective computational abil- ities.,
J. J. Hopfield, “Neural networks and physical sys- tems with emergent collective computational abil- ities.,” Proceedings of the national academy of sci- ences, vol. 79, no. 8, pp. 2554–2558, 1982
work page 1982
-
[2]
Highly accurate protein structure prediction with AlphaFold,
J. Jumper, R. Evans, A. Pritzel, T. Green, M. Figurnov, O. Ronneberger, K. Tunyasuvu- nakool, R. Bates, A. ˇZ´ ıdek, A. Potapenko,et al., “Highly accurate protein structure prediction with AlphaFold,” nature, vol. 596, no. 7873, pp. 583– 589, 2021
work page 2021
-
[3]
Video compression dataset and benchmark of learning- based video-quality metrics,
A. Antsiferova, S. Lavrushkin, M. Smirnov, A. Gushchin, D. Vatolin, and D. Kulikov, “Video compression dataset and benchmark of learning- based video-quality metrics,” Advances in Neu- ral Information Processing Systems , vol. 35, pp. 13814–13825, 2022
work page 2022
-
[4]
Neural video compression using spatio-temporal priors,
H. Liu, T. Chen, M. Lu, Q. Shen, and Z. Ma, “Neural video compression using spatio-temporal priors,” arXiv preprint arXiv:1902.07383 , 2019
arXiv 1902
-
[5]
Attention is all you need,
A. Vaswani, “Attention is all you need,” Advances in Neural Information Processing Systems , 2017
2017
-
[6]
P. Kharyuk, D. Nazarenko, I. Oseledets, I. Rodin, O. Shpigun, A. Tsitsilin, and M. Lavrentyev, “Employing fingerprinting of medicinal plants by means of lc-ms and machine learning for species identification task,” Scientific reports , vol. 8, no. 1, p. 17053, 2018
work page 2018
-
[7]
Overview of visualization methods for artificial neural networks,
S. A. Matveev, I. V. Oseledets, E. S. Ponomarev, and A. V. Chertkov, “Overview of visualization methods for artificial neural networks,” Compu- tational Mathematics and Mathematical Physics , vol. 61, no. 5, pp. 887–899, 2021. 9
work page 2021
-
[8]
Hop- field networks is all you need,
H. Ramsauer, B. Sch¨ afl, J. Lehner, P. Seidl, M. Widrich, T. Adler, L. Gruber, M. Holzleit- ner, M. Pavlovi´ c, G. K. Sandve, et al. , “Hop- field networks is all you need,” arXiv preprint arXiv:2008.02217, 2020
arXiv 2008
Show all 34 references
-
[9]
Art of singular vec- tors and universal adversarial perturbations,
V. Khrulkov and I. Oseledets, “Art of singular vec- tors and universal adversarial perturbations,” in Proceedings of the IEEE Conference on Computer Vision and Pattern Recognition , pp. 8562–8570, 2018
2018
-
[10]
Fast feature fool: A data independent approach to uni- versal adversarial perturbations,
K. R. Mopuri, U. Garg, and R. V. Babu, “Fast feature fool: A data independent approach to uni- versal adversarial perturbations,” arXiv preprint arXiv:1707.05572, 2017
2017 arXiv
-
[11]
Explainable artificial in- telligence: an analytical review,
P. P. Angelov, E. A. Soares, R. Jiang, N. I. Arnold, and P. M. Atkinson, “Explainable artificial in- telligence: an analytical review,” Wiley Interdis- ciplinary Reviews: Data Mining and Knowledge Discovery, vol. 11, no. 5, p. e1424, 2021
2021
-
[12]
Ex- ploring specialization and sensitivity of convolu- tional neural networks in the context of simul- taneous image augmentations,
P. Kharyuk, S. Matveev, and I. Oseledets, “Ex- ploring specialization and sensitivity of convolu- tional neural networks in the context of simul- taneous image augmentations,” arXiv preprint arXiv:2503.03283, 2025
2025
-
[13]
Using the ADAP learning algorithm to forecast the onset of diabetes mellitus,
J. W. Smith, J. E. Everhart, W. Dickson, W. C. Knowler, and R. S. Johannes, “Using the ADAP learning algorithm to forecast the onset of diabetes mellitus,” in Proceedings of the annual symposium on computer application in medical care , p. 261, American Medical Informatics Ass...
1988
-
[14]
Diabetes dataset,
M. Akturk, “Diabetes dataset,” Kaggle. com , 2020
2020
-
[15]
J. C. Spall, Introduction to stochastic search and optimization: estimation, simulation, and control . John Wiley & Sons, 2005
2005
-
[16]
Global sensitivity indices for nonlin- ear mathematical models and their Monte Carlo estimates,
I. M. Sobol, “Global sensitivity indices for nonlin- ear mathematical models and their Monte Carlo estimates,” Mathematics and computers in simu- lation, vol. 55, no. 1-3, pp. 271–280, 2001
2001
-
[17]
A fully multiple-criteria implementation of the sobol method for parameter sensitivity analysis,
R. Rosolem, H. V. Gupta, W. J. Shuttle- worth, X. Zeng, and L. G. G. de Gon¸ calves, “A fully multiple-criteria implementation of the sobol method for parameter sensitivity analysis,” Journal of Geophysical Research: Atmospheres , vol. 117, no. D7, 2012
2012
-
[18]
SALib: An open- source python library for sensitivity analysis,
J. Herman and W. Usher, “SALib: An open- source python library for sensitivity analysis,” Journal of Open Source Software , vol. 2, no. 9, p. 97, 2017
2017
-
[19]
On quasi-monte carlo integrations,
I. M. Sobol, “On quasi-monte carlo integrations,” Mathematics and computers in simulation, vol. 47, no. 2-5, pp. 103–112, 1998
1998
-
[20]
Sensitivity analysis of soil parameters in crop model supported with high-throughput computing,
M. Gasanov, A. Petrovskaia, A. Nikitin, S. Matveev, P. Tregubova, M. Pukalchik, and I. Oseledets, “Sensitivity analysis of soil parameters in crop model supported with high-throughput computing,” in International Conference on Computational Science , pp. 731– 741, Springer, 2020
2020
-
[21]
Sensitivity analysis of neural net- work models: Applying methods of analysis of finite fluctuations,
A. Sysoev, A. Ciurlia, R. Sheglevatych, and S. Blyumin, “Sensitivity analysis of neural net- work models: Applying methods of analysis of finite fluctuations,” Periodica polytechnica Elec- trical engineering and computer science , vol. 63, no. 4, pp. 306–311, 2019
2019
-
[22]
Sensi- tivity analysis of weather factors affecting pv mod- ule output power based on artificial neural net- work and sobol algorithm,
C. Zhang, Y. Zhang, J. Zhao, and J. Luo, “Sensi- tivity analysis of weather factors affecting pv mod- ule output power based on artificial neural net- work and sobol algorithm,” in 2020 IEEE/IAS Industrial and Commercial Power System Asia (I&CPS Asia), pp. 246–250, IEEE, 2020
2020
-
[23]
Very deep convolutional networks for large-scale image recognition,
K. Simonyan, “Very deep convolutional networks for large-scale image recognition,” arXiv preprint arXiv:1409.1556, 2014
2014 arXiv
-
[24]
Learning multiple layers of features from tiny images,
K. Alex, “Learning multiple layers of features from tiny images,” https://www. cs. toronto. edu/kriz/learning-features-2009-TR. pdf, 2009
2009
-
[25]
Neu- ralSens: Sensitivity Analysis of Neural Networks,
J. Pizarroso, J. Portela, and A. Mu˜ noz, “Neu- ralSens: Sensitivity Analysis of Neural Networks,” Journal of Statistical Software , vol. 102, no. 7, p. 1–36, 2022
2022
-
[26]
Do cifar-10 classifiers generalize to cifar-10?,
B. Recht, R. Roelofs, L. Schmidt, and V. Shankar, “Do cifar-10 classifiers generalize to cifar-10?,” arXiv preprint arXiv:1806.00451 , 2018
2018 arXiv
-
[27]
Fast gradient-free acti- vation maximization for neurons in spiking neural networks,
N. Pospelov, A. Chertkov, M. Beketov, I. Os- eledets, and K. Anokhin, “Fast gradient-free acti- vation maximization for neurons in spiking neural networks,” Neurocomputing, vol. 618, p. 129070, 2025
2025
-
[28]
Deep inside convolutional networks: Visualising image classification models and saliency maps,
K. Simonyan, A. Vedaldi, and A. Zisserman, “Deep inside convolutional networks: Visualising image classification models and saliency maps,” arXiv preprint arXiv:1312.6034 , 2013
2013 arXiv
-
[29]
Deep resid- ual learning for image recognition,
K. He, X. Zhang, S. Ren, and J. Sun, “Deep resid- ual learning for image recognition,” in Proceedings of the IEEE conference on computer vision and pattern recognition, pp. 770–778, 2016
2016
-
[30]
Accelerating de- tection of lung pathologies with explainable ultra- sound image analysis,
J. Born, N. Wiedemann, M. Cossio, C. Buhre, G. Br¨ andle, K. Leidermann, J. Goulet, A. Au- jayeb, M. Moor, B. Rieck, et al., “Accelerating de- tection of lung pathologies with explainable ultra- sound image analysis,” Applied Sciences, vol. 11, no. 2, p. 672, 2021. 10
2021
-
[31]
Gan ran xing fei yan chao sheng zhen duan zhuan jia jian yi,
C. U. G. of Ultrasound Medicine Committee, C. M. E. Association, et al., “Gan ran xing fei yan chao sheng zhen duan zhuan jia jian yi,” Zhong Hua Yi Xue Chao Sheng Za Zhi(Dian Zi Ban) , vol. 17, no. 03, p. 244, 2020
2020
-
[32]
Grad-cam: Visual explanations from deep networks via gradient-based localization,
R. R. Selvaraju, M. Cogswell, A. Das, R. Vedan- tam, D. Parikh, and D. Batra, “Grad-cam: Visual explanations from deep networks via gradient-based localization,” in Proceedings of the IEEE international conference on computer vi- sion, pp. 618–626, 2017
2017
-
[33]
Explainable AI for clinical and remote health applications: a sur- vey on tabular and time series data,
F. Di Martino and F. Delmastro, “Explainable AI for clinical and remote health applications: a sur- vey on tabular and time series data,” Artificial Intelligence Review, vol. 56, no. 6, pp. 5261–5315, 2023
2023
-
[34]
Sobol tensor trains for global sensitiv- ity analysis,
R. Ballester-Ripoll, E. G. Paredes, and R. Pa- jarola, “Sobol tensor trains for global sensitiv- ity analysis,” Reliability Engineering & System Safety, vol. 183, pp. 311–322, 2019. 11
2019
Reviewed August 16, 2026 · model on record in the stance chip above.
Discussion (0). Continue with ORCID to comment.