REVIEW 4 major objections 5 minor 18 references
Detection of Shilling Attack Based on T-distribution on the Dynamic Time Intervals in Recommendation Systems
T0 review · 4 major / 5 minor · reviewed 2026-08-14 · deepseek-v4-flash
Pith's one-line read The paper claims that shilling attacks can be detected item-by-item as a dense, statistically distinct window in the item's own rating timeline.
desk verdict Plausible heuristic for detecting dense rating bursts, but the load-bearing t-statistic is an unvalidated invention and the reported detection rates rest on thresholds tuned to the same attack simulations. read the letter →
The pith
A machine-rendered reading of the paper's core claim, the machinery that carries it, and where it could break.
The reading
What carries the argument
The central object is the dynamic time-window partition $W_k$ of an item's rating history, produced by the DTI algorithm from the item-ratings time gaps series $\mathrm{IRTGS}_k$. The partition does the main work: by cutting at the largest timestamp gaps, it guarantees that a cost-saving attack burst, dense by assumption, is placed in a single window rather than smeared across fixed windows. The statistical engine is the modified two-sample T statistic in formula (7) with the nonstandard degrees of freedom $m+n-2$, where $m$ and $n$ count distinct rating kinds (1 to 5) rather than sample sizes; the paper motivates this as amplifying differences when a window has many ratings but few distinct values. Pairwise critical-value comparisons produce a 0-1 window-similarity matrix, and a final mean-based rule converts suspicious windows into attack windows. The whole mechanism turns the qualitative premise that attacks are quick and dense into a concrete, tunable, item-level detector controlled by thresholds $\alpha$ and $\beta$.
What would settle it
Draw many pairs of rating windows from the same rating distribution, compute formula (7) with degrees of freedom $m+n-2$, and count how often the value passes the 95% boundary; if the rate is far from 5%, the distributional assumption is false and the reported detection rates need a nonparametric explanation.
Extended reading notes
Core claim
On the paper's own terms, the discovery is that the quickness of a shilling attack is a detectable signature in the item's time series: attackers must inject many profiles in a short interval, so an item under attack contains one unusually dense, statistically different window. The DTI algorithm converts the rating history $H_k$ into a time-gap series, recursively splits at the maximum gap until the gap spread falls below $\alpha$ or the series length falls below $\beta$, and thereby isolates the burst. The T-distribution stage computes modified window means $\bar{x}_i^*$ over the number of distinct rating kinds $m$, variances over the ratings, and a pairwise statistic $T_{ij}$ with degrees of freedom $m+n-2$; comparing $T_{ij}$ to tabulated 95% boundary values yields a symmetric 0-1 matrix. Windows whose 1-count exceeds the average, whose timestamp span is below average, and whose rating count is above average are declared attack windows. The paper reports this pipeline as outperforming three item-based baselines on detection rate, false-alarm rate, and time overhead for random, average, and bandwagon attacks in both push and nuke forms.
Load-bearing premise
The load-bearing premise is that the statistic in formula (7) follows a t-distribution when the degrees of freedom count the number of distinct rating values in each window, not the number of ratings; the paper gives no derivation or citation for this modification, and if it fails the 0-1 matrix has no statistical foundation.
Editorial extensions
If this is right
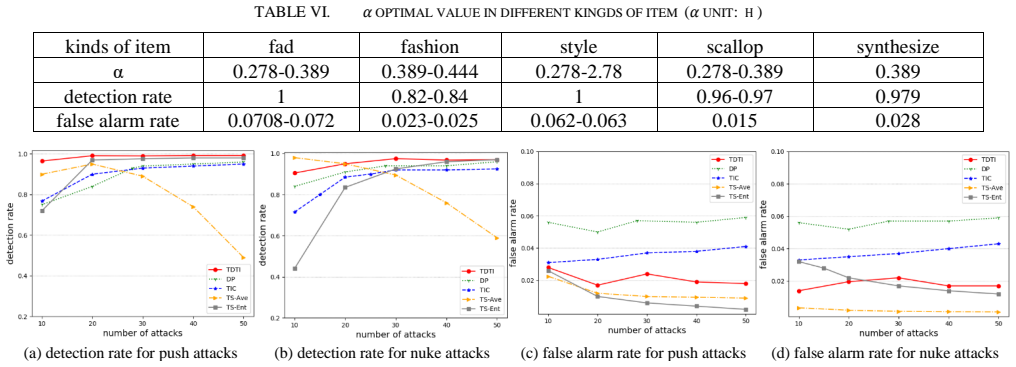
- At attack size 10 for push attacks, TDTI detects 0.965 of injected attack profiles against 0.75 for DP, and rises to 0.99-0.992 once the attack size reaches 20 or more.
- For nuke attacks, TDTI holds near 0.97 at attack size 50, where the static-window TS-Ave baseline has decayed to 0.59.
- False-alarm rate stays below 0.028 for the tested push and nuke configurations, and the paper claims the method also has smaller time overhead than the baselines.
- Across the four MovieLens item rhythms, fad items are easiest to protect (push 0.99, nuke above 0.91) and scallop items hardest, because their continuous normal rating stream makes the attack window less isolated.
Reading between the lines
- A natural next step the paper leaves implicit is a streaming version: because each pairwise comparison uses only the item's timestamps and ratings, the same test can be rerun as ratings arrive and could fire an alarm as soon as a burst crosses the boundary.
- The degrees-of-freedom choice is the part most likely to transfer poorly; on a different rating scale or rating-sparsity regime, the $m+n-2$ rule and the $\alpha$ threshold would need re-estimation rather than reuse.
- If a nonparametric rank-sum test applied to the same DTI windows matched TDTI's detection rates, it would show that the dynamic windowing, not the t-distribution assumption, is what makes the method work, which is an experiment the paper does not run.
Signed reviews
Editorial analysis
A structured set of objections, weighed in public.
Referee Report
Summary. The paper proposes TDTI, an item-level shilling attack detector that first partitions an item's rating history into time windows using a recursive gap-splitting algorithm (DTI) and then flags abnormal windows using a modified two-sample t-test. The T-statistic in Eq. (7) is compared against critical values whose degrees of freedom are computed from the number of rating kinds, and windows are classified as suspicious via a 0-1 consistency matrix. Experiments on MovieLens 100k compare TDTI with DP, TIC, and TS on push/nuke attacks across attack sizes and filler sizes, reporting higher detection rates and lower false alarm rates.
Significance. If the statistical machinery were valid, the paper would offer a practical item-level detector with strong detection rates (e.g., 0.965 vs. 0.75 for DP at attack size 10) and stable performance under nuke attacks. The paper has clear strengths: it uses a public dataset, compares against several relevant baselines, and openly describes its DTI algorithm and threshold selection. However, the central statistical claim rests on an unvalidated modification of the t-test, and the evaluation uses thresholds fitted on the same simulated attack types that are later tested. These issues undermine the reported quantitative claims and the claimed theoretical grounding.
major comments (4)
- [Section IV.B, Eq. (7)] The T-statistic in Eq. (7) is stated to follow a t-distribution with m+n-2 degrees of freedom, where m and n are defined in Eqs. (1)-(2) as the number of rating kinds (1..5) in each window, not the number of ratings. The standard two-sample t-test uses sample sizes for both the pooled variance and the degrees of freedom; the paper provides no derivation, citation, or simulation to justify replacing sample sizes with rating-category counts. Since the 0-1 matrix in Table IV and the subsequent suspicious/attack window selection depend on comparing T_ij against the critical values in Table II, every reported detection and false-alarm rate in Figs. 7-9 inherits this unvalidated distributional assumption. The extra terms in Eq. (7) (the (a0-ai) adjustment and the denominator factor) are likewise introduced without derivation, so the statistic as written has no evident statistical foundation.
- [Section III vs. Section IV.B] The paper is internally inconsistent about the meaning of degrees of freedom. Section III states that the degree of freedom 'is related to the sample size n,' and that smaller samples give smaller degrees of freedom and flatter t-curves. Yet Eq. (7) and Table II use the number of rating kinds (at most 5 per window) as the effective sample size for degrees of freedom. This contradiction is not a presentation issue: it means the t-distribution boundary values in Table II are being applied to a statistic whose sampling distribution is not established. A correct analysis would need either a derivation of the modified statistic's null distribution or a standard t-test with actual sample sizes.
- [Section V.D.1, Table VI, Figs. 7-9] The thresholds alpha and beta are fitted to the same kind of simulated attacks used in the evaluation. Specifically, alpha is selected by injecting 50 push attacks with filler size 0 and varying alpha to maximize detection while minimizing false alarm (Fig. 6, Table VI), and beta is set to 10 based on 'a large number of experiments.' The reported detection rates in Fig. 7, Fig. 8, and Fig. 9 are then obtained on simulated attacks generated under the same assumptions and with these fitted thresholds. This circularity means the comparison against DP, TIC, and TS does not establish that TDTI generalizes to unseen attack configurations; an out-of-sample evaluation or a sensitivity analysis with thresholds fixed independently of the test attacks is needed before the 'higher detection rate' claim can be accepted.
- [Abstract and Section V] The abstract claims 'smaller time overhead' as one of the method's advantages, but Section V reports no runtime or complexity measurements whatsoever. The only mention of time is the statement in Section IV.A that setting beta to 10 gives 'the optimal value' for DTI running time, with no quantitative comparison against the other methods. Without timing experiments, the time-overhead claim is unsupported and should either be substantiated or removed from the abstract and conclusions.
minor comments (5)
- [Definition 4] Definition 4 defines window size as ws_x = z for w_x = {h_j, ..., h_j+z}, but the number of elements in that set is z+1; the definition appears off by one.
- [Fig. 6 caption] The caption of Fig. 6 lists '(b) Impact of α on scallop items' and '(d) Impact of α on scallop items' for two different panels; one of these should likely be 'fashion' based on the four item types described in the text.
- [Algorithm 2, line 13] Line 13 uses both T_i.count(1) and T_j.count(0) but the matrix is symmetric; the formula appears to be an unusual way to define z_i, and it is unclear whether 'T_j' is a typo for 'T_i' or refers to a row/column comparison. Please clarify.
- [Section V.D.2] The text describing Fig. 7 says 'the filler size isn't considered here' for the compared methods, but the experimental setup in Section V.D states filler sizes 1%, 3%, 5%, 7%, 10% are used; the relationship between these two statements should be clarified.
- [Typos and language] There are numerous typographical and grammatical issues, e.g., 'experimentg' in Section V.D.1, 'the different between the rating mean' in Section IV.B, and 'the smaller image in the middle of Fig. 3 is zoomed.' A careful language edit is needed.
Circularity Check
No significant circularity: the method is a heuristic detector and its claims are empirical, not derived from its assumptions by identity.
full rationale
The paper does not invoke self-citations as load-bearing evidence; all references are to the external shilling-attack and statistics literature. The central formula (7) is an ad hoc modification of the two-sample t-test (using the number of rating kinds, not sample sizes, for m and n), but this is an unsupported statistical assumption, not a circular step: detection rates do not follow from the formula by algebraic identity. The thresholds α and β are tuned on simulated attacks in Section V.D.1, and the evaluation in Section V.D.2 uses attacks generated to satisfy the method's density preconditions; this limits external validity and risks overfitting, but threshold selection on a validation distribution is conventional experimental practice rather than a derivation that reduces to its inputs. The final mean-split labeling rule reflects the standard push/nuke attack models (target items rated r_max/r_min), so the benchmark is self-consistent but not definitionally equivalent to the detection output. No equation in the paper is shown to be equal to its inputs, and no fitted parameter is renamed as a prediction. Accordingly, no step meets the stated bar for circularity.
Assumptions & free parameters
free parameters (2)
- alpha (time-gap threshold for DTI stopping) =
0.389 hours (synthesized optimum)
- beta (minimum sequence length for DTI recursion) =
10
assumptions (3)
- domain assumption Attackers inject a large number of fake profiles in a short period, and injection periods are tiny time intervals throughout the item lifecycle.
- ad hoc to paper The modified T-statistic T_ij in formula (7) follows a t-distribution with m+n-2 degrees of freedom, where m and n are the number of rating kinds.
- ad hoc to paper Using the number of rating kinds instead of the number of ratings in the modified mean and degrees of freedom increases sensitivity.
Cite this review
Pith. "Pith review of Detection of Shilling Attack Based on T-distribution on the Dynamic Time Intervals in Recommendation Systems." pith.science (2026). https://pith.science/paper/FTXR7WVM
@misc{pith2026190806967,
  author       = {Pith},
  title        = {Pith review of: Detection of Shilling Attack Based on T-distribution on the Dynamic Time Intervals in Recommendation Systems},
  year         = {2026},
  howpublished = {\url{https://pith.science/paper/FTXR7WVM}},
  note         = {Machine review of arXiv:1908.06967}
}
read the original abstract
With the development of information technology and the Internet, recommendation systems have become an important means to solve the problem of information overload. However, recommendation system is greatly fragile as it relies heavily on behavior data of users, which makes it very easy for a host of malicious merchants to inject shilling attacks in order to manipulate the recommendation results. Some papers on shilling attack have proposed the detection methods, whether based on false user profiles or abnormal items, but their detection rate, false alarm rate, universality, and time overhead need to be further improved. In this paper, we propose a new item anomaly detection method, through T-distribution technology based on Dynamic Time Intervals. First of all, based on the characteristics of shilling attack quickness (Attackers inject a large number of fake profiles in a short period in order to save costs), we use dynamic time interval method to divide the rating history of item into multiple time windows. Then, we use the T-distribution to detect the exception windows. By conducting extensive experiments on a dataset that accords with real-life situations and comparing it to currently outstanding methods, our proposed approach has a higher detection rate, lower false alarm rate and smaller time overhead to the different attack models and filler sizes.
Figures


Figures from the paper (2 more)

Reference graph
Works this paper leans on
-
[1]
A literature review and classification of recommender systems research ,
D. H. Park, H. K. Kim, I. Y. Choi, and J. K. Kim, “A literature review and classification of recommender systems research ,” International Conference on Social Science and Humanity , vol. 5, 2011, pp. 10059- 10072
work page 2011
-
[2]
Classification features for attack detection in collaborative recommender systems,
R. Burke, B. Mobasher, C. Williams, and R. Bhaumik, “Classification features for attack detection in collaborative recommender systems,” in ACM SIGKDD International Conference on Knowledge Discovery and Data Mining, 2006, pp. 542-547
work page 2006
-
[3]
Collaborative recommendation: A robustness analysis ,
M. P. O'Mahony, N. Hurley, N. Kushmerick, and G. Silvestre , “Collaborative recommendation: A robustness analysis ,” in ACM Transactions on Internet Technology, vol. 4, no. 4, November 2004, pp. 344-377
work page 2004
-
[4]
Shilling recommender systems for fun and profit,
S. K. Lam and J. Riedl, “Shilling recommender systems for fun and profit,” in ACM International Conference on World Wide Web, WWW 2004, New York, USA, May 2004, pp. 393-402
work page 2004
-
[5]
Recommender Systems: Attack Types and Strategies ,
M. P. O'Mahony, N. J. Hurley, and G. C. M. Silvestre, “Recommender Systems: Attack Types and Strategies ,” Twentieth National Conference on Artificial Intelligence and the Seventeenth Innovative Applications of Artificial Intelligence Conference, 2005, pp. 334-339
work page 2005
-
[6]
Solving the apparent diversity-accuracy dilemma of recommender systems ,
T. Zhou, Z . Kuscsik, J. G. Liu, and M. Medo , “Solving the apparent diversity-accuracy dilemma of recommender systems ,” Proceedings of the National Academy of Sciences of the United States of America, 2010, pp. 4511-4515
work page 2010
-
[7]
Lies and prop aganda: detecting spam users in collaborative filtering ,
B. Mehta, T. Hofmann, and P. Fankhauser , “Lies and prop aganda: detecting spam users in collaborative filtering ,” in ACM International Conference on Intelligent User Interfaces, IUI 2007, Honolulu, Hawaii, USA, January 2007, pp. 14-21
work page 2007
-
[8]
The Student t-Distribution for Any Degrees of Freedom is Infinitely Divisible,
E. Grosswald, “The Student t-Distribution for Any Degrees of Freedom is Infinitely Divisible,” The Annals of Probability, Springer-Verlag, 1976, pp. 680-683
work page 1976
Show all 18 references
-
[9]
Item Anomaly Detection Based on Dynamic Partition for Time Series in Recommender Systems,
M. Gao, et al., “Item Anomaly Detection Based on Dynamic Partition for Time Series in Recommender Systems,” PLOS ONE, vol. 10, 2015, pp. 135-155
2015
-
[10]
Effective diverse and obfuscated attacks on model-based recommender systems,
Z. Cheng and N. Hurley, “Effective diverse and obfuscated attacks on model-based recommender systems,” in ACM Conference on Recommender Systems, RecSys 2009, New York, Ny, Usa, October 2009, pp. 141-148
2009
-
[11]
Detecting Profile Injection Attacks in Collaborative Recommender Systems,
R. Burke, B. Mobasher, C. Williams, and R. Bhaumik, “Detecting Profile Injection Attacks in Collaborative Recommender Systems,” the 8th IEEE International Conference on E-Commerce Technology and the 3rd IEEE International Conference on Enterprise Computing, E-Commerce, and E- ...
2006
-
[12]
Unsupervised strategies for shilling detection and robust collaborative filtering,
B. Mehta and W. Nejdl, “Unsupervised strategies for shilling detection and robust collaborative filtering,” User Modeling and User -Adapted Interaction, vol. 19, no. 1-2, Springer, February 2009, pp. 65-97
2009
-
[13]
Defending recommender systems: detection of profile injection attacks ,
C. A. Williams, B. Mobasher, and R. Burke, “Defending recommender systems: detection of profile injection attacks ,” Service-Oriented Computing and Applications, Springer-Verlag, London, August 2007, pp. 157-170
2007
-
[14]
Unsupervised Retrieval of Attack Profiles in Collaborative Recommender Systems ,
K. Bryan, M. O’Mahony, and P. Cunningham, “Unsupervised Retrieval of Attack Profiles in Collaborative Recommender Systems ,” in ACM Conference on Recommender Systems, RecSys 2008, Lausanne, Switzerland, October 2008, pp. 155-162
2008
-
[15]
Attack detection in time series for recommender systems ,
S. Zhang, A. Chakrabarti, J. Ford, and F. Makedon, “Attack detection in time series for recommender systems ,” in ACM SIGKDD International Conference on Knowledge Discovery and Data Mining , KDD 2006 , Philadelphia, Pennsylvania, USA, August 2006, pp. 809-814
2006
-
[16]
Detection of abnormal item based on time intervals for recommender systems,
M. Gao, Q. Yuan, B. Ling, and Q. Xiong , “Detection of abnormal item based on time intervals for recommender systems,” The Scientific World Journal, Hindawi Publishing Corporation, 2014
2014
-
[17]
Semi-SAD: applying semi - supervised learning to shilling attack detection,
Z. Wu, J. Cao, B. Mao, and Y . Wang, “Semi-SAD: applying semi - supervised learning to shilling attack detection,” in ACM Conference on Recommender Systems, RecSys 2011, Chicago, Illinois, USA , October 2011, pp. 289-292
2011
-
[18]
Discussion on t-Distribution and Its Application,
X. Shen, and R. Wu, “Discussion on t-Distribution and Its Application,” Statistical and Application, Hans, December 2015, pp. 319-334
2015
Reviewed August 14, 2026 · model on record in the stance chip above.
Discussion (0). Continue with ORCID to comment.