REVIEW 4 major objections 3 minor 1 cited by
Finding Novel Precursors for Solar Wind Stream Interaction Regions with Interpretable Deep Learning
T0 review · 4 major / 3 minor · reviewed 2026-06-27 · grok-4.3
Pith's one-line read A lightweight Transformer detects solar wind stream interaction regions and ranks proton density, magnetic field, and flow deflection as top precursors.
desk verdict SIREN shows a compact Transformer can hit ROC-AUC 0.93 on SIR detection and attributes 13-17% to transverse velocity, but the results inherit whatever biases sit in the catalog labels. read the letter →
The pith
A machine-rendered reading of the paper's core claim, the machinery that carries it, and where it could break.
The reading
What carries the argument
SIREN two-layer Transformer encoder with self-attention weights and Integrated Gradients attribution applied to sequences of eleven solar wind parameters.
What would settle it
Re-labeling the 102 test events by an independent panel of experts or running the model on simultaneous multi-spacecraft observations at separated heliocentric distances would test whether the reported performance and feature ranking persist.
Extended reading notes
Core claim
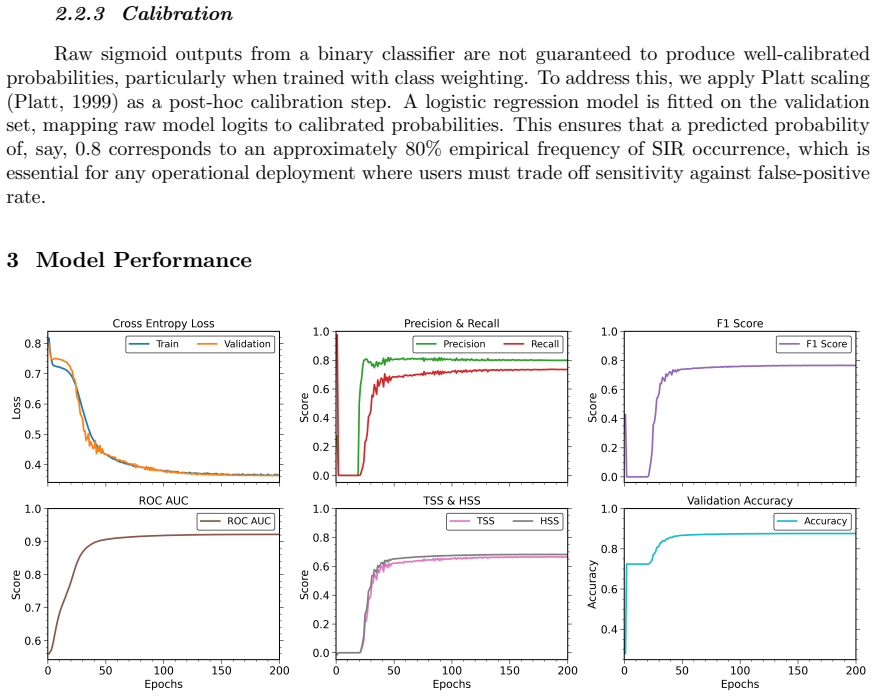
SIREN is a compact Transformer with approximately 100000 parameters that processes eleven in-situ solar wind measurements spanning magnetic field, velocity, and thermodynamic quantities. Trained with weighted binary cross-entropy and cosine annealing, then calibrated via Platt scaling, the model yields per-timestep SIR probabilities. On 102 held-out events it records ROC-AUC 0.93, F1 0.78, and true skill statistic 0.67. Self-attention focuses on the interaction region, and Integrated Gradients attribution assigns 24.3 percent to proton density, 21.6 percent to magnetic field magnitude, 13.9 percent to temperature, 12.1 percent to bulk speed, and 13-17 percent combined to Vy and flow angle.
Load-bearing premise
The human-generated or catalog-derived labels used to train and evaluate the model are accurate and free of systematic bias, and the post-hoc attributions correctly isolate physically causal features rather than spurious correlations present in the training distribution.
Editorial extensions
If this is right
- Continuous probability outputs permit operators to select detection thresholds matched to specific operational requirements.
- The quantified contribution of transverse velocity and flow angle establishes flow deflection as a measurable and consistent SIR signature.
- The lightweight architecture demonstrates that compact interpretable models can reach high performance on space-weather classification tasks.
- Attribution methods confirm that decisions rest on the physically relevant portion of each input sequence.
Reading between the lines
- The reported feature hierarchy could be used to derive simplified, physics-informed detection rules that incorporate flow deflection explicitly.
- Retraining or testing the same architecture on data from additional spacecraft would indicate whether the precursor ranking changes with radial distance from the Sun.
- Embedding the continuous probabilities into ensemble forecasting systems could improve lead-time estimates for recurrent geomagnetic storms.
- The combination of attention and gradient attribution supplies a reusable template for uncovering new signatures in other solar-wind time series.
Editorial analysis
A structured set of objections, weighed in public.
Referee Report
Summary. The paper introduces SIREN, a lightweight two-layer Transformer encoder (~100k parameters) that ingests sequences of 11 in-situ solar wind parameters to perform per-timestep binary detection of stream interaction regions (SIRs). Trained with weighted binary cross-entropy and cosine annealing, followed by Platt scaling, the model reports ROC-AUC 0.93, F1 0.78 and TSS 0.67 on a held-out test set of 102 events. Self-attention weights are shown to focus on the SIR interval, while Integrated Gradients attributions rank proton density (24.3 %) and |B| (21.6 %) highest, with transverse velocity Vy and flow angle together contributing 13–17 % and thereby identifying flow deflection as a previously under-quantified signature. The work positions the continuous probability output as operationally flexible and the attribution pipeline as a template for interpretable space-weather models.
Significance. If the reported performance and attributions survive independent label validation and temporal-split verification, the result would supply a compact, reproducible, and physically grounded alternative to subjective catalog construction, while the quantified contribution of flow deflection could motivate targeted observational or simulation studies of SIR morphology.
major comments (4)
- [Abstract, §3] Abstract and §3 (data & labels): the central performance figures (ROC-AUC 0.93, F1 0.78) and the Integrated Gradients ranking rest on the assumption that the human- or catalog-derived labels are an unbiased proxy for true SIR occurrence. The abstract itself states that existing catalogs rely on subjective thresholds and miss complex events, yet no cross-catalog comparison, independent expert re-labeling, or sensitivity test to label noise is described; any systematic bias in the labels is therefore inherited by both the metrics and the claimed “novel precursor.”
- [§4] §4 (experimental setup): no information is supplied on whether the train–test split of the time-series data respects chronological order. In recurrent solar-wind data, non-temporal splitting risks leakage of future SIR signatures into the training set, which would directly inflate the reported test-set metrics and render the attribution results circular.
- [Results] Results paragraph and Table 2 (if present): the abstract gives point estimates for ROC-AUC, F1 and TSS on the 102-event test set but supplies neither bootstrap or binomial confidence intervals nor a breakdown by event morphology; without these, it is impossible to judge whether the claimed superiority over catalog thresholds is statistically robust.
- [§5.2] §5.2 (attribution analysis): the claim that transverse velocity and flow angle constitute a “consistent but previously under-quantified SIR signature” is supported only by post-hoc Integrated Gradients on a model trained on the same labels; no external physical validation (e.g., comparison with MHD simulations or independent in-situ studies) is provided to distinguish causal contribution from correlation induced by the labeling procedure itself.
minor comments (3)
- [Abstract, §2] The abstract states “approximately 100,000 trainable parameters” but does not give the exact count or the embedding/hidden dimension that would allow reproduction; add the precise architecture table.
- [§2] Notation for the 11 input parameters is introduced only in the abstract; a compact table listing each variable, its units, and its source instrument would improve clarity for readers outside the immediate sub-field.
- [Abstract, §5.2] The phrase “flow deflection as a consistent but previously under-quantified SIR signature” appears without a supporting citation to prior literature that quantified the same feature; add the relevant references or qualify the novelty claim.
Simulated Author's Rebuttal
We thank the referee for their thorough and constructive review. The comments correctly identify gaps in label validation, experimental transparency, statistical reporting, and external attribution support. We respond point-by-point below and indicate the revisions that will be incorporated.
read point-by-point responses
-
Referee: [Abstract, §3] Abstract and §3 (data & labels): the central performance figures (ROC-AUC 0.93, F1 0.78) and the Integrated Gradients ranking rest on the assumption that the human- or catalog-derived labels are an unbiased proxy for true SIR occurrence. The abstract itself states that existing catalogs rely on subjective thresholds and miss complex events, yet no cross-catalog comparison, independent expert re-labeling, or sensitivity test to label noise is described; any systematic bias in the labels is therefore inherited by both the metrics and the claimed “novel precursor.”
Authors: We agree that label quality is a foundational issue. The manuscript notes subjectivity in existing catalogs but does not quantify its impact through cross-catalog comparison or noise sensitivity tests. In revision we will expand §3 with a discussion of label limitations, add a limited cross-catalog consistency check using an independent SIR list where overlap exists, and include a simple label-perturbation sensitivity experiment. A full independent expert re-labeling campaign lies outside the scope of the present study and will be noted as future work. revision: partial
-
Referee: [§4] §4 (experimental setup): no information is supplied on whether the train–test split of the time-series data respects chronological order. In recurrent solar-wind data, non-temporal splitting risks leakage of future SIR signatures into the training set, which would directly inflate the reported test-set metrics and render the attribution results circular.
Authors: The referee correctly flags an important omission. Our split was performed chronologically (training data ending before the test interval begins) to avoid leakage; however, this was not stated in the text. We will revise §4 to document the exact temporal boundaries, the rationale for the split, and verification that no future information entered training. revision: yes
-
Referee: [Results] Results paragraph and Table 2 (if present): the abstract gives point estimates for ROC-AUC, F1 and TSS on the 102-event test set but supplies neither bootstrap or binomial confidence intervals nor a breakdown by event morphology; without these, it is impossible to judge whether the claimed superiority over catalog thresholds is statistically robust.
Authors: We accept that point estimates alone limit assessment of robustness. In the revised results section we will report bootstrap confidence intervals for ROC-AUC, F1 and TSS and add a morphology-stratified performance table (simple vs. complex SIRs) to allow readers to evaluate stability across event types. revision: yes
-
Referee: [§5.2] §5.2 (attribution analysis): the claim that transverse velocity and flow angle constitute a “consistent but previously under-quantified SIR signature” is supported only by post-hoc Integrated Gradients on a model trained on the same labels; no external physical validation (e.g., comparison with MHD simulations or independent in-situ studies) is provided to distinguish causal contribution from correlation induced by the labeling procedure itself.
Authors: The attribution is indeed post-hoc and label-dependent. We will revise §5.2 to moderate the language, explicitly state that the result is model-derived, add citations to existing in-situ studies of SIR flow deflection, and frame the finding as a hypothesis-generating observation that warrants targeted MHD or observational follow-up. No new external validation data will be added at this stage. revision: partial
Circularity Check
No circularity: standard ML training and post-hoc attribution on held-out data
full rationale
The paper describes training a Transformer model on catalog-derived labels, evaluating performance metrics on a held-out test set of 102 events, and applying Integrated Gradients for feature attribution. No equations, self-citations, or derivations reduce the reported ROC-AUC, F1, or feature percentages to the inputs by construction. The central results are empirical outputs of supervised learning rather than tautological renamings or fitted parameters relabeled as predictions. Label quality is an external assumption but does not create a self-referential derivation chain within the paper's own steps.
Assumptions & free parameters
free parameters (2)
- ~100000 model parameters
- Platt scaling parameters
assumptions (2)
- domain assumption Training and test labels for SIR presence are accurate and representative of the underlying physical distribution.
- ad hoc to paper Integrated Gradients and self-attention weights recover physically meaningful causal contributions rather than dataset-specific correlations.
Cite this review
Pith. "Pith review of Finding Novel Precursors for Solar Wind Stream Interaction Regions with Interpretable Deep Learning." pith.science (2026). https://pith.science/paper/FV25EKFQ
@misc{pith2026260612661,
  author       = {Pith},
  title        = {Pith review of: Finding Novel Precursors for Solar Wind Stream Interaction Regions with Interpretable Deep Learning},
  year         = {2026},
  howpublished = {\url{https://pith.science/paper/FV25EKFQ}},
  note         = {Machine review of arXiv:2606.12661}
}
read the original abstract
Solar wind stream interaction regions (SIRs) drive recurrent geomagnetic storms, yet most existing catalogs rely on expert inspection and simple thresholds that are subjective and can miss events with complex morphologies. We present SIREN (SIR Encoder Network), a lightweight Transformer based model for per timestep SIR detection from in situ solar wind observations. The model ingests sequences of 11 solar wind parameters, spanning magnetic field, velocity, and thermodynamic properties. With approximately 100,000 trainable parameters in a two layer encoder architecture, SIREN is trained using weighted binary cross entropy loss and a cosine annealing learning rate. Platt scaling is applied to produce well-calibrated detection probabilities. On a held-out test set of 102 events, the calibrated model achieves a ROC-AUC of 0.93, F1 score of 0.78, and true skill statistic of 0.67. Analysis of the self-attention weights confirms that the model concentrates on the SIR, grounding its decisions in the physically relevant portion of each sequence. Integrated Gradients attribution reveals a quantifiable feature hierarchy: proton density (24.3%) and magnetic field magnitude (21.6%) dominate, followed by temperature (13.9%) and bulk speed (12.1%). Notably, the transverse velocity component Vy and east-west flow angle together contribute 13-17%, identifying flow deflection as a consistent but previously under-quantified SIR signature. By producing continuous probabilities rather than binary labels, SIREN enables flexible threshold tuning for operational use and provides a template for compact, interpretable deep-learning systems in space weather.
Figures


Figures from the paper (5 more)


Forward citations
Cited by 1 Pith paper
-
Statistical insights on the decorrelation lengths of solar wind parameters at L1 point under varying conditions
Using ACE and Wind measurements, the authors report decorrelation lengths from ~270 RE (Bz in stream interaction regions) to ~8700 RE (bulk speed), with composition the least coherent parameter.
Reference graph
Works this paper leans on
-
[1]
Alielden, K., Camporeale, E., Kors´ os, M. B., & Taroyan, Y. (2023, March). Prediction Inter- val of Interface Regions: Machine Learning Nowcasting Approach.Space Weather,21(3), e2022SW003326. doi: 10.1029/2022SW003326 Alves, M. V., Echer, E., & Gonzalez, W. D. (2006, July). Geoeffectiveness of corotating interaction regions as measured by Dst index.Journ...
-
[2]
doi: 10.1088/0004-637X/798/2/135 Camporeale, E., Car` e, A., & Borovsky, J. E. (2017, November). Classification of Solar Wind With Machine Learning.Journal of Geophysical Research (Space Physics),122(11), 10,910-10,920. doi: 10.1002/2017JA024383 Chi, Y., Shen, C., Luo, B., Wang, Y., & Xu, M. (2018, December). Geoeffectiveness of Stream Interaction Regions...
-
[3]
Echer, E., Tsurutani, B. T., & Gonzalez, W. D. (2013, January). Interplanetary origins of moderate (-100 nT ¡ Dst≤-50 nT) geomagnetic storms during solar cycle 23 (1996-2008).Journal of Geophysical Research (Space Physics),118(1), 385-392. doi: 10.1029/2012JA018086 Gonz´ alez-Avil´ es, J. J., Riley, P., Ben-Nun, M., Mayank, P., & Vaidya, B. (2024, August)...
-
[4]
doi: 10.1051/swsc/2024014 Gosling, J. T., Asbridge, J. R., Bame, S. J., & Feldman, W. C. (1978, April). Solar wind stream inter- faces.Journal of Geophysical Research,83(A4), 1401-1412. doi: 10.1029/JA083iA04p01401 Gosling, J. T., & Pizzo, V. J. (1999, July). Formation and Evolution of Corotating Interaction Regions and their Three Dimensional Structure.S...
-
[5]
Decoupled Weight Decay Regularization
doi: 10.1007/ s11207-022-01962-1 Hu, A., Camporeale, E., & Swiger, B. (2023, April). Multi-Hour-Ahead Dst Index Prediction Using Multi-Fidelity Boosted Neural Networks.Space Weather,21(4), e2022SW003286. doi: 10.1029/2022SW003286 Ishii, M., Costa, J. E. R., Kuznetsova, M. M., Andries, J., Gopalswamy, N., Belehaki, A., . . . Inter- national Space Weather C...
-
[6]
doi: 10.1007/s12036-025-10107-2 Mayank, P., Lotz, S., Vaidya, B., Mishra, W., & Chakrabarty, D. (2024, November). Study of Evolution and Geo-effectiveness of Coronal Mass Ejection–Coronal Mass Ejection Interactions Using Magnetohydrodynamic Simulations with SWASTi Framework.The Astrophysical Jour- nal,976(1),
-
[7]
doi: 10.3847/1538-4357/ad8084 Mayank, P., Vaidya, B., & Chakrabarty, D. (2022, 09). Swasti-sw: Space weather adaptive simulation framework for solar wind and its relevance to the aditya-l1 mission.The Astrophysical Journal Supplement Series,262,
-
[8]
Retrieved 2023-01-31, fromhttps://doi.org/10.3847/1538 -4365/ac8551doi: 10.3847/1538-4365/ac8551 Mayank, P., Vaidya, B., Mishra, W., & Chakrabarty, D. (2023, 12). Swasti-cme: A physics-based model to study coronal mass ejection evolution and its interaction with solar wind.The Astrophysical Journal Supplement Series,270, 10-10. doi: 10.3847/1538-4365/ad08...
Show all 15 references
-
[9]
(2024).The next decade of discovery in solar and space physics: Exploring and safeguarding humanity’s home in space
doi: 10.1007/ s12036-025-10064-w National Academies of Sciences, Engineering, and Medicine. (2024).The next decade of discovery in solar and space physics: Exploring and safeguarding humanity’s home in space. Ofman, L., Yogesh, & Giordano, S. (2024, jul). Understanding the var...
2024 doi
- [10]
-
[11]
T., Gonzalez, W
doi: 10.3847/1538-4357/ada93c Tsurutani, B. T., Gonzalez, W. D., Gonzalez, A. L. C., Guarnieri, F. L., Gopalswamy, N., Grande, M., . . . Vasyliunas, V. (2006, July). Corotating solar wind streams and recurrent geomagnetic activity: A review.Journal of Geophysical Research (Spa...
2006 doi
-
[12]
A., & Mayank, P
doi: 10.1088/0004-637X/782/2/81 Vysakh, P. A., & Mayank, P. (2023, November). Solar Flare Prediction and Feature Selection Using a Light-Gradient-Boosting Machine Algorithm.Solar Physics,298(11),
2023 doi
-
[13]
(2021, May)
doi: 10.1007/ s11207-023-02223-5 Yogesh, Chakrabarty, D., & Srivastava, N. (2021, May). Evidence for distinctive changes in the solar wind helium abundance in solar cycle 24.Monthly Notices of the Royal Astronomical Society,503(1), L17-L22. doi: 10.1093/mnrasl/slab016 Yogesh, ...
2021 doi
-
[14]
G., Niranjana, Martinovi´ c, M., Howes, G
doi: 10.3847/1538-4357/ad84d6 Yogesh, Ofman, L., Klein, K. G., Niranjana, Martinovi´ c, M., Howes, G. G., . . . et al. (2026, March). Solar Wind Heating near the Sun: A Radial Evolution Approach.The Astrophysical Journal, 999(2),
2026 doi
-
[15]
S., Deehr, C
doi: 10.3847/1538-4357/ae4582 Zhang, Y., Sun, W., Feng, X. S., Deehr, C. S., Fry, C. D., & Dryer, M. (2008, August). Statistical analysis of corotating interaction regions and their geoeffectiveness during solar cycle 23.Jour- nal of Geophysical Research (Space Physics),113(A8...
2008 doi
Reviewed June 27, 2026 · model on record in the stance chip above.
Discussion (0). Continue with ORCID to comment.