REVIEW 4 major objections 6 minor 33 references
XAI-Guided Analysis of Residual Networks for Interpretable Pneumonia Detection in Paediatric Chest X-rays
T0 review · 4 major / 6 minor · reviewed 2026-08-06 · deepseek-v4-flash
Pith's one-line read A fine-tuned ResNet-50 on paediatric chest X-rays reaches 95.94% accuracy and 98.91% AUC-ROC, with BayesGrad-CAM heatmaps that also quantify where the model is unsure.
desk verdict The classification numbers are plausible, but the paper's central novelty—BayesGrad-CAM uncertainty—is likely vacuous as described because the ResNet-50 has no dropout layers for Monte Carlo dropout. read the letter →
The pith
A machine-rendered reading of the paper's core claim, the machinery that carries it, and where it could break.
The reading
What carries the argument
The core mechanism is BayesGrad-CAM, an extension of Grad-CAM in which the gradient-weighted activation map is averaged over stochastic forward passes with Monte Carlo dropout, yielding an expectation map and a per-pixel variance map that serves as uncertainty. The paper partitions each heatmap into six anatomical lung zones and reports mean activations per zone, and it defines residuals $r_i = \hat{p}_i - y_i$ to quantify prediction errors. These objects together carry the argument that spatial explanations and uncertainty estimates can be attached to a standard classifier without architectural changes.
What would settle it
Re-annotate a random subset of the test and validation images with multiple independent paediatric radiologists, measure inter-rater agreement (e.g., Cohen's kappa) between the original labels and the new annotations, and retrain on the clean labels; if agreement is low or the retrained model's accuracy drops markedly, the central claim of 95.94% accuracy against trustworthy ground truth is falsified.
Extended reading notes
Core claim
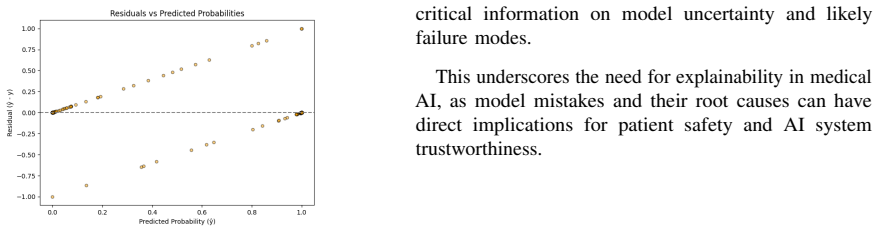
The central claim is that a fine-tuned ResNet-50, trained with class-balanced sampling, data augmentation, and full-layer fine-tuning, reaches 95.94% accuracy, 97.49% sensitivity, 98.91% AUC-ROC, and 0.913 Cohen's kappa on the test split of the paediatric chest X-ray dataset, outperforming a published ResNet transfer-learning baseline on accuracy and AUC. The model also produces BayesGrad-CAM explanations, computed with 20 Monte Carlo dropout forward passes, that are said to localise pneumonia-related regions and quantify spatial uncertainty, with 83% of false positives showing high uncertainty in critical regions versus 12% of true positives. A residual analysis, defined as the difference between predicted probability and ground truth label ($r_i = \hat{p}_i - y_i$), is used to identify confidently wrong predictions and to bridge calibration and interpretability.
Load-bearing premise
The load-bearing assumption is that the ground-truth labels on the paediatric chest X-ray dataset correctly indicate pneumonia, even though the paper notes the original annotation procedure has no documented inter-rater agreement, protocol, or quality assurance; if the labels are noisy, every reported metric and explanation inherits that noise.
Editorial extensions
If this is right
- The model's high recall (97.49%) means few missed pneumonia cases on this test split, the error mode clinicians most want to avoid.
- The uncertainty maps give a direct signal for referral: patches the model marks as high-uncertainty can be routed to a radiologist rather than taken at face value.
- Residual analysis identifies high-confidence misclassifications that accuracy alone hides, pointing to cases needing re-annotation.
- The comparison with the published baseline suggests that careful fine-tuning of a standard ResNet can beat earlier transfer-learning results without architectural novelty.
Reading between the lines
- If the correlation between high uncertainty and false positives generalises beyond this test set, uncertainty maps could be used as a triage threshold that flags borderline Normal reads for human review, effectively trading a small increase in workload for a reduction in false positives.
- Because the dataset's annotation protocol is undocumented, the absolute metrics likely overstate performance on independently annotated or cleaner datasets; a re-annotation study of a random subset would reveal how much of the reported kappa is label agreement rather than model skill.
- The six-zone activation analysis could be turned into a quantitative benchmark against radiologist-drawn regions of interest, giving an overlap metric that the current paper lacks.
- Extending Monte Carlo dropout to other explanation methods could test whether the uncertainty signal is specific to Grad-CAM or a general property of the model's confidence.
Editorial analysis
A structured set of objections, weighed in public.
Referee Report
Summary. The paper proposes a fine-tuned ResNet-50 for binary pneumonia detection in paediatric chest X-rays from the Kermany dataset, augmented with Grad-CAM and a Bayesian extension (BayesGrad-CAM) that aims to quantify uncertainty in visual explanations. The authors report high test-set metrics (accuracy 95.94%, AUC-ROC 98.91%, Cohen's kappa 0.913) and claim that uncertainty maps identify uncertain false positives (83% of false positives with U^c > 0.4 versus 12% of true positives). The paper also includes residual analysis, misclassification analysis, and a discussion of label noise and interpretability limitations. The central scientific claim is that the model achieves both high accuracy and clinically useful uncertainty-aware explanations.
Significance. If the claims hold, the paper would provide a useful demonstration that a standard ResNet-50 can achieve state-of-the-art classification on a widely used paediatric pneumonia dataset while also offering spatial explanations with calibrated uncertainty. The manuscript has several genuine strengths: it uses a well-known public dataset, reports a reasonable set of classification metrics, explicitly discusses label noise in the Kermany dataset, and acknowledges that the saliency maps are not validated against expert annotations. The paper also includes a reproducibility statement and a detailed training configuration. However, the central novelty—Bayesian uncertainty in Grad-CAM—rests on an underspecified Monte Carlo dropout implementation that may, as written, produce identically zero uncertainty maps. The reported data splits and confusion matrix also contain numerical inconsistencies. Therefore, the paper cannot be accepted in its current form; the claims require substantive technical clarification and correction.
major comments (4)
- [Section IV-E and Appendix A] The Monte Carlo dropout implementation is not specified in a way that supports the uncertainty computation. The text in Section IV-E says the uncertainty map is estimated via MC dropout with 20 stochastic forward passes, but Section IV-C and Appendix A describe only a fine-tuned torchvision ResNet-50 with the final fully connected layer replaced. A standard torchvision ResNet-50 has no Dropout modules. If no dropout layers were inserted, all 20 forward passes are deterministic, making U^c identically zero and rendering Figures 5(d) and the 83%/12% false-positive claim vacuous. Please specify the exact location(s) of any dropout layers, the dropout probability, and how test-time stochasticity was implemented. This is the load-bearing element of the interpretability claim and must be resolved.
- [Section VI-E] The confusion matrix in Section VI-E does not sum to the stated evaluation set size. The text says the matrix was computed on the combined test and validation sets, which by the split in Section IV-E totals 640 images (121+199 normal and pneumonia each). The matrix entries sum to 624 (198+36+6+384), with class totals of 234 Normal and 390 Pneumonia, not the expected 242 and 398. Moreover, the sensitivity (98.46%) and specificity (84.62%) derived from this matrix are inconsistent with the test-set recall of 97.49% reported in Table I. The authors must reconcile these numbers and clarify exactly which images were used for the confusion matrix and for the headline metrics.
- [Section VI-B] The claim that 83% of false positives show high uncertainty (U^c > 0.4) versus 12% of true positives uses an uncertainty threshold that is not justified. No rationale is given for choosing 0.4, and the result appears to be post hoc. The paper should report the full distribution of U^c for both classes, describe how the threshold was selected (or present a threshold-free summary such as AUC of the uncertainty map as a discriminator of correctness), and provide confidence intervals for the 83%/12% estimates. As written, this result is not sufficiently supported.
- [Section IV-A and Section XI] The abstract and conclusion state that the model provides 'clinically meaningful visual explanations,' but Section XI explicitly acknowledges that the saliency maps were not quantitatively validated against expert-annotated regions of interest. Given the known label noise in the Kermany dataset (also acknowledged in Section IV-A), the clinical meaningfulness claim is overreaching. The authors should temper the wording in the abstract and conclusion, or include a quantitative clinician-based evaluation, even if only on a small subset.
minor comments (6)
- [References] The reference list contains several malformed entries (e.g., 'et al. Adebayo J, Gilmer J.') and inconsistent formatting; please reformat according to the journal's style.
- [Figure 1] Figure 1 labels the interpretation module as 'Grad-CAM/Score-CAM,' but Score-CAM is not defined or used anywhere in the text; the figure should be reconciled with the actual method.
- [Section IV-B and Appendix A] The rotation augmentation range is stated as ±15 degrees in Section IV-B but ±10 degrees in Appendix A; the descriptions should be consistent.
- [Section IV-D] The table of mean activations for anatomical zones appears without a caption or explicit reference in the text; please add a caption and a sentence describing what the table demonstrates.
- [Section VI-B] The phrase 'computational overhead is minimal (¡15% inference time increase)' uses '¡' instead of '<'; also, it is unclear how the 15% figure was measured, so please provide details.
- [Table I and Section VI-A] The reported Cohen's kappa is given as 0.913 in Table I and as 0.9132 elsewhere, and MCC as 0.9134 in the text; please standardize the precision and verify that the values are distinct metrics.
Circularity Check
No significant circularity: the classification results are evaluated on a held-out split, and the interpretability method extends external cited work rather than importing load-bearing self-citations.
full rationale
The paper's central accuracy, AUC-ROC, and Cohen's kappa results are computed on a held-out test set (320 images) after training on a separately defined training split, so no fitted parameter is renamed as a prediction. The BayesGrad-CAM formulation follows the external citations of De and Maity (2020) and Gal and Ghahramani (2016), and no uniqueness theorem from the authors' prior work is invoked to force a choice. The reported uncertainty statistic (83% of false positives above U^c > 0.4 versus 12% of true positives) is presented as an observed contingency, not as a parameter fitted to the test set, so it does not reduce to an input by construction. The paper's own limitations—unvalidated saliency maps against expert annotations, undocumented label quality in the Kermany dataset, and lack of source code release—are acknowledged in Sections IV-A and XI, but these are correctness and reproducibility concerns, not circular reasoning. One internal inconsistency deserves note but is not circularity: Section IV-E describes Monte Carlo dropout with 20 stochastic forward passes, while the model architecture described in Section IV-C and Appendix A is a standard fine-tuned ResNet-50 with no specified dropout layers; if no dropout was inserted, the uncertainty map would be identically zero and the 83%/12% claim would lack a mechanism. That is a technical flaw in the described pipeline, not a case where a derivation is equivalent to its inputs by definition.
Assumptions & free parameters
free parameters (2)
- Uncertainty threshold U_c > 0.4 =
0.4
- Sigmoid decision threshold =
unstated
assumptions (3)
- domain assumption Kermany ground-truth labels accurately represent the pneumonia status of each X-ray.
- domain assumption Monte Carlo dropout with 20 forward passes approximates the Bayesian posterior over model parameters.
- domain assumption Grad-CAM heatmaps localize clinically meaningful pathological regions.
Cite this review
Pith. "Pith review of XAI-Guided Analysis of Residual Networks for Interpretable Pneumonia Detection in Paediatric Chest X-rays." pith.science (2026). https://pith.science/paper/FWARCVW4
@misc{pith2026250718647,
  author       = {Pith},
  title        = {Pith review of: XAI-Guided Analysis of Residual Networks for Interpretable Pneumonia Detection in Paediatric Chest X-rays},
  year         = {2026},
  howpublished = {\url{https://pith.science/paper/FWARCVW4}},
  note         = {Machine review of arXiv:2507.18647}
}
read the original abstract
Pneumonia remains one of the leading causes of death among children worldwide, underscoring a critical need for fast and accurate diagnostic tools. In this paper, we propose an interpretable deep learning model on Residual Networks (ResNets) for automatically diagnosing paediatric pneumonia on chest X-rays. We enhance interpretability through Bayesian Gradient-weighted Class Activation Mapping (BayesGrad-CAM), which quantifies uncertainty in visual explanations, and which offers spatial locations accountable for the decision-making process of the model. Our ResNet-50 model, trained on a large paediatric chest X-rays dataset, achieves high classification accuracy (95.94%), AUC-ROC (98.91%), and Cohen's Kappa (0.913), accompanied by clinically meaningful visual explanations. Our findings demonstrate that high performance and interpretability are not only achievable but critical for clinical AI deployment.
Figures


Figures from the paper (11 more)




Reference graph
Works this paper leans on
-
[1]
et al. Adebayo J, Gilmer J. Sanity checks for saliency maps. arXiv preprint arXiv:1810.03292, 2020. Accessed 6/4/25
arXiv 2020
-
[2]
A. Barhoom et al. Alaa M. Diagnosis of pneumonia using deep learning. IJAER pub:2643-9085, 2022. Accessed March 12, 2025
work page 2022
-
[3]
Chen W. et al. An Q. A deep convolutional neural network for pneumonia detection in x-ray images with attention ensemble. Diagnostics (Basel), 2024. Accessed March 12, 2025
work page 2024
-
[4]
P et al. Aravind. Multi-label chest x-ray classification via deep learning. arXiv preprint arXiv:2211.14929, 2022. Published November 27; Accessed March 12, 2025
work page Pith review arXiv 2022
-
[5]
Grad-cam++: Generalized gradient-based visual explanations for deep convolutional networks
Aditya Chattopadhay, Anirban Sarkar, Prantik Howlader, and Vineeth N Balasubramanian. Grad-cam++: Generalized gradient-based visual explanations for deep convolutional networks. In 2018 IEEE Winter Conference on Applications of Computer Vision (WACV), pages 839--847. IEEE, 2018. doi:10.1109/WACV.2018.00097
arXiv 2018
-
[6]
Transfer learning method in the problem of binary classification of chest X-rays
Kudinov D. Transfer learning method in the problem of binary classification of chest x-rays. arXiv preprint arXiv:2303.10601, 2023. Published March 19; Accessed March 12, 2025
work page Pith review arXiv 2023
-
[7]
Bayesian grad-cam: Variational bayesian approach for visual explanation of deep neural networks
Shaun De and Abhishek Maity. Bayesian grad-cam: Variational bayesian approach for visual explanation of deep neural networks. IEEE Access, 8: 0 209047--209057, 2020
work page 2020
-
[8]
Eraser. Eraser diagramming platform. https://www.eraser.io, 2024. Used for generating pipeline visualizations
work page 2024
Show all 33 references
-
[9]
Larrazabal A. et al. Gender imbalance in medical imaging datasets produces biased classifiers for computer-aided diagnosis. PubMed pub:32457147, 2020. Accessed May 29, 2025
2020
-
[10]
Transfusion: Understanding transfer learning for medical imaging
Raghu M et al. Transfusion: Understanding transfer learning for medical imaging. ArXiv preprint arXiv:1902.07208, 2019 a . Accessed May 30, 2025
1902 arXiv
-
[11]
A survey on image data augmentation for deep learning
Shorten C et al. A survey on image data augmentation for deep learning. doi:10.1186/s40537-019-0197-0, 2019 b . Accessed May 30, 2025
2019 doi
-
[12]
Zech J. et al. Variable generalization performance of a deep learning model to detect pneumonia in chest radiographs: A cross-sectional study. PubMed pub:30399157, 2018. Accessed May 30, 2025
2018
-
[13]
Dropout as a bayesian approximation: Representing model uncertainty in deep learning
Yarin Gal and Zoubin Ghahramani. Dropout as a bayesian approximation: Representing model uncertainty in deep learning. In international conference on machine learning, pages 1050--1059. PMLR, 2016
2016
-
[14]
A transfer learning method with deep residual network for pediatric pneumonia diagnosis
Lixin Zheng Gaobo Liang. A transfer learning method with deep residual network for pediatric pneumonia diagnosis. pubmed:31262537, 2019. URL https://pubmed.ncbi.nlm.nih.gov/31262537/
2019
-
[15]
Haibo He and Edwardo A. Garcia. Learning from imbalanced data. IEEE Transactions on Knowledge and Data Engineering, 21 0 (9): 0 1263--1284, 2009. Accessed 6/4/25
2009
-
[16]
Deep residual learning for image recognition
Kaiming He, Xiangyu Zhang, Shaoqing Ren, and Jian Sun. Deep residual learning for image recognition. In Proceedings of the IEEE Conference on Computer Vision and Pattern Recognition (CVPR), pages 770--778, 2016. doi:10.1109/CVPR.2016.90. URL https://doi.org/10.1109/CVPR.2016.9...
2016 doi
-
[17]
Jaderberg M
et al. Jaderberg M. Spatial transformer networks. arXiv preprint arXiv:1506.02025, 2015. URL https://arxiv.org/abs/1506.02025. Accessed May 30, 2025
2015 arXiv
-
[18]
Normal chest x-ray, 2023
Kenhub. Normal chest x-ray, 2023. URL https://www.kenhub.com/en/library/anatomy/normal-chest-x-ray. Accessed on 2025-06-04
2023
-
[19]
Labeled optical coherence tomography (oct) and chest x-ray images for classification
Daniel Kermany, Kang Zhang, and Michael Goldbaum. Labeled optical coherence tomography (oct) and chest x-ray images for classification. Mendeley Data, 2018. doi:10.17632/rscbjbr9sj.2. URL http://dx.doi.org/10.17632/rscbjbr9sj.2. Accessed May 30, 2025
2018 doi
-
[20]
Alex Krizhevsky, Ilya Sutskever, and Geoffrey E. Hinton. Imagenet classification with deep convolutional neural networks. In Advances in Neural Information Processing Systems (NeurIPS), pages 1097--1105, 2012. URL https://papers.nips.cc/paper/2012/hash/c399862d3b9d6b76c8436e92...
2012
-
[21]
Litjens G
et al. Litjens G. A survey on deep learning in medical image analysis. arXiv preprint arXiv:1702.05747, 2017. URL https://arxiv.org/abs/1702.05747. Accessed May 30, 2025
2017 arXiv
-
[22]
Yiwei et al. Liu. Optimized dropkey-based grad-cam: Toward accurate image feature localization. Sensors (Basel), 2023. Accessed March 12, 2025
2023
-
[23]
Decoupled weight decay regularization
Ilya Loshchilov and Frank Hutter. Decoupled weight decay regularization. International Conference on Learning Representations (ICLR), 2019. URL https://arxiv.org/abs/1711.05101. Accessed: 2025-06-03
2019 arXiv
-
[24]
A unified approach to interpreting model predictions
Scott Lundberg and Su-In Lee. A unified approach to interpreting model predictions. arXiv preprint arXiv:1705.07874, 2017. URL https://arxiv.org/abs/1705.07874. Accessed 6/4/25
2017 arXiv
-
[25]
Pytorch: An imperative style, high-performance deep learning library
Adam Paszke, Sam Gross, Francisco Massa, Adam Lerer, James Bradbury, Gregory Chanan, Trevor Killeen, Zeming Lin, Natalia Gimelshein, Luca Antiga, Alban Desmaison, Andreas Kopf, Edward Yang, Zachary DeVito, Martin Raison, Alykhan Tejani, Sasank Chilamkurthy, Benoit Steiner, Lu ...
2019
-
[26]
R Mothkur
et al. R Mothkur. Grad-cam based visualization for interpretable lung cancer categorization using deep cnn models. 10.35882/jeeemi.v7i3.690, pages 567--580, May 2025. URL https://jeeemi.org/index.php/jeeemi/article/view/690. Accessed 6/4/25
2025 doi
-
[27]
Irvin J. et al. Rajpurkar P. Chexnet: Radiologist-level pneumonia detection on chest x-rays with deep learning. arXiv preprint arXiv:1711.05225, 2017. Accessed March 12, 2025
2017 arXiv
-
[28]
why should i trust you?
Marco Tulio Ribeiro, Sameer Singh, and Carlos Guestrin. “why should i trust you?”: Explaining the predictions of any classifier. Proceedings of the 22nd ACM SIGKDD International Conference on Knowledge Discovery and Data Mining, 2016
2016
-
[29]
Grad-cam: Visual explanations from deep networks via gradient-based localization
Ramprasaath R Selvaraju, Michael Cogswell, Abhishek Das, Ramakrishna Vedantam, Devi Parikh, and Dhruv Batra. Grad-cam: Visual explanations from deep networks via gradient-based localization. arXiv preprint arXiv:1610.02391, 2016
-
[30]
Very deep convolutional networks for large-scale image recognition
Karen Simonyan and Andrew Zisserman. Very deep convolutional networks for large-scale image recognition. In International Conference on Learning Representations (ICLR), 2015. URL https://arxiv.org/abs/1409.1556. Accessed 6/4/25
2015 arXiv
-
[31]
Mohammad
Tasfia Tanzina, Asif Shafin, and Sifat et al. Mohammad. Explainable lung disease classification from chest x-ray images utilizing deep learning and xai. arXiv preprint arXiv:2404.11428, 2024. Published April 17; Accessed March 12, 2025
2024 arXiv
-
[32]
The effectiveness of data augmentation in image classification using deep learning
Linda Wang and Alexander Wong. The effectiveness of data augmentation in image classification using deep learning. arXiv preprint arXiv:1712.04621, 2017. URL https://arxiv.org/abs/1712.04621. Accessed May 30, 2025
2017 arXiv
-
[33]
Covid-net: A tailored deep convolutional neural network design for detection of covid-19 cases from chest x-ray images
Linda Wang and Alexander Wong. Covid-net: A tailored deep convolutional neural network design for detection of covid-19 cases from chest x-ray images. arXiv preprint arXiv:2003.09871, 2020. URL https://arxiv.org/abs/2003.09871. Accessed May 30, 2025
2003 arXiv
Reviewed August 6, 2026 · model on record in the stance chip above.
Discussion (0). Sign in to comment.