REVIEW 3 major objections 5 minor 9 references
A Method for an Untriggered, Time-Dependent, Source-Stacking Search for Neutrino Flares
T0 review · 3 major / 5 minor · reviewed 2026-08-14 · deepseek-v4-flash
Pith's one-line read This paper constructs an untriggered, time-dependent, source-stacking search for repeated neutrino flares, and shows by simulation that summing per-flare test statistics after decorrelation boosts discovery power for many moderate flares.
desk verdict A useful new test statistic for repeated neutrino flares, with a plausible qualitative advantage that the quantitative comparison doesn't yet fully pin down. read the letter →
The pith
A machine-rendered reading of the paper's core claim, the machinery that carries it, and where it could break.
The reading
What carries the argument
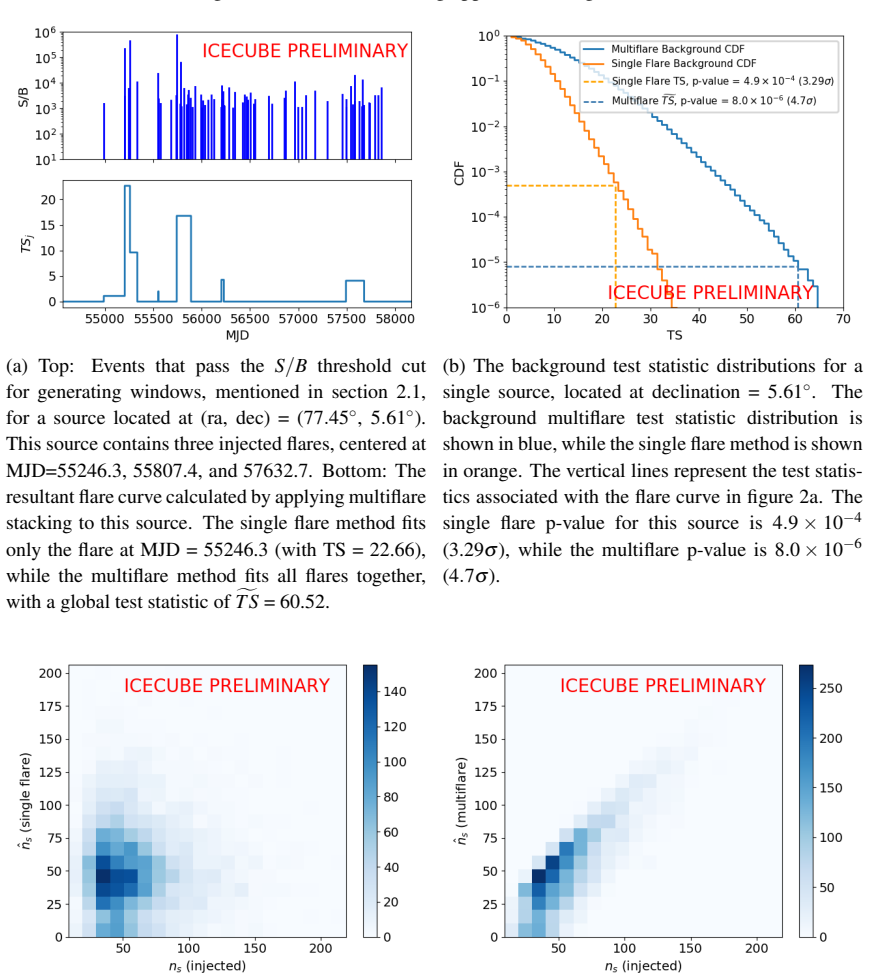
The load-bearing object is the global test statistic of Eq. 2.7, obtained by summing the per-window test statistics $TS_j$ after a decorrelation procedure removes windows that overlap with a higher-test-statistic window. Each per-window statistic is a likelihood ratio comparing a box-shaped flare hypothesis, with a source signal PDF built from spatial, energy, and uniform-in-window time terms, to the background, with a $\Delta T_{\rm data}/\Delta T_j$ trials penalty that compensates for the many short windows. The decorrelation step turns the list of candidate windows into a 'neutrino flare curve' for a source, and the sum over the surviving windows is the discovery statistic. For catalogs, a binomial stacking step selects how many top sources to co-add, at the cost of a trial factor.
What would settle it
Recalculate the 3-$\sigma$ discovery potentials in Figure 4 with injected flare intensities drawn from $\alpha=2$ and $\alpha=4$, with flare durations of 10 and 300 days, and with $E^{-1.5}$ and $E^{-2.5}$ spectra; if multi-flare stacking no longer beats the single-flare and time-integrated methods across a substantial middle range of $I_o$, the paper's central claim is not robust to the unknown flare distribution.
Extended reading notes
Core claim
The paper's central claim is that an untriggered, time-dependent, source-stacking search can be built by summing individual flare test statistics, and that this sum substantially improves discovery potential when a source produces many comparable flares. The global test statistic is $\widetilde{TS} = \sum_{j: TS_j>0} TS_j$ after a decorrelation step that keeps only non-overlapping windows with the largest test statistics. Over a source catalog, the per-source values are summed, and a binomial procedure chooses the number of top sources to stack. In simulations with flare intensities drawn from $N(I)=A_m(\alpha-1)/I_o\,(I/I_o)^{-\alpha}$, with flare durations fixed at 100 days and $E^{-2}$ spectra, the method recovers injected signal events more accurately than the single-flare fit and reaches 3-$\sigma$ discovery at a lower normalization $A_m$ than either existing method over a middle range of flare intensities. For very small flares the time-integrated method remains superior, and for very large flares the single-flare fit is competitive.
Load-bearing premise
The load-bearing premise is that the real neutrino flare population is reasonably described by the power law $N(I)=A_m(\alpha-1)/I_o\,(I/I_o)^{-\alpha}$ with parameters near the illustrated $\alpha=3$ slices, since the paper's quantitative claim of improved discovery potential is computed only for that assumed population, with flare durations fixed at 100 days and $E^{-2}$ spectra.
Editorial extensions
If this is right
- A source that flares many times at moderate strength, like the behavior suggested for TXS 0506+056, becomes testable on the full IceCube sample with one coherent statistic rather than by combining separately chosen flares.
- A detection with this method would directly reveal the number, timing, and fitted spectra of individual neutrino flares through the per-source flare curve.
- For the Fermi 3LAC blazar catalog, multi-flare stacking improves the 3-sigma discovery potential over the existing limits in the moderate-flare region.
- The self-triggered catalog of high-energy IceCube events offers a way to look for neutrino flares without relying on electromagnetic associations.
Reading between the lines
- The same summed-statistic construction could be run with windows seeded by external gamma-ray flare catalogs instead of the neutrino S/B cut, which would test whether the multi-flare gain persists when window selection is independent of the neutrino data.
- If the true flare population has a steeper or shallower intensity index than $\alpha=3$, the region where multi-flare stacking wins will shift, so measuring $\alpha$ from future multi-flare candidates is the key observational step.
- Letting flare durations float rather than fixing them at 100 days would map how much of the gain comes from the box-window construction and how much from the assumed flare length.
Signed reviews
Editorial analysis
A structured set of objections, weighed in public.
Referee Report
Summary. The paper proposes "multiflare stacking," an untriggered, time-dependent, source-stacking search for multiple neutrino flares from the same source. Test windows are formed from all event pairs passing an S/B threshold, each window is assigned a per-flare test statistic TS_j based on a box-shaped signal hypothesis (Eqs. 2.1–2.6), overlapping windows are removed by a greedy decorrelation procedure, and the remaining TS_j values are summed into a global test statistic ~TS (Eq. 2.7). The method is extended to source catalogs via a binomial stacking procedure that optimizes the number of sources stacked (Eqs. 2.8–2.9). The performance is studied with injected signals drawn from a descriptive power-law intensity distribution (Eq. 3.1), and 3σ discovery potentials are presented for two catalogs: the top 500 Fermi 3LAC blazars and a self-triggered catalog of the 32 highest-energy IceCube events. The central claim, stated in the abstract and Section 5, is that for signals consisting of many small flares, this method gives a significant increase in discovery potential over both the existing single-flare fit and time-integrated stacking.
Significance. If the headline claim were robustly established, the method would fill a genuine gap: existing untriggered searches are optimized for single dominant flares or time-integrated emission, while the TXS 0506+056 results motivate a search for repeated moderate flares. The paper is clearly written and honest about its limitations; it explicitly labels the injection power law as descriptive rather than predictive and calls the chosen parameter slice (α=3, 100-day flares, E⁻²) purely demonstrative. The algorithm is well defined, and the simulation framework is self-consistent, including a useful sanity check in Figure 3 showing that multiflare stacking recovers the injected number of signal events more accurately than the single-flare fit. However, the central quantitative claim is currently supported only by comparisons to analytic or published limits rather than by direct algorithm-to-algorithm comparisons on identical pseudo-experiments, and the exploration of the injection parameter space is very narrow. These issues make the unqualified abstract claim stronger than the evidence presented.
major comments (3)
- [Section 4, Figures 4a and 4b] The central claim of a "significant increase in discovery potential" is not established by a head-to-head comparison. The single-flare limits are calculated analytically by integrating Eq. 3.1 and applying a binomial test, not by running the existing single-flare likelihood fit on the same simulated events. The time-integrated limits are taken from the published flux limits of Ref. [6], which were derived for the Fermi 2LAC blazar catalog, whereas the test catalog here is the top 500 Fermi 3LAC blazars. This conflates algorithm performance with differences in catalog composition, data sample, and analysis details. Please re-run the competing methods (or representative implementations thereof) on the same pseudo-experiments used for the multiflare discovery-potential curves, or explicitly restrict the claim to "improvement relative to analytic baselines derived from Ref. [6]" and adjust the abstract accordingly.
- [Section 4, Figure 4 and Section 3, Eq. 3.1] The discovery potential is demonstrated only for a single slice of the injection parameter space: α=3, flare durations fixed to 100 days, and an E⁻² spectrum. The paper itself states that this choice is "purely for the purposes of demonstration." Because Eq. 3.1 is descriptive and the true neutrino-flare intensity distribution is unconstrained, the size of the claimed improvement, and even whether it exists in a given region, may depend on α and on the flare duration distribution. Please show at least a few additional slices (e.g., α=2 and α=4, and a second flare duration) or, if computation time is a barrier, state explicitly as a caveat in the abstract and conclusions that the improvement is demonstrated only for this illustrative slice.
- [Section 4.2, self-triggered catalog] The self-triggered catalog is constructed from the 32 highest-energy events in the same data sample used for the search, and these source events are then removed before computing test statistics. The paper does not explain how the background-only simulations used for the p-value calibration and discovery potential account for the look-elsewhere effect inherent in choosing the catalog on the same data. Unlike a fixed external catalog, the source locations here are data-dependent; if the simulations do not replicate the catalog-selection step, the reported p-values and the Figure 4b discovery potential may be over-optimistic. Please clarify the simulation procedure for this catalog or add a trials factor for the catalog selection.
minor comments (5)
- [Section 2.2, Eq. 2.5] The text says the likelihood is "minimized" with respect to ns_j and γ_j, but Eq. 2.5 is a product of probabilities and the quoted TS is the standard −2 log-likelihood ratio; please clarify that the quantity minimized is the negative log-likelihood (equivalently, the likelihood is maximized).
- [Section 2.2, Eq. 2.6] The motivation for the ∆Tdata/∆Tj prefactor as a trials correction is stated only briefly. Since the final p-value calibration is performed with background Monte Carlo, this term is not incorrect, but a sentence explaining why this particular functional form is used (rather than, e.g., a factor depending on the number of test windows formed) would help the reader.
- [Section 4, caption of Figure 4] The caption states that "the solid blue line corresponds to the observation of a single, 100 day flare with 13 events," but it is not clear how this line relates to the single-flare analytic limit or to the plotted discovery-potential curves. Please clarify the meaning of this line in the legend or caption.
- [Section 3, Eq. 3.1] The normalization constant Am is described as the "overall power law normalization," but the units of N(I) are not specified; defining N(I) as the expected number of flares per interval dI would make the interpretation of Am and Io clearer.
- [Throughout] There are a few typographical and style issues: "gaussian" should be "Gaussian" in Section 2.2; the stray period after "gaussian" in the same sentence should be removed; and references [4] and [8] are cited as "these proceedings" without page numbers, which is acceptable for ICRC but should be completed in the final version.
Circularity Check
No load-bearing circularity: discovery potential is set by injected Monte Carlo and background simulations, not by fitting the claimed result.
full rationale
The central object, Eq. 2.7, is built from per-window likelihood ratios (Eqs. 2.5-2.6), and its performance is evaluated by Monte Carlo injection: 'We define the 3 sigma discovery potential to be the flare intensity distribution normalization (Am) required for 50% of the injected signal multiflare test statistics to be higher than the 3 sigma threshold calculated from the background multiflare test statistic distribution.' This is a sensitivity estimate, not a fit to the data being claimed, so the multiflare discovery potential is not defined in terms of the comparison result. The injection power law (Eq. 3.1) is explicitly acknowledged as descriptive: 'Note, however, that this is a descriptive power law, not a predictive power law.' The single-flare and time-integrated baselines are analytic/published estimates ('can be calculated analytically by integrating equation 3.1'; 'correspond to the condition that there are not more events in the sample than are allowed by the existing time-integrated flux limits reported in [6]'), so the quantitative comparison is weaker than a head-to-head rerun of the competing algorithms, but this is a benchmarking limitation, not a circular reduction. The self-triggered catalog is data-derived, yet the paper removes the same events from the test statistic: 'These "source" events are removed from the sample prior to calculating a test statistic to avoid signal contamination.' No fitted parameter is renamed as a prediction, and no load-bearing claim depends on a self-citation chain. Minor self-citations ([3], [4]) supply standard likelihood machinery and trial-factor procedure, but the central claim is independently benchmarked by simulation. Score 1 reflects the mild caveat in the comparison baselines, not circularity.
Assumptions & free parameters
free parameters (6)
- alpha =
3 (fixed in Figure 4)
- I_o =
scanned in Figure 4
- A_m =
set by discovery potential threshold
- injected flare duration =
100 days
- injected spectral index =
E^-2
- S/B threshold for window formation =
not specified
assumptions (4)
- domain assumption The background model for events is known and correctly described by detector effective area functions from [3] and [7].
- ad hoc to paper The power-law intensity distribution N(I) in Eq. 3.1 describes the population of neutrino flares.
- ad hoc to paper Flares begin and end on detected events, and a box-shaped temporal profile is adequate.
- domain assumption The greedy decorrelation step in Section 2.3 yields a set of independent flares suitable for summation.
Cite this review
Pith. "Pith review of A Method for an Untriggered, Time-Dependent, Source-Stacking Search for Neutrino Flares." pith.science (2026). https://pith.science/paper/FZWFJRBU
@misc{pith2026190805637,
  author       = {Pith},
  title        = {Pith review of: A Method for an Untriggered, Time-Dependent, Source-Stacking Search for Neutrino Flares},
  year         = {2026},
  howpublished = {\url{https://pith.science/paper/FZWFJRBU}},
  note         = {Machine review of arXiv:1908.05637}
}
read the original abstract
Recent results from IceCube regarding TXS 0506+056 suggest that it may be useful to test the hypothesis of multiple neutrino flares, where each flare is not necessarily accompanied by a corresponding gamma-ray flare. An untriggered, time-dependent, source-stacking search would be optimal for testing this hypothesis, however such an analysis has yet to be applied to the full duration of IceCube data. Here, we discuss one possible way of constructing such an analysis, with a global test statistic obtained by summing the individual test statistics associated with each signal-like flare in the sample. This has the additional advantage of assessing the time structure of each source when running the analysis over a source catalog. We show that, for a signal consisting of many small flares, this style of analysis represents a significant increase in discovery potential over both the existing single-flare fit and the time-integrated stacking methods. Potential source catalogs are examined in combination with this method, including the possibility of a "self-triggered" catalog consisting of the locations of the highest energy northern sky events in the IceCube sample.
Figures


Figures from the paper (1 more)

Reference graph
Works this paper leans on
- [6]
-
[3]
IceCube Collaboration, M. G. Aartsen et al., Science 361 (2018) eaat1378
work page 2018
- [4]
-
[1]
write newline
" write newline "" before.all 'output.state := FUNCTION blank.sep after.quote 'output.state := FUNCTION fin.entry output.state after.quoted.block = 'skip 'add.period if write newline FUNCTION new.block output.state before.all = 'skip output.state after.quote = after.quoted.block 'output.state := after.block 'output.state := if if FUNCTION new.sentence out...
-
[2]
IceCube Collaboration, M. G. Aartsen et al., Science 361 (2018) 147--151
2018
-
[5]
O'Sullivan, PoS(ICRC2019)973 (these proceedings)
IceCube Collaboration, E. O'Sullivan, PoS(ICRC2019)973 (these proceedings)
-
[7]
IceCube Collaboration, M. G. Aartsen et al., ApJ 835 (2017) 45
work page 2017
-
[8]
IceCube Collaboration, M. G. Aartsen et al., ApJ 833 (2016) 3
work page 2016
Show all 9 references
-
[9]
Karl, PoS(ICRC2019)929 (these proceedings)
IceCube Collaboration, M. Karl, PoS(ICRC2019)929 (these proceedings)
Reviewed August 14, 2026 · model on record in the stance chip above.
Discussion (0). Continue with ORCID to comment.