REVIEW 4 major objections 6 minor 14 references
Investigation of HZE particle fluxes as a space radiation hazard for future Mars missions
T0 review · 4 major / 6 minor · reviewed 2026-08-14 · deepseek-v4-flash
Pith's one-line read This paper argues that the Sun's current low-activity spell will persist through solar cycle 25, keeping galactic heavy-ion radiation near peak and elevating the risk for crewed Mars missions.
desk verdict Useful ACE HZE documentation and a plausible qualitative warning, but the multi-cycle low-activity projection rests on visual pattern matching and circular extension, so it needs quantitative support before it can be relied on. read the letter →
The pith
A machine-rendered reading of the paper's core claim, the machinery that carries it, and where it could break.
The reading
What carries the argument
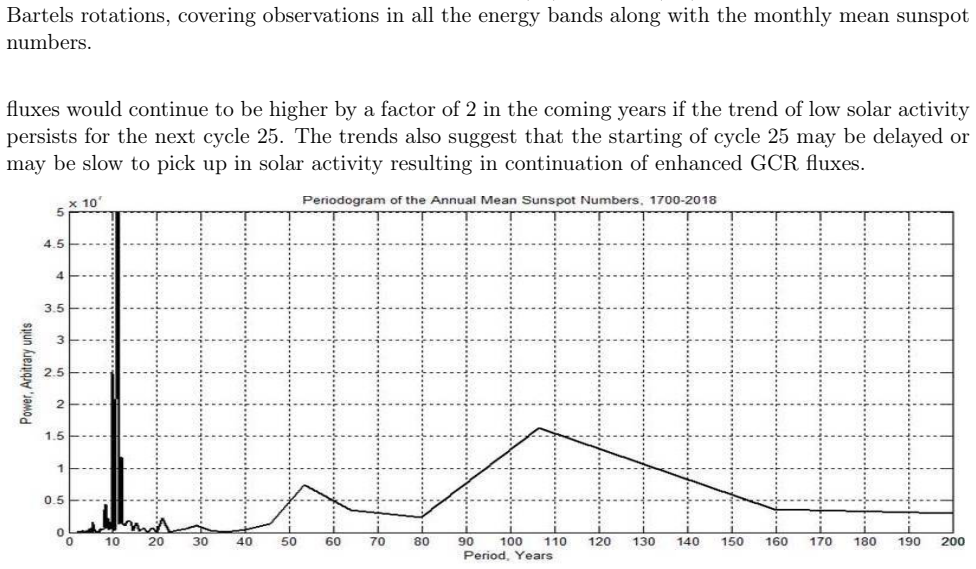
The load-bearing mechanism is the continuous wavelet transform of the yearly sunspot-number series, applied first to observed data (1700-2018) and then to the series extended to 2031 with a hybrid regression neural network forecast. The wavelet coefficient maps resolve the roughly 11-year Schwabe cycle, the 22-year Hale cycle, a 53-year cycle, and the roughly 107-year Gleissberg cycle in time, and they reveal vertical bands of low coefficients across all scales during the quiet epochs around 1800, 1900, and 2000. These quiet bands are what carry the prediction: cycle 24 sits in the third such band, and the forecast keeps it weak. A Fourier power spectrum identifies the dominant periodicities, and spacecraft measurements of heavy-ion fluxes link low sunspot numbers to elevated radiation levels.
What would settle it
Track the observed yearly-mean sunspot numbers through 2031 and the spacecraft-measured GCR/HZE fluxes over the same period. If the smoothed peak of solar cycle 25 climbs above roughly half the normal cycle peak (the amplitude of earlier quiet epochs) or if heavy-ion fluxes begin a sustained decline before the mid-2020s, the paper's prediction of a continuing quiet epoch and sustained high radiation levels is contradicted.
Extended reading notes
Core claim
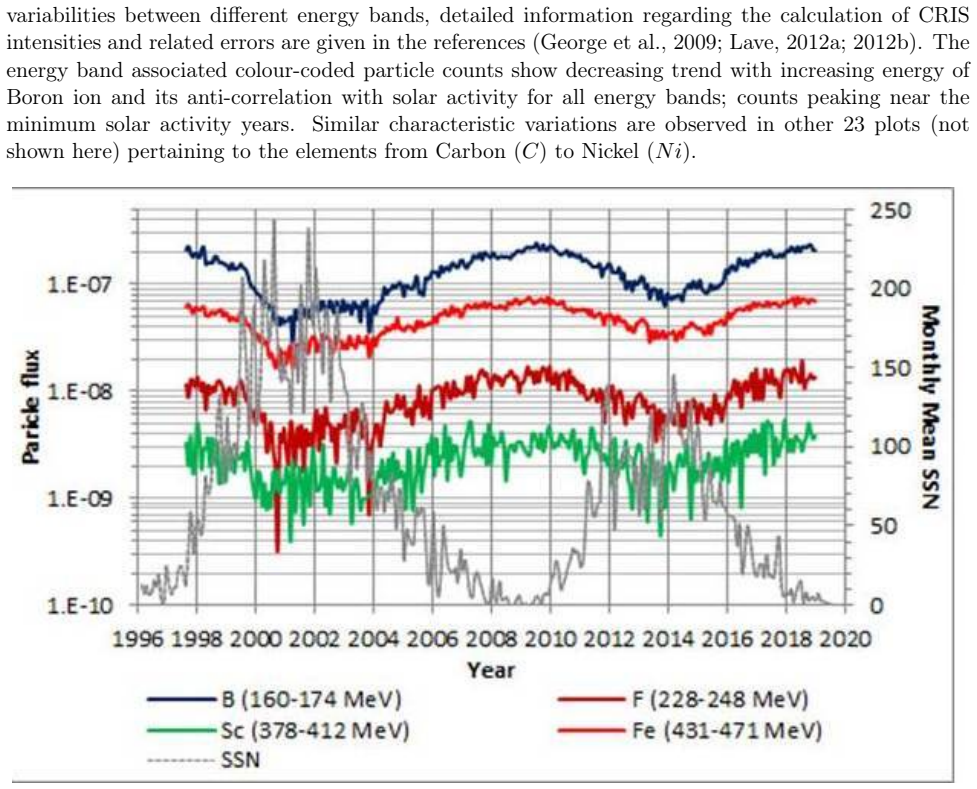
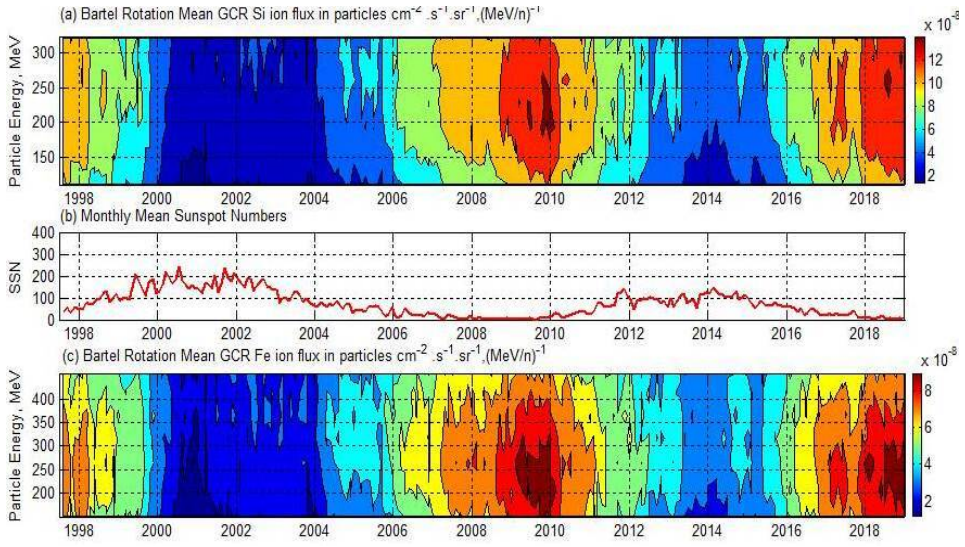
The central claim is that the very low solar activity of cycle 24 is not an isolated anomaly but part of a roughly century-spaced pattern, and that it will likely continue through cycle 25 (about 2019-2031) and possibly through cycle 26 (about 2031-2042), matching quiet epochs seen around 1800 and 1900. The wavelet transform of yearly sunspot numbers from 1700 to 2018 shows three quiet epochs; extending the series with the hybrid regression neural network forecast to 2031 preserves the quiet pattern. Because galactic cosmic-ray and HZE fluxes rise when sunspot numbers fall, with flux peaks lagging sunspot minima by about one year, the paper concludes that near-peak heavy-ion fluxes will persist until about 2032. The estimated enhancement is substantial: HZE fluxes inside a typical spacecraft in interplanetary space could be a factor of about three higher for low-sunspot cycles like 24.
Load-bearing premise
The argument depends on the assumption that the visually identified pattern of quiet epochs repeating roughly every 100 years is real and will continue into the current era, and that the neural-network forecast of a weak cycle 25 is correct; if the quiet spell ends early or cycle 25 is stronger than predicted, the prediction of sustained high HZE fluxes through 2031 has no basis.
Editorial extensions
If this is right
- A crewed Mars mission launched in the 2020s will spend most of its transit in a solar-minimum-like radiation environment, with HZE fluxes near their peak through roughly 2032.
- Cumulative astronaut doses will approach or exceed current career limits unless transit time is shortened or shielding is improved, since aluminum shielding of about 20 grams per square centimeter reduces the dose only slightly.
- Because the heaviest fluxes lag sunspot minimum by about one year, launch and surface-schedule planning should be tied to the predicted cycle timing rather than to the nominal minimum year.
- Robotic Mars missions with adequate shielding remain feasible, but the analysis implies that unshielded astronaut surface operations would need additional protective measures.
Reading between the lines
- If the century-scale pattern holds, cycle 26 (about 2031-2042) would also be weak, extending the high-radiation window beyond 2031 and altering any mission architecture that counts on a stronger solar maximum for shielding.
- The quiet-epoch pattern could be tested statistically by comparing the durations and amplitudes of the three epochs and by checking whether the same epochs appear in other solar activity proxies, such as geomagnetic records or cosmogenic isotope data.
- Coupling the predicted sunspot series to a modern radiation transport model would turn this solar-activity forecast into a concrete dose projection for specific Mars trajectories and surface stay times.
Signed reviews
Editorial analysis
A structured set of objections, weighed in public.
Referee Report
Summary. The paper examines the space radiation environment for future manned Mars missions, focusing on HZE particle fluxes modulated by solar activity. Using FFT and continuous wavelet analysis of yearly mean sunspot numbers (1700–2018), the authors identify ~11-, 22-, 53-, and 107-year periodicities and claim that wavelet spectra show three quiet epochs centered near 1800, 1900, and 2000, each lasting 2–3 solar cycles. They train a Hybrid Regression Neural Network (HRNN, code by Okoh) on the sunspot series to forecast Cycle 25 (2019–2031), append these predictions to the observed series, and re-run the wavelet analysis. From visual inspection of the resulting wavelet map, they conclude that the current low-activity spell will continue through Cycle 25 and possibly Cycle 26, implying elevated GCR/HZE fluxes and high radiation doses for Mars missions in the coming decades. ACE/CRIS data for elements B through Ni are presented to show higher HZE fluxes during Cycle 24 than Cycle 23, attributed to persistently low sunspot numbers, with a claimed one-year lag between sunspot minimum and flux maximum.
Significance. If the central prediction—sustained low solar activity and elevated HZE fluxes through Cycle 25 and perhaps beyond—is correct, the implications for Mars mission design are substantial, as galactic cosmic-ray dose is a known hard-to-shield hazard. The paper brings together long sunspot records, spacecraft observations, and a forecast model in an accessible way, and the observational finding that HZE fluxes were higher in Cycle 24 than Cycle 23 is worth reporting. However, the main predictive claim is not currently supported by quantitative evidence: the wavelet-based recurrence argument rests on visual pattern recognition of a 331-year series without statistical significance testing, the extended-series wavelet map includes the HRNN forecast as input, and the claimed one-year lag is asserted rather than measured. Because these issues affect the core conclusion, the contribution as written falls short of a robust basis for mission-radiation projections, though the shortcomings are addressable with additional analysis rather than being fatal in principle.
major comments (4)
- [§3, Figure 6] The wavelet analysis of the extended series (Figure 6) uses the HRNN-predicted sunspot numbers for 2019–2031 as input to the same continuous wavelet transform that is then cited as evidence of continuing low activity. This is circular: the low wavelet coefficients after 2018 are in large part manufactured by the forecast whose validity the wavelet analysis is supposed to support. The manuscript even notes that 'this cannot be verified fully,' but it still presents the wavelet result as a confirmation. To support the claim, the authors should validate the HRNN forecast against actual observed Cycle 25 data (now available) or, at minimum, treat the forecast as a scenario rather than as independent evidence.
- [§3, Figure 6] The central assertion that 'the very low solar activity period is likely to continue not only up to 2031 but perhaps beyond during at least up to solar cycle 26' is based solely on 'visual pattern recognition' of wavelet coefficient contours. There is no statistical test (e.g., surrogate-data or Monte Carlo significance levels), no quantitative criterion for identifying a quiet epoch, and no comparison of the duration/amplitude of the three alleged quiet epochs with uncertainties. In addition, the post-2018 coefficients in Figure 6 lie at the right edge of the time series, within the cone of influence of the wavelet transform, where values are strongly affected by the boundary condition. The apparent continuation of low coefficients may therefore be an edge artifact. The authors should quantify the recurrence pattern, show robustness to boundary treatment, and provide significance estimates for the low-coefficient regions.
- [§3, Figure 3] The statement that 'there is a lag of at least one year between the SSN minimum and flux maximum' is asserted from visual inspection of the concurrent plot in Figure 3. This lag is load-bearing because the paper later projects high HZE doses up to 2032 by adding one year to the end of Cycle 25. The lag should be quantified, for example by cross-correlating monthly sunspot numbers with the CRIS flux series, and reported with confidence bounds. Without this, the timing of the projected radiation peak is unsupported.
- [§3, Figures 2 and 3] The claim that HZE fluxes in Cycle 24 are 'considerably higher' than in Cycle 23 is presented without any quantitative comparison or uncertainty measures. The plotted time series show an apparent enhancement, but there are no mean fluxes, error bars, or statistical tests for the difference between the two cycle-averaged periods. Given that this enhancement is one of the paper's key observational results and motivates the radiation-hazard concern, it should be quantified (e.g., cycle-averaged flux ratios with propagation of counting uncertainties).
minor comments (6)
- [§2] The text states that GCR data were downloaded for 'the period 1977 to 2019,' but the ACE spacecraft was launched in 1997 and the figures show data beginning in 1997 or 2000. Please correct the reported coverage period.
- [§3] Figure 2 is described as showing flux values 'higher by more than one order of magnitude' for B and Fe compared with F and Sc; since the y-axis is logarithmic, this is plausible, but the statement would benefit from a numerical comparison in the text.
- [§1 and §3] The manuscript refers to approximate dose rates from the OLTARIS website but does not provide a citation for the specific quoted values; please add the appropriate reference or specify the run parameters used.
- [Figure 5] The wavelet color scale is not defined quantitatively in the caption or text; specifying the coefficient normalization and color-bar units would help readers interpret 'low' and 'high' values.
- [§3] Several typographical errors appear, for example 'the Sun is going through a very low 11-year activity phase under solar cycle 24' and 'the starting of cycle 25 may be delayed.' A careful proofreading pass would improve clarity.
- [References] The reference list includes a mix of conference presentations, project reports, and journal articles; some entries cited in the text (e.g., 'Myung et al., 2007' and the OLTARIS dose rates) are not fully referenced, and the Hathaway citation has an incomplete author list.
Circularity Check
The low-activity projection through 2031/2042 rests on wavelet analysis of a series that already includes the HRNN forecast, so the apparent 'continuation' is partly built into the input.
-
fitted input called prediction
[Section 3, Figure 6 paragraph (wavelet analysis of the extended 1700–2031 SSN series)]
"The resultant predictions are added to the observed SSN series data till 2018 and the wavelet analysis is repeated for the entire range 1700-2031 (332-years). ... Hence from visual pattern recognition it is clear that the very low solar activity period is likely to continue not only up to 2031 but perhaps beyond during at least up to solar cycle 26 (≈ 2031-2042), i.e., a spell of 3-solar cycles like the first group."
The extended series analyzed in Figure 6 is constructed by appending HRNN-predicted 2019–2031 SSN values to the observed 1700–2018 series. The low wavelet coefficients after 2018 are therefore a transform of the very forecast whose validity the wavelet analysis is taken to establish. The paper uses the resulting wavelet pattern to conclude that low solar activity continues and even extends to cycle 26; this is not independent confirmation but the model output re-expressed in wavelet coordinates. Because the HRNN is trained on the same historical SSN series, the 'prediction' is fitted input rather than an externally constrained forecast. No out-of-sample test or significance test breaks this dependence.
full rationale
The paper's central prospective claim—that very low solar activity, and therefore enhanced HZE/GCR fluxes, will persist through solar cycle 25 and probably 26—depends on the wavelet pattern of a 1700–2031 SSN series in which the 2019–2031 values are outputs of the publicly available HRNN model trained on the same historical SSN series. The wavelet transform of the extended series is a deterministic function of the appended forecast, so the low-coefficient column after 2018 cannot serve as independent evidence for the forecast; the 'continuation' is substantially the forecast restated in wavelet space. This is the one significant circular step. In contrast, the ACE observations of elevated HZE fluxes during cycle 24, the FFT/wavelet description of the historical Gleissberg-like modulation, and the external Badhwar–O'Neill flux estimates are independent of this circularity, so the paper is not wholly self-referential. No self-citation chain is used. The recurrence claim also lacks a statistical test, but that is a correctness and robustness concern rather than circularity. Overall score 5 reflects a central prediction whose confirmation is partly built into its input.
Assumptions & free parameters
free parameters (2)
- HRNN internal model weights (trained on historical SSN) =
not reported in the paper
- GCR flux lag relative to sunspot minimum =
about 1 year
assumptions (4)
- domain assumption The yearly mean sunspot number series from 1700 to 2018 is a homogeneous and reliable proxy for long-term solar activity.
- domain assumption GCR/HZE flux is anti-correlated with sunspot number, and this relationship persists over the forecast horizon.
- ad hoc to paper Okoh's Hybrid Regression Neural Network, trained on the same SSN series, yields sufficiently accurate Cycle 25 predictions for the wavelet argument.
- ad hoc to paper Century-scale quiet epochs seen in wavelet maps around 1800 and 1900 are a reliable template for the current epoch's duration.
Cite this review
Pith. "Pith review of Investigation of HZE particle fluxes as a space radiation hazard for future Mars missions." pith.science (2026). https://pith.science/paper/GAM267WX
@misc{pith2026190808362,
  author       = {Pith},
  title        = {Pith review of: Investigation of HZE particle fluxes as a space radiation hazard for future Mars missions},
  year         = {2026},
  howpublished = {\url{https://pith.science/paper/GAM267WX}},
  note         = {Machine review of arXiv:1908.08362}
}
read the original abstract
Manned Mars missions planned in the near future of very low solar activity period and hence higher than acceptable radiation doses due mainly to the Galactic Cosmic Rays (GCR), would require special techniques and technological development for maintaining good health of the astronauts. The present study is an attempt to make an assessment and characterise the coming years in terms of solar activity and space radiation environment especially due to the abundance of highly energetic heavy ions (known as HZE charged particles). These HZE particle fluxes constitute a major hazard to the astronauts and also to the critical electronic components of the spacecraft. Recent data on the HZE species (from B to Ni) obtained from ACE spacecraft shows a clear enhancement of the particle fluxes between the solar cycle 23 and solar cycle 24 (between SSN peaks 2002 and 2014) due to the persisting low sunspot numbers of the latter cycle. The peak values of these cosmic ray fluxes occur with a time lag of about a year of the corresponding minimum value of the sunspots of a particular 11-year cycle which is pseudo-periodic in nature. This is demonstrated by the Fourier and Wavelet transform analyses of the long duration (1700-2018) yearly mean sunspot number data. The same time series data is also used to train a Hybrid Regression Neural Network (HRNN) model to generate the predicted yearly mean sunspot numbers for the solar cycle 25 (2019-2031). The wavelet analysis of this new series of annual sunspot numbers including the predictions up to the end of 2031 shows a clear trend of continuation of the low solar activity and hence continuation of very high HZE fluxes prevailing in Solar cycle 24 into the solar cycle 25 and perhaps beyond.
Figures

Figures from the paper (3 more)


Reference graph
Works this paper leans on
-
[1]
Babcock, H.W., The topology of the Sun’s magnetic field and the 22-year cycle, 1961, Astrophys. J., 133(2), 1961, 572-587
work page 1961
-
[2]
Badhwar, G.D., O’Neill, P. M., An improved model of galactic cosmic radiation for space exploration missions, International Journal of Radiation Applications and Instrumentation; Part-D : Nuclear Tracks and Radiation Measurements, 20(3), 1992, 403-410. Bertsch D.L., Fichtel, C.E., Reames, D. V., Relative abundance of iron-group nuclei in solar cosmic rays...
work page 1992
-
[3]
Bhowmik, P., Nandy, D., Prediction of the strength and timing of sunspot cycle 25 reveals decadal- scale space environmental conditions, Nature Communications, 2018, doi: 10.1038/s41467-018- 07690-0. 8 Borggräfe A., Quatmann, M., Nölke, D., Radiation protective structures on the base of a case study for a manned Mars mission, Acta Astronautica, 65, 2009, ...
-
[4]
Chen, J., Chenette, d., Clark, R., Garcia-Munoz, M., Guzik, T. G., Pyle, K. R., Sang, Y., Wefel, J. P., A Model of galactic cosmic rays for use in calculating linear energy transfer spectra, Adv. Space Res., 14(10), 1994, 765-769. Frick P., Galyagin, D., Foyt, D. V., Nesme-Ribes, E., Schatten, K. H., Sokoloff, D., Zakharov, V., Wavelet analysis of solar ac...
work page 1994
-
[5]
George, J. S., LaveK, A., Wiedenbeck, M. E., Binns, W. R., Cummings, A. C., Davis, A. J., de Nolfo, G. A., Hink, P. L., Israel, M. H., Mewaldt, R. A., Scott, L. M., Stone, E. C., von Rosenvinge, T.,Yanasak, N. E., Elemental composition and energy spectra of Galactic Cosmic Rays during cycle 23, Astrophys. J., 698(2), 2009, 1666-1681
work page 2009
-
[6]
Hathaway, D.H., Lisa, A. U., Predicting the amplitude and hemispheric asymmetry of solar cy- cle 25 with surface flux transport, J. Geophys. Res. Space Physics, 121, 10, 2016, 744-753, doi:10.1002/2016JA023190 International Commission On Radiological Protection (ICRP), The Recommendations of the Inter- national Commission on Radiological Protection, 2007, ...
-
[7]
Annals of the ICRP, 42(4), 1–339, 2013 doi: 10.1016/j.icrp.2013.05.004 Kim M.Y., Wilson, J
Petrov, V., Reitz, G., Sato, T., ICRP Publication 123: Assessment of Radiation Exposure of Astronauts in Space. Annals of the ICRP, 42(4), 1–339, 2013 doi: 10.1016/j.icrp.2013.05.004 Kim M.Y., Wilson, J. W., Cucinotta, F. A., A Solar cycle statistical model for the projection of space radiation environment, Adv. Space Res., 37(9), 2006, 1741-1748
-
[8]
Kim, M. H. Y., de Angelis, G., Cucinotta, F. A., Probabilistic assessment of radiation risk for astro- nauts in space missions, Acta Astronautica, 68, 2011, 747–759
work page 2011
Show all 14 references
-
[9]
S., Mertens, C
Tony, C. S., Mertens, C. J., Blatting, S. R., Radiation Shielding Optimisation on Mars, NASA Langley Research Center, Hampton, Virginia, NASA/TP-2013-217985, 2013 O’Neill, P.M., Badhwar-O’Neill galactic cosmic ray model update based on advanced composition explorer (ACE) energ...
2013 doi
-
[10]
I., Seemala, G
Okoh, D. I., Seemala, G. K., Rabiu, A. B., Uwamahoro, J., Habarulema, J. B., Aggarwal, M., A Hybrid Regression-Neural Network (HR-NN) Method for Forecasting the Solar Activity, Space Weather, 16(9), 2018, doi: 10.1029/2018SW001907
2018 doi
-
[11]
A., Elemental and isotopic composition of the galactic cosmic rays, Ann
Simpson, J. A., Elemental and isotopic composition of the galactic cosmic rays, Ann. Rev. Nucl. Part. Sci., 33, 1983, 323–381
1983
-
[12]
C., Blattnig, S
Singleterry, R. C., Blattnig, S. R., Clowdsley, M. S., Qualls, G. D., Sandridge, C. A., Simonsen, L. C., Norbury, J. W., Slaba, T. C., Walker, S. A., Badavi, F. F., Spangler, J. L., Aumann, A. R., Zapp, E. N., Rutledge, R. D., Lee, K. T., Norman, R. B., OLTARIS: On-Line Tool f...
2010
-
[13]
C., Frandsen, A
Stone, E. C., Frandsen, A. M., Mewaldt, R. A., Christian, E. R., Margolies, D., Ormes, J. F., Snow, F., The Advanced Composition Explorer, Space Sci. Rev., 86, 1998, 1-22
1998
-
[14]
Torresani, B., Analyse continue par ondelettes, Inter-editions, Savior Actuels, 1995. 9
1995
Reviewed August 14, 2026 · model on record in the stance chip above.
Discussion (0). Continue with ORCID to comment.