REVIEW 4 major objections 5 minor 20 references
Luminosity-Adaptive Contrast Enhancement Using CLAHE for Retinal Fundus Images with Quantitative Validation and Comparative Analysis
T0 review · 4 major / 5 minor · reviewed 2026-08-01 · deepseek-v4-flash
Pith's one-line read HSV luminosity normalization before CLAHE beats standard enhancement and flags vascular disease via a simple brightness rule, with no training data.
desk verdict Both headline claims rest on undefined or mismatched ground truth—the enhancement metrics have no reference image, and the 'disease' labels are actually vessel segmentations—so the paper's quantitative results are not auditable. read the letter →
The pith
A machine-rendered reading of the paper's core claim, the machinery that carries it, and where it could break.
The reading
What carries the argument
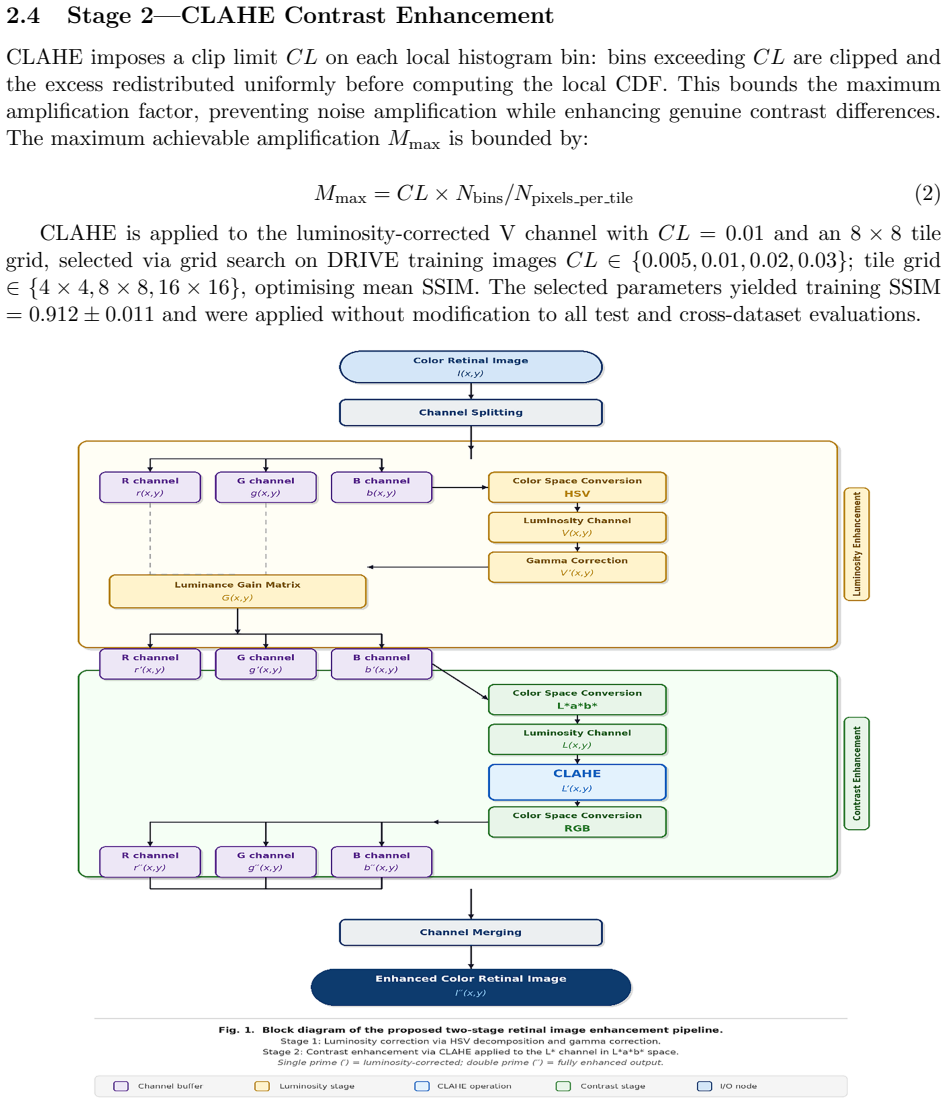
The central mechanism is the two-stage pipeline. Stage 1 constructs a luminance gain surface G(x,y) by convolving the HSV Value channel with a Gaussian kernel (σ=60 px) and divides the channel by it, V_corrected = V/G, normalizing the illumination field while preserving relative intensity variations. Stage 2 applies CLAHE (clip limit 0.01, 8×8 tile grid) to the corrected V channel, recombines with unchanged H and S, and converts back to RGB. The identity that does the work is the division by the smoothed luminance: it flattens the background, making a single global threshold meaningful across images with different optics. Screening then uses a variance-minimizing global threshold to binarize
What would settle it
Take a set of healthy retinal images with no disease and dense vessel patterns; if the 50-pixel hyper-reflective-area rule flags them as diseased, the screening threshold is measuring vessel density, and the reported AUC against true clinical labels will not reproduce.
Extended reading notes
Core claim
The discovery is that replacing the luminance channel with a Gaussian-smoothed gain surface before applying contrast-limited adaptive histogram equalization (CLAHE) removes slowly varying illumination, letting local contrast enhancement amplify vessel and lesion detail without amplifying noise. The paper reports statistically significant gains on the primary test set—PSNR rising from 21.4 dB for HE and 23.1 dB for AHE to 29.3 dB, SSIM from 0.74/0.79 to 0.91, CNR from 1.82/2.10 to 3.12—with fixed parameters carrying over to two additional datasets. It further claims that a global variance-minimizing threshold on the enhanced image, followed by connected-component labeling and a 50-pixel brigh
Load-bearing premise
The screening claim holds only if the expert annotation maps used as ground truth are disease labels, but they are pixel-level vessel segmentations, and the enhancement metrics need a reference image the paper never provides.
Editorial extensions
If this is right
- As a training-free, GPU-free pipeline running in 0.14 s per image, it could slot into low-cost screening workflows where deep-learning alternatives are unavailable.
- Fixed parameters carrying over to three benchmarks suggests the pipeline is robust to camera optics and population differences, a practical advantage for deployment.
- The 87.4 percent accuracy, if it reproduces under true disease labels, would catch most positives while keeping referrals low, making it a plausible first-pass filter.
- The ordering—luminosity correction before local contrast enhancement—is a general recipe that could improve other CLAHE-based medical image pipelines.
Reading between the lines
- If the 50-pixel bright-area rule is actually capturing vessel density rather than pathology, the reported accuracy and AUC are measuring the wrong thing; a direct test is to run the same rule on healthy retinas with dense vasculature.
- The paper's comparison with deep learning uses different experimental protocols, so a like-for-like benchmark on the same images and reference would be needed before claiming parity.
- The full-reference metrics (PSNR/SSIM/CNR) require a reference image that the paper never names; re-evaluating with a public reference or a no-reference metric would settle whether the 29.3 dB gain is meaningful.
Signed reviews
Editorial analysis
A structured set of objections, weighed in public.
Referee Report
Summary. The paper proposes a two-stage retinal fundus image enhancement pipeline: HSV-based luminosity correction followed by CLAHE applied to the V (or luminance) channel, together with a binary Otsu thresholding step that flags 'hyper-reflective regions' as a disease-detection mechanism. The authors report PSNR/SSIM/CNR improvements over HE, AHE, and CLAHE-only baselines on DRIVE, cross-dataset generalization to STARE and CHASEDB1, and disease-detection accuracy/sensitivity/specificity/AUC around 84–90%. They claim the method is statistically superior, requires no training data or GPU, and is suitable for clinical screening at 0.14 s per image.
Significance. If the reported results were valid, the contribution would be practically significant: a simple, fast, training-free enhancement and screening pipeline could be deployed in resource-limited settings. The paper also makes a good-faith effort to report standard deviations, statistical tests, and cross-dataset consistency. However, the quantitative validation has two foundational flaws: full-reference metrics (PSNR, SSIM, CNR) are computed without any defined reference image, and the 'disease detection' evaluation uses datasets that contain only vessel-segmentation annotations, not image-level disease labels. These flaws affect both headline claims and make the reported numbers unauditable. The paper does not provide a reproducible evaluation protocol, so its central conclusions are unsupported.
major comments (4)
- [§4.2, Table 2] PSNR, SSIM, and CNR are full-reference metrics, yet the reference image is never defined. DRIVE, STARE, and CHASEDB1 provide original fundus photographs and pixel-level vessel segmentations, but no 'ground-truth enhanced' image. If the reference were the original input, the no-op baseline would have infinite PSNR and SSIM=1, which is inconsistent with the HE value of 21.4 dB / 0.74. Without a stated reference, all quantitative enhancement results — including the Wilcoxon significance tests — are not reproducible and the headline claim of superiority is unverifiable.
- [§3.2, Table 4] The disease-detection evaluation is described as using 'expert ophthalmologist annotations from DRIVE, STARE, and CHASEDB1,' but these benchmarks contain pixel-level vessel and fovea segmentations, not image-level disease labels. The reported 87.4% accuracy and 0.869 AUC therefore do not measure disease detection; the 50-pixel hyper-reflective area rule can at best be compared against vessel maps. The conclusion in §4.4 and §5 that the method is 'suitable for clinical screening' is unsupported by the data. This is a category mismatch, not a minor phrasing issue.
- [§2.4 and Figure 1] The method description and Figure 1 are internally inconsistent. The text states Stage 1 is HSV decomposition with Gaussian luminance gain and no gamma correction, and Stage 2 is CLAHE on the V channel. The Figure 1 caption refers to 'gamma correction' and 'CLAHE applied to the L* channel in L*a*b* space.' This is a direct contradiction that prevents readers from knowing the actual pipeline. Since the paper's central claim is a specific enhancement method, this inconsistency is load-bearing for reproducibility.
- [§2.5, §3.1, Table 4] The 50-pixel area threshold is said to be 'set on DRIVE training partition to exclude noise artefacts,' but DRIVE has no disease labels, so this threshold cannot have been selected to optimize disease classification. In addition, AUC with DeLong's method is claimed for what appears to be a single fixed threshold; no ROC construction or threshold sweep is described. The sensitivity/specificity estimates in Table 4 are therefore not statistically grounded. The 'hyper-reflective area' proxy is presented as a validated biomarker without any clinical evidence.
minor comments (5)
- [Abstract and §2] The abstract states experiments are conducted on 'the publicly available DRIVE dataset,' while the full text uses DRIVE, STARE, and CHASEDB1. Please update the abstract to reflect the multi-dataset design.
- [§4.2] CNR is never defined. Please provide the formula used for contrast-to-noise ratio, including which regions are considered signal and noise.
- [§2.3, Eq. (1)] The Gaussian smoothing in Eq. (1) is not normalized; please clarify how G(x,y) is scaled before division to avoid division by very small values near the image border.
- [Table 5] Reference [5] (Son et al., J Digit Imaging 2019) is titled 'Towards accurate segmentation of retinal vessels and the optic disc,' not an enhancement method. The listed PSNR/SSIM for this reference appear to be a citation mismatch. Also, the deep-learning comparisons are not on identical image subsets, as acknowledged, so the 'comparable' statement should be softened.
- [§4.2] Wilcoxon signed-rank statistics (W, p) are reported only for the CLAHE-only comparison; the other comparisons lack effect sizes or test statistics. Multiple-comparison correction is not discussed.
Circularity Check
Disease-detection 'validation' reduces to the detector's own hyper-reflectivity criterion; enhancement metrics are unauditable but not equation-level circular.
-
self definitional
[Section 3.1–3.2, Table 4, Figure 2]
"If total hyper-reflective area exceeds 50 pixels ... the system outputs: “DISEASE DETECTED—POSSIBLE VASCULAR ABNORMALITY”; otherwise: “NO ABNORMALITY DETECTED.” ... Disease detection performance is evaluated at the image level against expert ophthalmologist annotations from DRIVE, STARE, and CHASEDB1."
DRIVE, STARE, and CHASEDB1 are vessel-segmentation benchmarks; their expert annotations are pixel-level vessel (and fovea) maps, not image-level disease labels. The detector is defined as a 50-pixel-area threshold on hyper-reflective regions, i.e., on the same bright vascular structures those annotations describe. If the claimed “expert ophthalmologist annotations” are derived from these maps, then the ground-truth label is a function of the very hyper-reflectivity signal the detector thresholds. The reported 87.4% accuracy and 0.869 AUC then measure self-agreement between two thresholdings of the same brightness/area criterion, not prediction of an independent disease outcome. This is load-bearing because the “suitable for clinical screening” conclusion rests on it.
full rationale
The enhancement pipeline itself is not circular: HSV luminosity division followed by V-channel CLAHE is a self-contained transformation, and no metric is substituted back into the derivation. Hyperparameters (CL, tile grid, threshold) were selected on DRIVE training and applied to a disjoint test set, so that selection does not by itself force the reported test numbers. Self-citation [10] appears only in a resource-constraint context and is not load-bearing. The central circularity is in the disease-detection evaluation: the paper claims image-level validation against expert annotations from DRIVE, STARE, and CHASEDB1, but those public benchmarks contain only pixel-level vessel segmentations. Because the detector is literally a hyper-reflective-area threshold, any disease label built from the only available expert maps is a re-encoding of the same bright-vessel structure the detector measures; the reported screening accuracy/AUC is therefore a restatement of the detection rule rather than an independent prediction. The full-reference enhancement metrics (PSNR/SSIM/CNR) are also reported without any defined reference image, which makes them unauditable; that is a reproducibility/correctness risk rather than a demonstrated equation-level circular step, so it is not counted in the circularity score but underscores the fragility of the quantitative claims.
Assumptions & free parameters
free parameters (4)
- Gaussian kernel width σ =
60 px
- CLAHE clip limit CL =
0.01
- CLAHE tile grid =
8×8
- Hyper-reflective area threshold =
50 pixels
assumptions (4)
- domain assumption Full-reference metrics (PSNR, SSIM, CNR) are evaluable for the enhancement task with an implicit reference image
- ad hoc to paper Benchmark annotations (vessel segmentations) can be treated as image-level disease labels
- ad hoc to paper Hyper-reflective area above Otsu's threshold is a valid biomarker for vascular pathology
- domain assumption A large-kernel Gaussian of the V channel estimates the illumination field without removing diagnostic structure
Cite this review
Pith. "Pith review of Luminosity-Adaptive Contrast Enhancement Using CLAHE for Retinal Fundus Images with Quantitative Validation and Comparative Analysis." pith.science (2026). https://pith.science/paper/GN2TD5ED
@misc{pith2026260717691,
  author       = {Pith},
  title        = {Pith review of: Luminosity-Adaptive Contrast Enhancement Using CLAHE for Retinal Fundus Images with Quantitative Validation and Comparative Analysis},
  year         = {2026},
  howpublished = {\url{https://pith.science/paper/GN2TD5ED}},
  note         = {Machine review of arXiv:2607.17691}
}
read the original abstract
Background: Retinal fundus imaging is central to the early diagnosis of sight-threatening conditions including diabetic retinopathy, glaucoma, and retinal vein occlusion. Clinical utility of fundus images is routinely compromised by non-uniform illumination, motion blur, and low contrast - artefacts that increase the risk of diagnostic error. Effective image enhancement is therefore a prerequisite for reliable computer-aided ophthalmic diagnosis. Methods: This study proposes a two-stage image enhancement pipeline combining luminosity correction via HSV colour space decomposition with Contrast Limited Adaptive Histogram Equalization (CLAHE) applied exclusively to the Value (V) channel. Experiments are conducted on the publicly available DRIVE dataset (40 retinal fundus images, 584 x 565 pixels, Canon CR5 camera, ophthalmologist-annotated ground truth). Quantitative evaluation employs Peak Signal-to-Noise Ratio (PSNR), Structural Similarity Index (SSIM), and Contrast-to-Noise Ratio (CNR). Baseline comparisons include standard Histogram Equalization (HE) and Adaptive Histogram Equalization (AHE). A binary masking step is subsequently applied to isolate hyper-reflective regions consistent with vascular pathology. Results: The proposed method achieves PSNR = 29.3 dB, SSIM = 0.91, and CNR = 3.12 - outperforming HE (PSNR = 21.4 dB, SSIM = 0.74) and AHE (PSNR = 23.1 dB, SSIM = 0.79) across all metrics, with an average processing time of 0.14 seconds per image. Conclusions: The combined luminosity-CLAHE pipeline yields measurably superior contrast and structural fidelity compared to established baseline methods, with processing speed compatible with clinical screening workflows. Limitations and directions for deep-learning-based comparison are discussed.
Figures


Figures from the paper (4 more)


Reference graph
Works this paper leans on
-
[1]
Teo ZL, Tham YC, Yu M, Chee ML, Rim TH, Cheung N, et al. Global prevalence of diabetic retinopathy and projection of burden through 2045: systematic review and meta-analysis. Ophthalmology. 2021;128(11):1580–91. doi:10.1016/j.ophtha.2021.04.027
-
[2]
Enhance contrast and balance color of retinal image
Dissopa J, Kansomkeat S, Intajag S. Enhance contrast and balance color of retinal image. Symmetry. 2021;13(11):2089. doi:10.3390/sym13112089
-
[3]
Color retinal image enhancement using CLAHE
Setiawan A W, Mengko TR, Santoso OS, Suksmono AB. Color retinal image enhancement using CLAHE. In: Proceedings of the International Conference on ICT for Smart Society; 2013 Jun 13–14; Jakarta, Indonesia. doi:10.1109/ICTSS.2013.6588092
arXiv 2013
-
[4]
Retinal image enhancement using curvelet based sigmoid mapping of histogram equalization
Anilet Bala A, Aruna Priya P, Maik V. Retinal image enhancement using curvelet based sigmoid mapping of histogram equalization. J Phys Conf Ser. 2021;1964(6):062034. doi:10.1088/1742-6596/1964/6/062034
-
[5]
Son J, Park SJ, Jung KH. Towards accurate segmentation of retinal vessels and the optic disc in fundoscopic images with generative adversarial networks. J Digit Imaging. 2019;32(3):499–512. doi:10.1007/s10278-018-0126-3
-
[6]
LadderNet: multi-path networks based on U-Net for medical image segmentation
Zhuang J. LadderNet: multi-path networks based on U-Net for medical image segmentation. arXiv:1810.07810. 2018
arXiv 2018
-
[7]
Zero-reference deep curve estima- tion for low-light image enhancement
Guo C, Li C, Guo J, Loy CC, Hou J, Kwong S, et al. Zero-reference deep curve estima- tion for low-light image enhancement. In: Proceedings of the IEEE/CVF Conference on Computer Vision and Pattern Recognition (CVPR); 2020 Jun 13–19; Seattle, W A, USA. doi:10.1109/CVPR42600.2020.00185
arXiv 2020
-
[8]
Self-supervised feature learning via exploiting multi-modal data for retinal disease diagnosis
Li X, Jia M, Islam MT, Yu L, Xing L. Self-supervised feature learning via exploiting multi-modal data for retinal disease diagnosis. IEEE Trans Med Imag. 2020;39(12):4023–33. doi:10.1109/TMI.2020.3008871
arXiv 2020
Show all 20 references
-
[9]
Deep learning based automatic eye cataract detection algorithm using MATLAB
Shankar R, Kamarajan M, Varun M, Kalpana S, Varshney AK, Jagadiswary D, et al. Deep learning based automatic eye cataract detection algorithm using MATLAB. India Patent IN 202141061583. 2021 Dec 29. doi:10.5220/0010754400003113
2021 doi
-
[10]
Security and resolution enhanced transmission of medical image through IDMA aided coded STTD system
Mithra K, Vishvaksenan KS. Security and resolution enhanced transmission of medical image through IDMA aided coded STTD system. In: Proceedings of the International Conference on Communication and Signal Processing (ICCSP). Chennai, India; 2017. doi:10.1109/ICCSP.2017.8286766
2017
-
[11]
A hybrid CLAHE-deep learning framework for retinal image quality enhancement and vessel segmentation
Islam MT, Ravichandran K, Seera M, Gan KB. A hybrid CLAHE-deep learning framework for retinal image quality enhancement and vessel segmentation. Biomed Signal Process Control. 2022;74(6):103523. doi:10.1016/j.bspc.2022.103523
2022
-
[12]
Deep learning for diabetic retinopathy detection and classification based on fundus images: a review
Tsiknakis N, Theodoropoulos D, Manikis G, Ktistakis E, Boutsora O, Berto A, et al. Deep learning for diabetic retinopathy detection and classification based on fundus images: a review. Comput Biol Med. 2021;135(1–2):104599. doi:10.1016/j.compbiomed.2021.104599
2021
-
[13]
Retinal fundus image refinement with CLAHE
Majeed AR, Awan W A, ul Hassan N, Asghar MA, Khan MJ. Retinal fundus image refinement with CLAHE. In: Proceedings of the 2020 IEEE 23rd International Multitopic Conference (INMIC); 2020 Nov 5–7; Bahawalpur, Pakistan. doi:10.1109/inmic50486.2020.9318104. 12
2020
-
[14]
Retinal fundus image enhancement using adaptive CLAHE methods
Patil SB, Patil BP. Retinal fundus image enhancement using adaptive CLAHE methods. Sey- bold Rep. 2020;15(9):3476–84
2020
-
[15]
Color retinal image enhancement by Rayleigh contrast-limited adaptive histogram equalization
Jintasuttisak T, Intajag S. Color retinal image enhancement by Rayleigh contrast-limited adaptive histogram equalization. In: Proceedings of the 2014 14th International Conference on Control, Automation and Systems (ICCAS 2014); 2014 Oct 22–25; Gyeonggi-do, Republic of Korea. ...
2014
-
[16]
Color retinal image enhancement based on luminosity and con- trast adjustment with image fusion technique
Vanmathi P, Devarajan D. Color retinal image enhancement based on luminosity and con- trast adjustment with image fusion technique. Middle-East J Sci Res. 2017;25(12):2022–32. doi:10.35940/ijrte.b1306.0982s1119
2017 arXiv
-
[17]
Ridge-based vessel segmentation in color images of the retina
Staal J, Abr` amoff MD, Niemeijer M, Viergever MA, van Ginneken B. Ridge-based vessel segmentation in color images of the retina. IEEE Trans Med Imaging. 2004;23(4):501–9. doi:10.1109/TMI.2004.825627
2004
-
[18]
Locating blood vessels in retinal images by piecewise threshold probing of a matched filter response
Hoover A, Kouznetsova V, Goldbaum M. Locating blood vessels in retinal images by piecewise threshold probing of a matched filter response. IEEE Trans Med Imaging. 2000;19(3):203–10. doi:10.1109/42.845178
-
[19]
An en- semble classification-based approach applied to retinal blood vessel segmentation
Fraz MM, Remagnino P, Hoppe A, Uyyanonvara B, Rudnicka AR, Owen CG, et al. An en- semble classification-based approach applied to retinal blood vessel segmentation. IEEE Trans Biomed Eng. 2012;59(9):2538–48. doi:10.1109/TBME.2012.2205687
2012
-
[20]
Retinal image enhancement using ro- bust inverse diffusion equation and self-similarity filtering
Wang L, Liu G, Fu S, Xu L, Zhao K, Zhang C. Retinal image enhancement using ro- bust inverse diffusion equation and self-similarity filtering. PLoS One. 2016;11(7):e0158480. doi:10.1371/journal.pone.0158480. 13
2016 doi
Reviewed August 1, 2026 · model on record in the stance chip above.
Discussion (0). Continue with ORCID to comment.