Star-formation variability on the star-forming main sequence during the Epoch of Reionization
Pith reviewed 2026-06-27 12:54 UTC · model grok-4.3
The pith
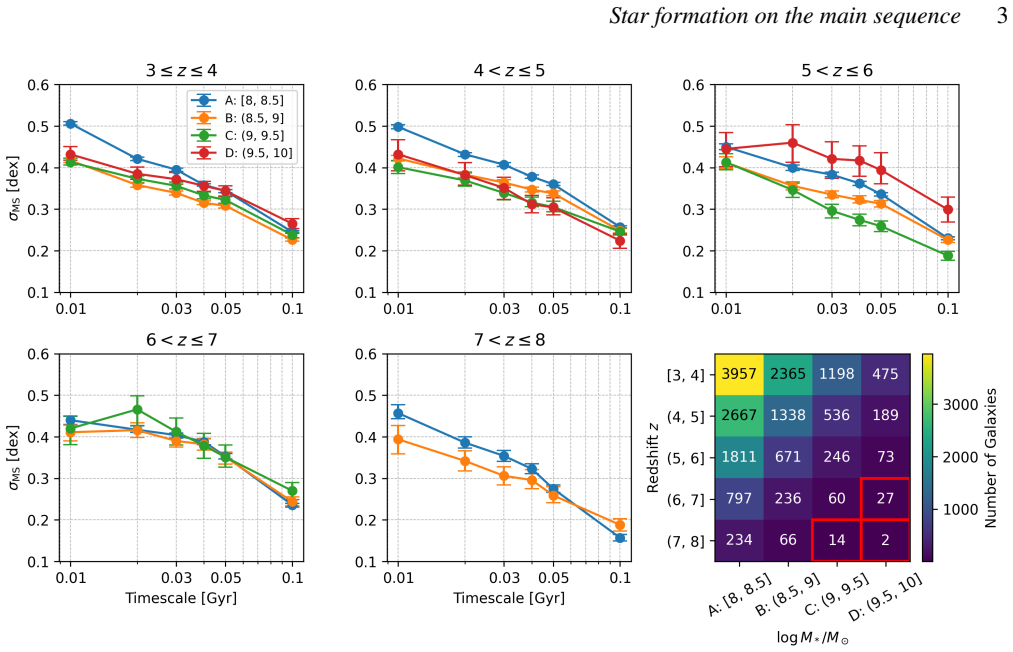
The scatter in high-redshift star-forming main sequence galaxies is set by variability on 10-30 million year timescales.
A machine-rendered reading of the paper's core claim, the machinery that carries it, and where it could break.
Core claim
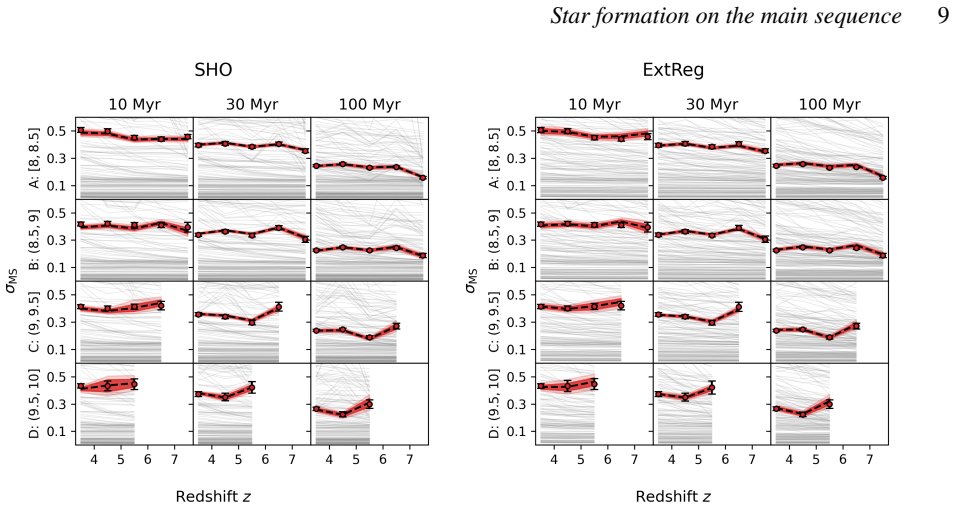
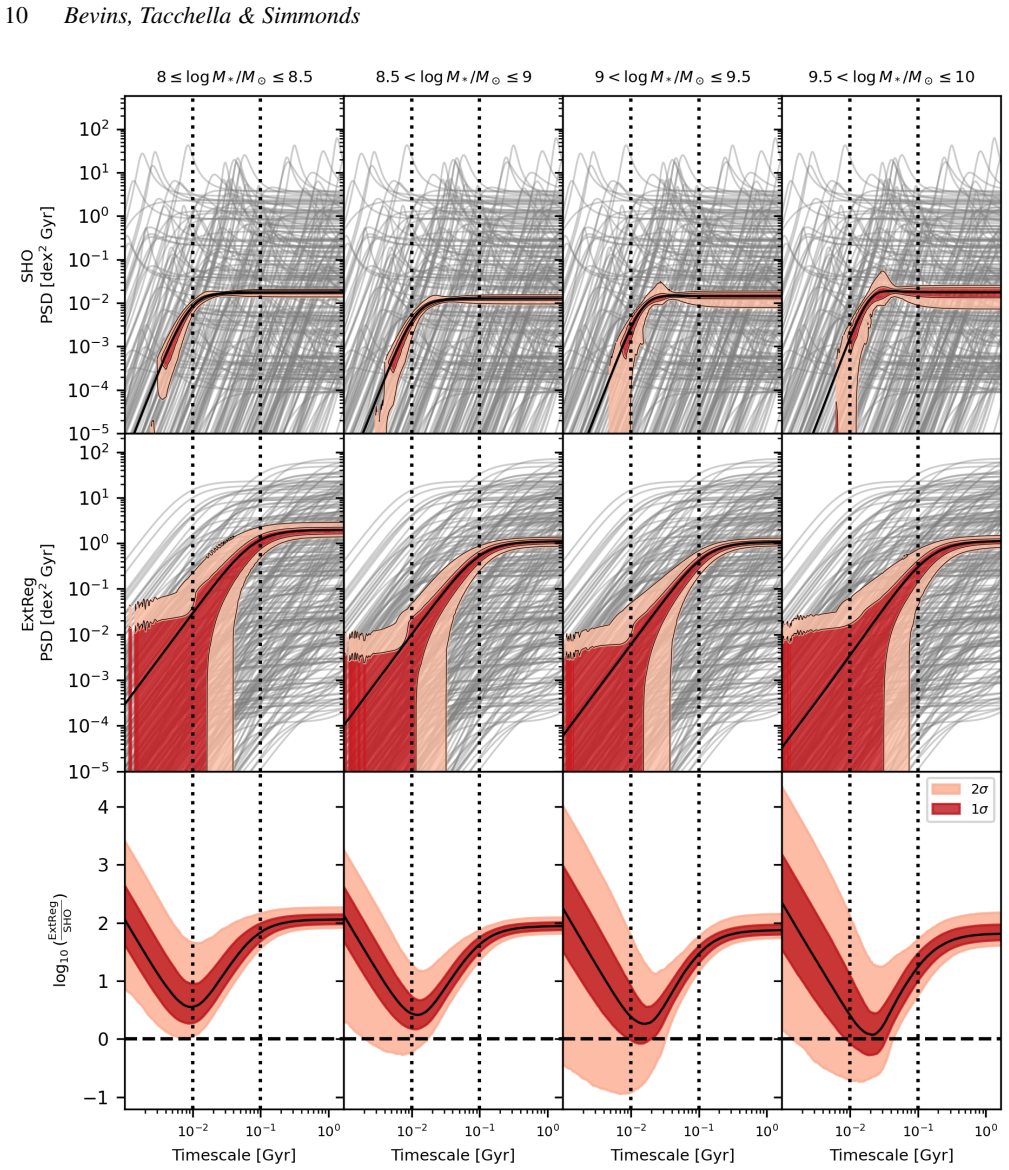
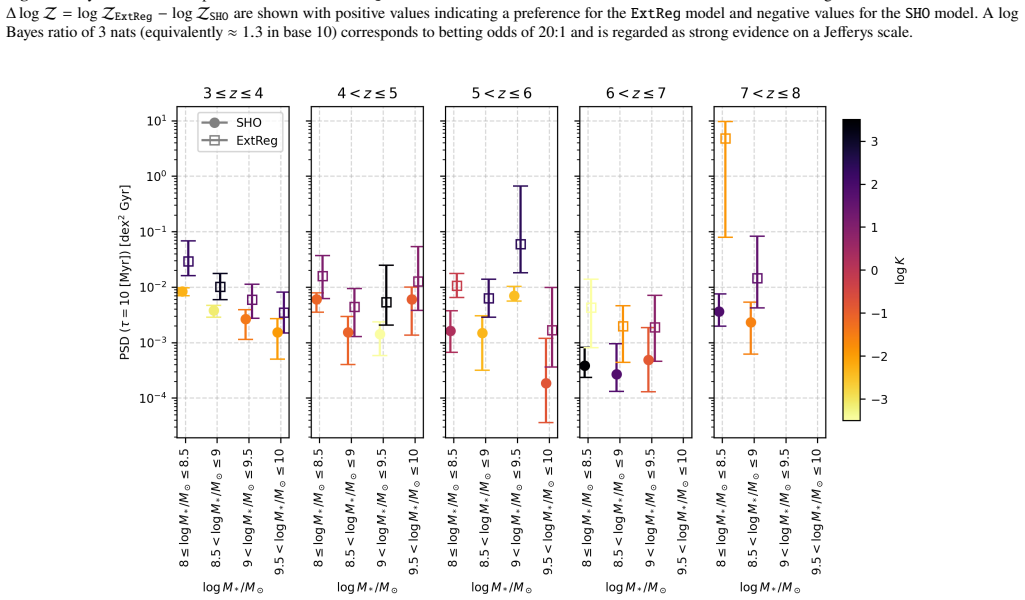
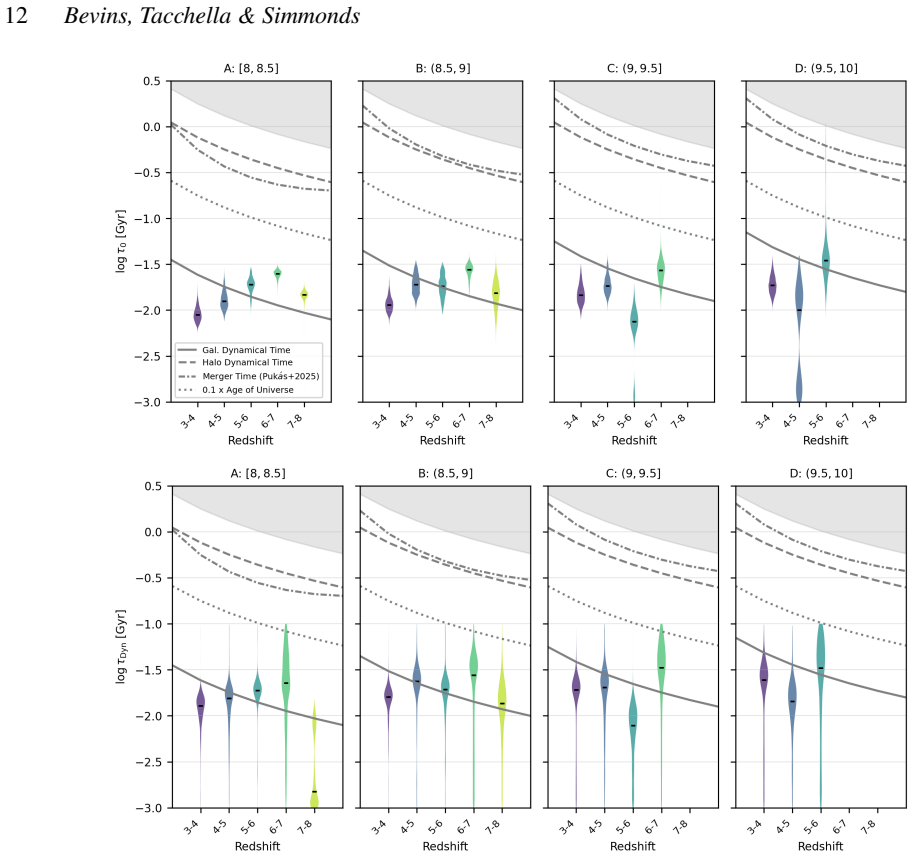
Using estimates of intrinsic scatter in main-sequence star-formation rates at six averaging timescales from a catalogue of roughly 17000 galaxies at z=3-8, both the single-component Simple Harmonic Oscillator model and the dynamical component of the Extended Regulator model are constrained to characteristic variability timescales of approximately 10-30 Myr. These timescales match expected galactic dynamical and stellar feedback times, showing that the observed 10-100 Myr scatter is governed primarily by short-timescale variability. At least in the SHO model the power on 10 Myr timescales decreases with stellar mass, and there is weak evidence in the lowest-mass bin for a shift from a two-com
What carries the argument
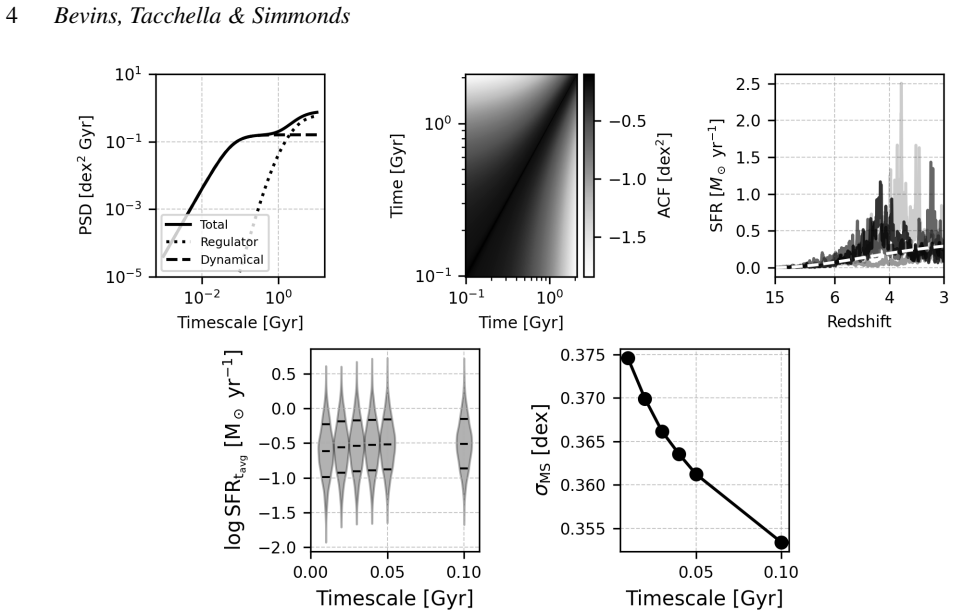
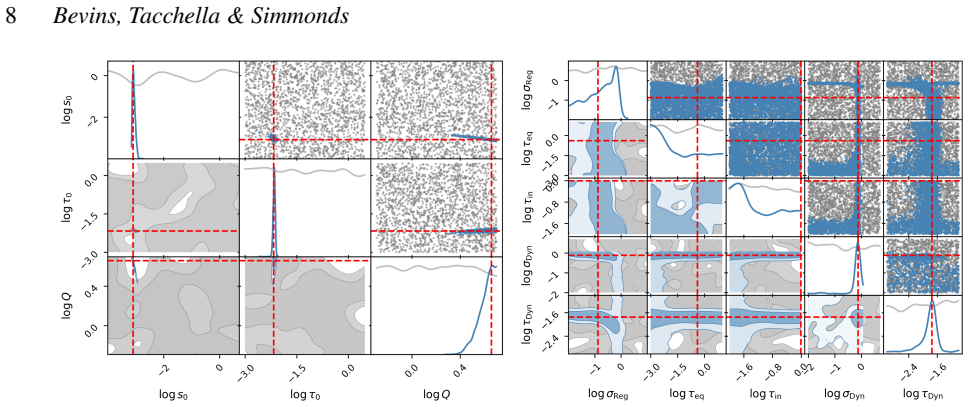
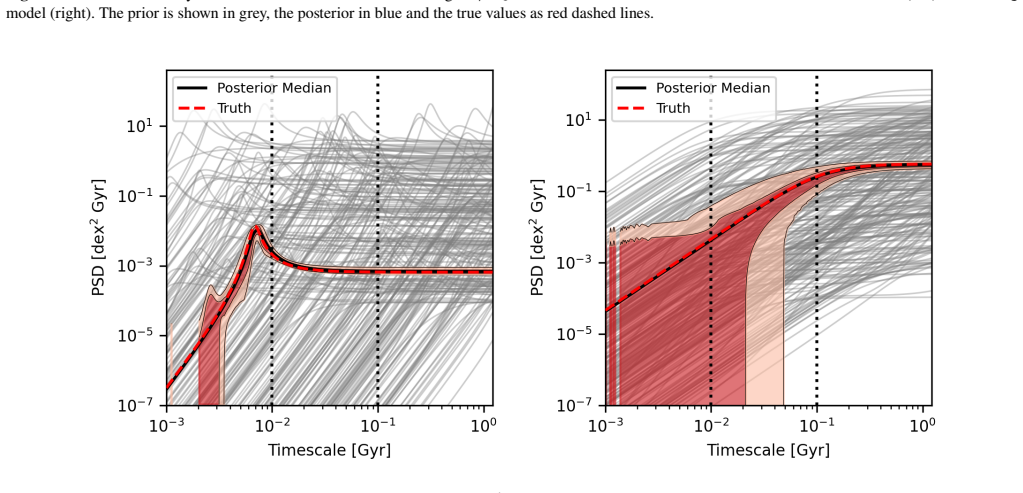
Power spectral density (PSD) models of star-formation rate fluctuations, specifically the Simple Harmonic Oscillator (SHO) model and the dynamical component of the Extended Regulator (ExtReg) model, fitted via nested sampling to scatter measurements at multiple averaging timescales.
If this is right
- The regulator component of the ExtReg model remains poorly constrained by current data.
- In the SHO model, power on approximately 10 Myr timescales decreases with increasing stellar mass, implying more rapid variability in lower-mass galaxies.
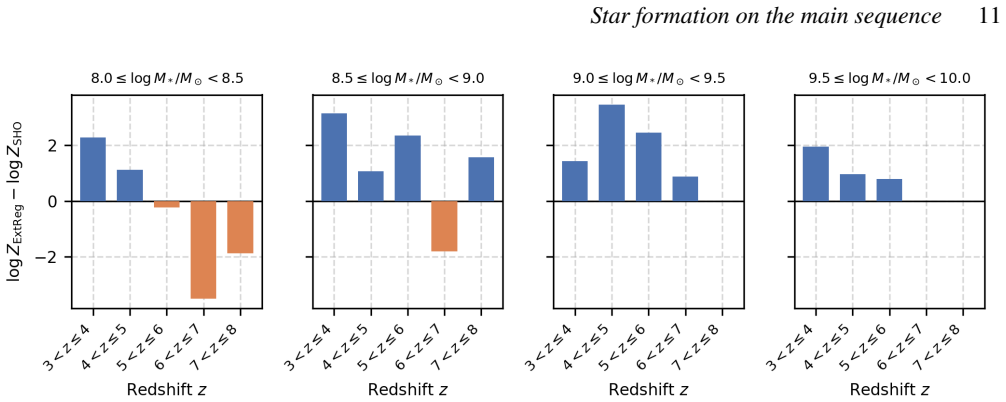
- There is only weak evidence for a transition from a two-component ExtReg-like PSD to a single-component SHO-like PSD at higher redshift in the lowest stellar-mass bin.
- The observed scatter on 10-100 Myr scales is explained primarily by variability on galactic dynamical timescales.
Where Pith is reading between the lines
- Galaxy formation simulations would need to resolve orbital and feedback timescales to reproduce the measured scatter rather than assuming smoother, longer-term accretion.
- Lower-mass galaxies would contribute more bursty ionizing output during reionization if the mass dependence of variability holds.
- Repeating the same PSD analysis on lower-redshift samples with comparable scatter measurements could test whether the dominance of short-timescale variability evolves with cosmic time.
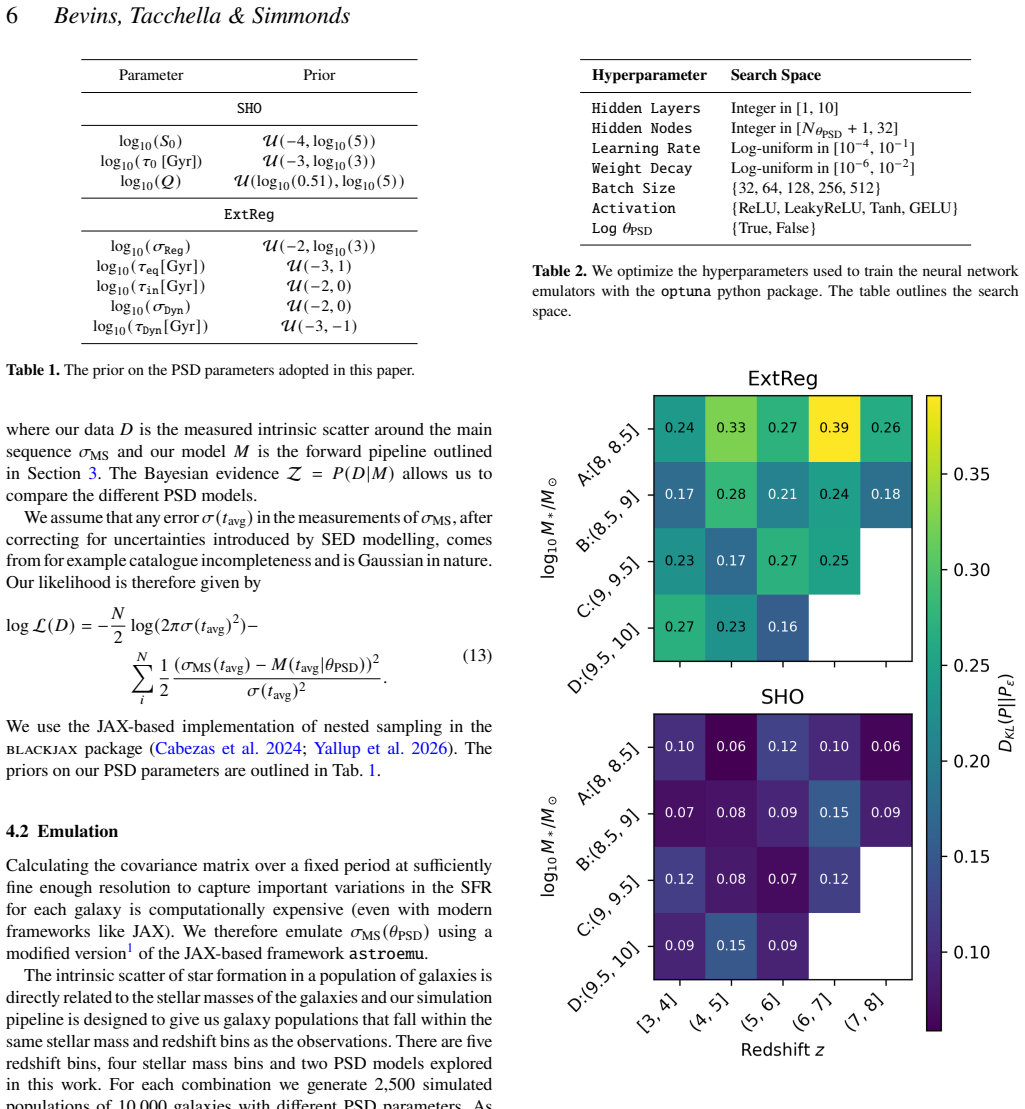
Load-bearing premise
The estimates of intrinsic scatter in main-sequence star-formation rates at six averaging timescales from the Simmonds et al. 2025 catalogue accurately reflect variability without major biases from selection effects, measurement errors, or other contaminants.
What would settle it
A measurement of scatter that stays flat or rises when star-formation rates are averaged over timescales shorter than 10 Myr would show that short-timescale variability does not dominate the observed scatter.
Figures
read the original abstract
Star formation in galaxies is intrinsically stochastic, driven by physical processes operating across a wide range of scales. The scatter in the star-forming main sequence relation provides a window into this variability, but interpreting this scatter in terms of underlying physical mechanisms remains challenging. We present a study of star-formation variability during reionization (redshift z=3-8) using power spectral density (PSD) models to characterize fluctuations in star formation rates (SFRs). We use estimates of the intrinsic scatter in main sequence SFRs at six averaging timescales (10-100 Myr) from a catalogue of ~17000 galaxies presented in Simmonds et al. 2025 to constrain two PSD models, the Simple Harmonic Oscillator (SHO) and the Extended Regulator (ExtReg), with nested sampling and neural network emulators. We find that the regulator component of the ExtReg model is poorly constrained by the present data. However, both the dynamical component of the ExtReg model and the single-component SHO model favour characteristic variability timescales of ~10-30 Myr, comparable to expected galactic dynamical and stellar feedback timescales. At least in the SHO model, and most clearly at z~3-4, the inferred PSD power on ~10 Myr timescales decreases with stellar mass, indicating more bursty, rapidly varying star formation in lower-mass galaxies than in higher-mass systems. We find weak evidence for a transition from a two-component ExtReg-like PSD at lower redshift to a single-component SHO-like PSD at higher redshift in the lowest stellar-mass bin, log M*/M$\odot$ = 8-8.5, although the Bayes factors are small and selection effects at high redshift prevent strong conclusions. Overall, our results suggest that the observed 10-100 Myr scatter of the high-redshift star-forming main sequence is governed primarily by short-timescale variability, consistent with galactic dynamical timescales.
Editorial analysis
A structured set of objections, weighed in public.
Referee Report
Summary. The manuscript analyzes star-formation variability during the Epoch of Reionization (z=3-8) by fitting Simple Harmonic Oscillator (SHO) and Extended Regulator (ExtReg) power spectral density models to estimates of intrinsic scatter in the star-forming main sequence at six averaging timescales (10-100 Myr) drawn from the Simmonds et al. 2025 catalogue of approximately 17,000 galaxies. Using nested sampling and neural network emulators, the authors constrain the models and infer that characteristic variability timescales are 10-30 Myr, consistent with galactic dynamical timescales. They report mass-dependent behavior in the SHO model and weak evidence for a transition in PSD form with redshift in the lowest mass bin, while noting that the regulator component in ExtReg is poorly constrained and that selection effects limit conclusions at high redshift.
Significance. If the scatter estimates accurately reflect intrinsic variability, this work offers important constraints on the stochasticity of star formation at high redshift, suggesting that short-timescale processes dominate the observed scatter on 10-100 Myr scales. The application of PSD modeling with efficient emulators represents a useful methodological approach for interpreting main-sequence scatter in terms of physical timescales. The explicit use of nested sampling and neural network emulators for model fitting is a methodological strength.
major comments (3)
- [Methods (data input from Simmonds et al. 2025)] Methods section (description of scatter inputs from Simmonds et al. 2025): The six scatter values at 10-100 Myr averaging timescales are adopted directly without a reported dedicated quantification of biases from selection effects, measurement errors, or dust systematics, although the text acknowledges that selection effects at high redshift limit conclusions. Since these values are the sole observational inputs constraining the PSD parameters and the inferred 10-30 Myr timescales, an explicit test (e.g., via mock catalogues or error budget decomposition) is needed to confirm they trace intrinsic SFR fluctuations rather than contaminants.
- [Results (ExtReg model constraints)] Results section (ExtReg model): The regulator component of the ExtReg model is stated to be poorly constrained by the present data, yet the headline claim that variability is governed primarily by short-timescale dynamical processes relies on the dynamical component; additional analysis showing the robustness of the 10-30 Myr inference when marginalizing over the unconstrained regulator parameter would strengthen the central interpretation.
- [Discussion (redshift evolution)] Discussion section (redshift evolution claim): The reported weak evidence for a transition from a two-component ExtReg-like PSD at lower redshift to a single-component SHO-like PSD at higher redshift in the log M*/M⊙ = 8-8.5 bin rests on small Bayes factors; given the acknowledged selection effects at high z, a quantitative assessment of how those effects could produce or mask such a transition is required before the claim can be considered load-bearing.
minor comments (2)
- [Abstract] The abstract states '~17000 galaxies' but the full text uses 'approximately 17,000'; consistent phrasing would improve precision.
- [Methods] Notation for the dynamical versus regulator components in the ExtReg model would benefit from an explicit equation reference when first introduced in the methods to aid reader clarity.
Simulated Author's Rebuttal
We thank the referee for their constructive review and for highlighting the methodological strengths of the work. We address each major comment below and have revised the manuscript to incorporate additional analysis and discussion where feasible.
read point-by-point responses
-
Referee: Methods section (description of scatter inputs from Simmonds et al. 2025): The six scatter values at 10-100 Myr averaging timescales are adopted directly without a reported dedicated quantification of biases from selection effects, measurement errors, or dust systematics, although the text acknowledges that selection effects at high redshift limit conclusions. Since these values are the sole observational inputs constraining the PSD parameters and the inferred 10-30 Myr timescales, an explicit test (e.g., via mock catalogues or error budget decomposition) is needed to confirm they trace intrinsic SFR fluctuations rather than contaminants.
Authors: We agree an explicit error budget would strengthen the presentation. Simmonds et al. (2025) already quantifies several of these systematics; we have added a new subsection in Methods that decomposes the reported scatter uncertainties into measurement, dust, and selection contributions based on that work. A full mock-catalogue test is not possible without the underlying simulation data, but the expanded discussion now makes the limitations more quantitative. revision: partial
-
Referee: Results section (ExtReg model): The regulator component of the ExtReg model is stated to be poorly constrained by the present data, yet the headline claim that variability is governed primarily by short-timescale dynamical processes relies on the dynamical component; additional analysis showing the robustness of the 10-30 Myr inference when marginalizing over the unconstrained regulator parameter would strengthen the central interpretation.
Authors: We have performed the requested robustness test by drawing the regulator parameter from a broad prior, re-running the nested sampling, and confirming that the dynamical timescale posterior remains peaked between 10-30 Myr with only modest broadening. The new results are shown in an updated figure and text in the revised Results section. revision: yes
-
Referee: Discussion section (redshift evolution claim): The reported weak evidence for a transition from a two-component ExtReg-like PSD at lower redshift to a single-component SHO-like PSD at higher redshift in the log M*/M⊙ = 8-8.5 bin rests on small Bayes factors; given the acknowledged selection effects at high z, a quantitative assessment of how those effects could produce or mask such a transition is required before the claim can be considered load-bearing.
Authors: We have added a quantitative estimate in the Discussion using a simplified incompleteness model that increases with redshift for the lowest-mass bin. This shows that selection can modestly enhance the apparent trend in Bayes factors but is unlikely to create it entirely. We have also toned down the language to stress that the evidence remains weak. A full end-to-end selection simulation on the PSD inference is beyond current scope. revision: partial
- A complete mock-catalogue validation of the input scatter values and of the redshift-evolution claim would require the full simulation outputs and selection functions from Simmonds et al. (2025), which are not available to us.
Circularity Check
No significant circularity; derivation uses independent scatter inputs to fit PSD parameters
full rationale
The paper takes six scatter values at 10-100 Myr averaging timescales from the Simmonds et al. 2025 galaxy catalogue as fixed inputs, then fits SHO and ExtReg PSD models via nested sampling to extract characteristic timescales. This is a standard parameter inference step with no reduction by construction: the output timescales are not equivalent to the input scatters, nor are they a renamed fit. The Simmonds citation supplies processed observational data rather than a self-cited theorem or ansatz that justifies the central claim. No self-definitional equations, fitted-input predictions, or uniqueness imports appear in the derivation chain. The result remains falsifiable against external data and is therefore scored 0.
Axiom & Free-Parameter Ledger
free parameters (1)
- SHO and ExtReg model parameters
axioms (1)
- domain assumption Scatter in SFRs at different averaging timescales reflects intrinsic star-formation variability driven by physical processes on galactic dynamical and feedback timescales.
Reference graph
Works this paper leans on
-
[1]
A Universal, Local Star Formation Law in Galactic Clouds, nearby Galaxies, High-redshift Disks, and Starbursts. , keywords =. doi:10.1088/0004-637X/745/1/69 , archivePrefix =. 1109.4150 , primaryClass =
work page internal anchor Pith review Pith/arXiv arXiv doi:10.1088/0004-637x/745/1/69
-
[2]
Fast and inefficient star formation due to short-lived molecular clouds and rapid feedback
Fast and inefficient star formation due to short-lived molecular clouds and rapid feedback. , keywords =. doi:10.1038/s41586-019-1194-3 , archivePrefix =. 1905.08801 , primaryClass =
work page internal anchor Pith review Pith/arXiv arXiv doi:10.1038/s41586-019-1194-3 1905
-
[3]
Cold streams in early massive hot haloes as the main mode of galaxy formation. , keywords =. doi:10.1038/nature07648 , archivePrefix =. 0808.0553 , primaryClass =
work page internal anchor Pith review Pith/arXiv arXiv doi:10.1038/nature07648
-
[4]
UNCOVER/MegaScience Finds Uniform and Highly Bursty Star Formation at 3 < z < 9, consistent with the High-Redshift UV Luminosity Function. arXiv e-prints , keywords =. doi:10.48550/arXiv.2601.16284 , archivePrefix =. 2601.16284 , primaryClass =
-
[5]
Monthly Notices of the Royal Astronomical Society , volume=
The impact of UV variability on the abundance of bright galaxies at z≥ 9 , author=. Monthly Notices of the Royal Astronomical Society , volume=. 2023 , publisher=
2023
-
[6]
On the Stellar Populations of Galaxies at z = 9-11: The Growth of Metals and Stellar Mass at Early Times. , keywords =. doi:10.3847/1538-4357/ac4cad , archivePrefix =. 2111.05351 , primaryClass =
-
[7]
CEERS Key Paper. V. Galaxies at 4 < z < 9 Are Bluer than They Appear─Characterizing Galaxy Stellar Populations from Rest-frame 1 m Imaging. , keywords =. doi:10.3847/2041-8213/acc948 , archivePrefix =. 2301.00027 , primaryClass =
-
[8]
C., Alberts, S., Ji, Z., et al
The Galaxies Missed by Hubble and ALMA: The Contribution of Extremely Red Galaxies to the Cosmic Census at 3 < z < 8. , keywords =. doi:10.3847/1538-4357/ad3f17 , archivePrefix =. 2311.07483 , primaryClass =
-
[9]
The Constant Average Relationship between Dust-obscured Star Formation and Stellar Mass from z = 0 to z = 2.5. , keywords =. doi:10.3847/1538-4357/aa94ce , archivePrefix =. 1710.06872 , primaryClass =
work page internal anchor Pith review Pith/arXiv arXiv doi:10.3847/1538-4357/aa94ce
-
[10]
JADES: Resolving the Stellar Component and Filamentary Overdense Environment of Hubble Space Telescope (HST)-dark Submillimeter Galaxy HDF850.1 at z = 5.18. , keywords =. doi:10.3847/1538-4357/ad07e3 , archivePrefix =. 2309.04529 , primaryClass =
-
[11]
Mapping dusty galaxy growth at z > 5 with FRESCO: detection of H in submm galaxy HDF850.1 and the surrounding overdense structures. , keywords =. doi:10.1093/mnras/staf030 , archivePrefix =. 2309.04525 , primaryClass =
-
[12]
The AURORA Survey: Multiple Balmer and Paschen Emission Lines for Individual Star-forming Galaxies at z = 1.5─4.4. I. A Diversity of Nebular Attenuation Curves and Evidence for Non-unity Dust Covering Fractions. , keywords =. doi:10.3847/1538-4357/ae38da , archivePrefix =. 2506.17396 , primaryClass =
work page internal anchor Pith review Pith/arXiv arXiv doi:10.3847/1538-4357/ae38da
-
[13]
The dawn of discs: unveiling the turbulent ionized gas kinematics of the galaxy population at z 4─6 with JWST/NIRCam grism spectroscopy. , keywords =. doi:10.1093/mnras/staf1540 , archivePrefix =. 2503.21863 , primaryClass =
-
[14]
On the accuracy of posterior recovery with neural network emulators. arXiv e-prints , keywords =. doi:10.48550/arXiv.2503.13263 , archivePrefix =. 2503.13263 , primaryClass =
-
[15]
Stochastic Modeling of Star Formation Histories. III. Constraints from Physically Motivated Gaussian Processes. , keywords =. doi:10.3847/1538-4357/acff64 , archivePrefix =. 2208.05938 , primaryClass =
-
[16]
Fast and scalable Gaussian process modeling with applications to astronomical time series
Fast and Scalable Gaussian Process Modeling with Applications to Astronomical Time Series. , keywords =. doi:10.3847/1538-3881/aa9332 , archivePrefix =. 1703.09710 , primaryClass =
work page internal anchor Pith review Pith/arXiv arXiv doi:10.3847/1538-3881/aa9332
-
[17]
Stochastic modelling of star-formation histories II: star-formation variability from molecular clouds and gas inflow. , keywords =. doi:10.1093/mnras/staa1838 , archivePrefix =. 2006.09382 , primaryClass =
-
[18]
Optuna: A Next-generation Hyperparameter Optimization Framework
Optuna: A Next-generation Hyperparameter Optimization Framework. arXiv e-prints , keywords =. doi:10.48550/arXiv.1907.10902 , archivePrefix =. 1907.10902 , primaryClass =
work page internal anchor Pith review Pith/arXiv arXiv doi:10.48550/arxiv.1907.10902 1907
-
[19]
Bursting at the seams: the star-forming main sequence and its scatter at z=3-9 using NIRCam photometry from JADES. arXiv e-prints , keywords =. doi:10.48550/arXiv.2508.04410 , archivePrefix =. 2508.04410 , primaryClass =
-
[20]
Overview of the JWST Advanced Deep Extragalactic Survey (JADES)
Overview of the JWST Advanced Deep Extragalactic Survey (JADES). arXiv e-prints , keywords =. doi:10.48550/arXiv.2306.02465 , archivePrefix =. 2306.02465 , primaryClass =
work page internal anchor Pith review Pith/arXiv arXiv doi:10.48550/arxiv.2306.02465
-
[21]
JADES NIRSpec initial data release for the Hubble Ultra Deep Field: Redshifts and line fluxes of distant galaxies from the deepest JWST Cycle 1 NIRSpec multi-object spectroscopy. , keywords =. doi:10.1051/0004-6361/202347094 , archivePrefix =. 2306.02467 , primaryClass =
-
[22]
Prospector: Stellar population inference from spectra and SEDs
-
[23]
Are star formation rates of galaxies bimodal?
Are star formation rates of galaxies bimodal?. , keywords =. doi:10.1093/mnrasl/slx073 , archivePrefix =. 1705.03014 , primaryClass =
work page internal anchor Pith review Pith/arXiv arXiv doi:10.1093/mnrasl/slx073
-
[24]
The THESAN-ZOOM project: Burst, quench, repeat -- unveiling the evolution of high-redshift galaxies along the star-forming main sequence. arXiv e-prints , keywords =. doi:10.48550/arXiv.2503.00106 , archivePrefix =. 2503.00106 , primaryClass =
-
[25]
How to Measure Galaxy Star Formation Histories. II. Nonparametric Models. , keywords =. doi:10.3847/1538-4357/ab133c , archivePrefix =. 1811.03637 , primaryClass =
work page internal anchor Pith review Pith/arXiv arXiv doi:10.3847/1538-4357/ab133c
-
[26]
Ionizing properties of galaxies in JADES for a stellar mass complete sample: resolving the cosmic ionizing photon budget crisis at the Epoch of Reionization. , keywords =. doi:10.1093/mnras/stae2537 , archivePrefix =. 2409.01286 , primaryClass =
-
[27]
Stellar Population Inference with Prospector
Stellar Population Inference with Prospector. , keywords =. doi:10.3847/1538-4365/abef67 , archivePrefix =. 2012.01426 , primaryClass =
work page internal anchor Pith review Pith/arXiv arXiv doi:10.3847/1538-4365/abef67 2012
-
[28]
The Great Observatories Origins Deep Survey: Initial Results from Optical and Near-Infrared Imaging. , keywords =. doi:10.1086/379232 , archivePrefix =. astro-ph/0309105 , primaryClass =
work page internal anchor Pith review Pith/arXiv arXiv doi:10.1086/379232
-
[29]
2004, MNRAS, 354, 1020, doi: 10.1111/j.1365-2966.2004.08261.x
The physical properties of star-forming galaxies in the low-redshift Universe. , keywords =. doi:10.1111/j.1365-2966.2004.07881.x , archivePrefix =. astro-ph/0311060 , primaryClass =
-
[30]
Multiwavelength Study of Massive Galaxies at z -0.5ex 2. I. Star Formation and Galaxy Growth. , keywords =. doi:10.1086/521818 , archivePrefix =. 0705.2831 , primaryClass =
work page internal anchor Pith review Pith/arXiv arXiv doi:10.1086/521818
-
[31]
A Highly Consistent Framework for the Evolution of the Star-Forming "Main Sequence" from z~0-6
A Highly Consistent Framework for the Evolution of the Star-Forming ``Main Sequence'' from z -0.5ex 0-6. , keywords =. doi:10.1088/0067-0049/214/2/15 , archivePrefix =. 1405.2041 , primaryClass =
work page internal anchor Pith review Pith/arXiv arXiv doi:10.1088/0067-0049/214/2/15 2041
-
[32]
The main sequence of star-forming galaxies across cosmic times. , keywords =. doi:10.1093/mnras/stac3214 , archivePrefix =. 2203.10487 , primaryClass =
-
[33]
The Star-forming Main Sequence in JADES and CEERS at z > 1.4: Investigating the Burstiness of Star Formation. , keywords =. doi:10.3847/1538-4357/ad8ba4 , archivePrefix =. 2406.05178 , primaryClass =
-
[34]
Bayesian hierarchical modelling of the M _ * -SFR relation from 1 z 6 in ASTRODEEP. , keywords =. doi:10.1093/mnras/stac1999 , archivePrefix =. 2207.06322 , primaryClass =
-
[35]
Quantitative constraints on starburst cycles in galaxies with stellar masses in the range 10 ^ 8 - 10 ^ 10 M _. , keywords =. doi:10.1093/mnras/stu752 , adsurl =
-
[36]
Mini-quenching of z = 4-8 galaxies by bursty star formation. , keywords =. doi:10.1093/mnras/stad3239 , archivePrefix =. 2305.07066 , primaryClass =
-
[37]
Breathing in Low Mass Galaxies: A Study of Episodic Star Formation
Breathing in Low-Mass Galaxies: A Study of Episodic Star Formation. , keywords =. doi:10.1086/520504 , archivePrefix =. 0705.4494 , primaryClass =
work page internal anchor Pith review Pith/arXiv arXiv doi:10.1086/520504
-
[38]
The Star Formation Main Sequence: The Dependence of Specific Star Formation Rate and Its Dispersion on Galaxy Stellar Mass. , keywords =. doi:10.1088/2041-8205/808/2/L49 , archivePrefix =. 1507.03585 , primaryClass =
work page internal anchor Pith review Pith/arXiv arXiv doi:10.1088/2041-8205/808/2/l49 2041
-
[39]
Modeling the Effects of Star Formation Histories on H and Ultraviolet Fluxes in nearby Dwarf Galaxies. , keywords =. doi:10.1088/0004-637X/744/1/44 , archivePrefix =. 1109.2905 , primaryClass =
work page internal anchor Pith review Pith/arXiv arXiv doi:10.1088/0004-637x/744/1/44
-
[40]
Consequences of bursty star formation on galaxy observables at high redshifts
Consequences of bursty star formation on galaxy observables at high redshifts. , keywords =. doi:10.1093/mnras/stv1001 , archivePrefix =. 1408.5788 , primaryClass =
work page internal anchor Pith review Pith/arXiv arXiv doi:10.1093/mnras/stv1001
-
[41]
The Baryon Cycle of Dwarf Galaxies: Dark, Bursty, Gas-Rich Polluters
The Baryon Cycle of Dwarf Galaxies: Dark, Bursty, Gas-rich Polluters. , keywords =. doi:10.1088/0004-637X/792/2/99 , archivePrefix =. 1308.4131 , primaryClass =
work page internal anchor Pith review Pith/arXiv arXiv doi:10.1088/0004-637x/792/2/99
-
[42]
CEERS: Increasing Scatter along the Star-forming Main Sequence Indicates Early Galaxies Form in Bursts. , keywords =. doi:10.3847/1538-4357/ad9a6a , archivePrefix =. 2312.10152 , primaryClass =
-
[43]
Bursty star formation and galaxy-galaxy interactions in low-mass galaxies 1 Gyr after the Big Bang. , keywords =. doi:10.1093/mnras/stad3902 , archivePrefix =. 2310.02314 , primaryClass =
-
[44]
The star formation burstiness and ionizing efficiency of low-mass galaxies. , keywords =. doi:10.1093/mnras/stac360 , archivePrefix =. 2202.04081 , primaryClass =
-
[45]
The MUSE Hubble Ultra Deep Field Survey. XI. Constraining the low-mass end of the stellar mass - star formation rate relation at z < 1. , keywords =. doi:10.1051/0004-6361/201833136 , archivePrefix =. 1808.04900 , primaryClass =
work page internal anchor Pith review Pith/arXiv arXiv doi:10.1051/0004-6361/201833136
-
[46]
The Star Formation Main Sequence in the Hubble Space Telescope Frontier Fields
The Star Formation Main Sequence in the Hubble Space Telescope Frontier Fields. , keywords =. doi:10.3847/1538-4357/aa8874 , archivePrefix =. 1706.07059 , primaryClass =
work page internal anchor Pith review Pith/arXiv arXiv doi:10.3847/1538-4357/aa8874
-
[47]
The Star Formation Histories of Local Group Dwarf Galaxies. I. Hubble Space Telescope/Wide Field Planetary Camera 2 Observations. , keywords =. doi:10.1088/0004-637X/789/2/147 , archivePrefix =. 1404.7144 , primaryClass =
work page internal anchor Pith review Pith/arXiv arXiv doi:10.1088/0004-637x/789/2/147
-
[48]
The Herschel view of the dominant mode of galaxy growth from z=4 to the present day
The Herschel view of the dominant mode of galaxy growth from z = 4 to the present day. , keywords =. doi:10.1051/0004-6361/201425017 , archivePrefix =. 1409.5433 , primaryClass =
work page internal anchor Pith review Pith/arXiv arXiv doi:10.1051/0004-6361/201425017
-
[49]
Star Formation in AEGIS Field Galaxies since z=1.1: The Dominance of Gradually Declining Star Formation, and the Main Sequence of Star-forming Galaxies. , keywords =. doi:10.1086/517926 , archivePrefix =. astro-ph/0701924 , primaryClass =
work page internal anchor Pith review Pith/arXiv arXiv doi:10.1086/517926
-
[50]
The reversal of the star formation-density relation in the distant universe
The reversal of the star formation-density relation in the distant universe. , keywords =. doi:10.1051/0004-6361:20077525 , archivePrefix =. astro-ph/0703653 , primaryClass =
work page internal anchor Pith review Pith/arXiv arXiv doi:10.1051/0004-6361:20077525
-
[51]
Evolution of Intrinsic Scatter in the SFR-Stellar Mass Correlation at 0.5<z<3
Evolution of Intrinsic Scatter in the SFR-Stellar Mass Correlation at 0.5 < z < 3. , keywords =. doi:10.3847/2041-8205/820/1/L1 , archivePrefix =. 1602.03909 , primaryClass =
work page internal anchor Pith review Pith/arXiv arXiv doi:10.3847/2041-8205/820/1/l1 2041
-
[52]
The Average Star Formation Histories of Galaxies in Dark Matter Halos from z=0-8
The Average Star Formation Histories of Galaxies in Dark Matter Halos from z = 0-8. , keywords =. doi:10.1088/0004-637X/770/1/57 , archivePrefix =. 1207.6105 , primaryClass =
work page internal anchor Pith review Pith/arXiv arXiv doi:10.1088/0004-637x/770/1/57
-
[53]
The confinement of star-forming galaxies into a main sequence through episodes of gas compaction, depletion and replenishment. , keywords =. doi:10.1093/mnras/stw131 , archivePrefix =. 1509.02529 , primaryClass =
work page internal anchor Pith review Pith/arXiv arXiv doi:10.1093/mnras/stw131
-
[54]
Gas Regulation of Galaxies: The Evolution of the Cosmic Specific Star Formation Rate, the Metallicity-Mass-Star-formation Rate Relation, and the Stellar Content of Halos. , keywords =. doi:10.1088/0004-637X/772/2/119 , archivePrefix =. 1303.5059 , primaryClass =
work page internal anchor Pith review Pith/arXiv arXiv doi:10.1088/0004-637x/772/2/119
-
[55]
The Impact of cold gas accretion above a mass floor on galaxy scaling relations
The Impact of Cold Gas Accretion Above a Mass Floor on Galaxy Scaling Relations. , keywords =. doi:10.1088/0004-637X/718/2/1001 , archivePrefix =. 0912.1858 , primaryClass =
work page internal anchor Pith review Pith/arXiv arXiv doi:10.1088/0004-637x/718/2/1001
-
[56]
The Origin of Dwarf Galaxies, Cold Dark Matter, and Biased Galaxy Formation. , keywords =. doi:10.1086/164050 , adsurl =
-
[57]
Constraining the major merger history of z 3-9 galaxies using JADES: dominant in-situ star formation. arXiv e-prints , keywords =. doi:10.48550/arXiv.2502.01721 , archivePrefix =. 2502.01721 , primaryClass =
-
[58]
A Merger-Driven Scenario for Cosmological Disk Galaxy Formation
A Merger-driven Scenario for Cosmological Disk Galaxy Formation. , keywords =. doi:10.1086/504412 , archivePrefix =. astro-ph/0503369 , primaryClass =
work page internal anchor Pith review Pith/arXiv arXiv doi:10.1086/504412
-
[59]
Star Formation Variability as a Probe for the Baryon Cycle within Galaxies. , keywords =. doi:10.3847/1538-4357/acc251 , archivePrefix =. 2211.01922 , primaryClass =
-
[60]
The physical origin of long gas depletion times in galaxies
The Physical Origin of Long Gas Depletion Times in Galaxies. , keywords =. doi:10.3847/1538-4357/aa8096 , archivePrefix =. 1704.04239 , primaryClass =
work page internal anchor Pith review Pith/arXiv arXiv doi:10.3847/1538-4357/aa8096
-
[61]
Live fast, die young: GMC lifetimes in the FIRE cosmological simulations of Milky Way mass galaxies. , keywords =. doi:10.1093/mnras/staa2116 , archivePrefix =. 1911.05251 , primaryClass =
-
[62]
Star Formation in Disk Galaxies. II. The Effect Of Star Formation and Photoelectric Heating on the Formation and Evolution of Giant Molecular Clouds. , keywords =. doi:10.1088/0004-637X/730/1/11 , archivePrefix =. 1101.1534 , primaryClass =
work page internal anchor Pith review Pith/arXiv arXiv doi:10.1088/0004-637x/730/1/11
-
[63]
Global Star Formation Rates in Disk Galaxies and Circumnuclear Starbursts from Cloud Collisions
Star Formation Rates in Disk Galaxies and Circumnuclear Starbursts from Cloud Collisions. , keywords =. doi:10.1086/308905 , archivePrefix =. astro-ph/9906355 , primaryClass =
work page internal anchor Pith review Pith/arXiv arXiv doi:10.1086/308905
-
[64]
Starburst99: Synthesis Models for Galaxies with Active Star Formation
Starburst99: Synthesis Models for Galaxies with Active Star Formation. , keywords =. doi:10.1086/313233 , archivePrefix =. astro-ph/9902334 , primaryClass =
work page internal anchor Pith review Pith/arXiv arXiv doi:10.1086/313233
-
[65]
A Model for the Origin of Bursty Star Formation in Galaxies
A model for the origin of bursty star formation in galaxies. , keywords =. doi:10.1093/mnras/stx2595 , archivePrefix =. 1701.04824 , primaryClass =
work page internal anchor Pith review Pith/arXiv arXiv doi:10.1093/mnras/stx2595
-
[66]
Decoding the variability in the star formation histories of z 0.8 galaxies. , keywords =. doi:10.1093/mnras/staf657 , adsurl =
-
[67]
The diversity and variability of star formation histories in models of galaxy evolution. , keywords =. doi:10.1093/mnras/staa2150 , archivePrefix =. 2007.07916 , primaryClass =
-
[68]
The Variability of Star Formation Rate in Galaxies. II. Power Spectrum Distribution on the Main Sequence. , keywords =. doi:10.3847/1538-4357/ab8b5e , archivePrefix =. 2003.02146 , primaryClass =
-
[69]
Stochastic modeling of star-formation histories I: the scatter of the star-forming main sequence
Stochastic modelling of star-formation histories I: the scatter of the star-forming main sequence. , keywords =. doi:10.1093/mnras/stz1449 , archivePrefix =. 1901.07556 , primaryClass =
work page internal anchor Pith review Pith/arXiv arXiv doi:10.1093/mnras/stz1449 1901
-
[70]
The IMACS Cluster Building Survey. IV. The Log-normal Star Formation History of Galaxies. , keywords =. doi:10.1088/0004-637X/770/1/64 , archivePrefix =. 1303.3917 , primaryClass =
work page internal anchor Pith review Pith/arXiv arXiv doi:10.1088/0004-637x/770/1/64
-
[71]
Is Main Sequence Galaxy Star Formation Controlled by Halo Mass Accretion?
Is main-sequence galaxy star formation controlled by halo mass accretion?. , keywords =. doi:10.1093/mnras/stv2513 , archivePrefix =. 1508.04842 , primaryClass =
work page internal anchor Pith review Pith/arXiv arXiv doi:10.1093/mnras/stv2513
-
[72]
A Redshift-independent Efficiency Model: Star Formation and Stellar Masses in Dark Matter Halos at z 4. , keywords =. doi:10.3847/1538-4357/aae8e0 , archivePrefix =. 1806.03299 , primaryClass =
work page internal anchor Pith review Pith/arXiv arXiv doi:10.3847/1538-4357/aae8e0
-
[73]
JADES: Insights into the low-mass end of the mass-metallicity-SFR relation at 3 < z < 10 from deep JWST/NIRSpec spectroscopy. , keywords =. doi:10.1051/0004-6361/202346698 , archivePrefix =. 2304.08516 , primaryClass =
-
[74]
Galaxy size and mass build-up in the first 2 Gyr of cosmic history from multi-wavelength JWST NIRCam imaging. , keywords =. doi:10.1051/0004-6361/202452690 , archivePrefix =. 2410.16354 , primaryClass =
-
[75]
doi:10.1051/0004-6361/202348804
JADES: A large population of obscured, narrow-line active galactic nuclei at high redshift. , keywords =. doi:10.1051/0004-6361/202348804 , archivePrefix =. 2311.18731 , primaryClass =
-
[76]
Gravity and the non-linear growth of structure in the Carnegie-Spitzer-IMACS Redshift Survey. , keywords =. doi:10.1093/mnras/staa100 , archivePrefix =. 1908.08952 , primaryClass =
-
[77]
Modeling the Panchromatic Spectral Energy Distributions of Galaxies
Modeling the Panchromatic Spectral Energy Distributions of Galaxies. , keywords =. doi:10.1146/annurev-astro-082812-141017 , archivePrefix =. 1301.7095 , primaryClass =
work page internal anchor Pith review Pith/arXiv arXiv doi:10.1146/annurev-astro-082812-141017
-
[78]
Fitting the integrated Spectral Energy Distributions of Galaxies
Fitting the integrated spectral energy distributions of galaxies. , keywords =. doi:10.1007/s10509-010-0458-z , archivePrefix =. 1008.0395 , primaryClass =
work page internal anchor Pith review Pith/arXiv arXiv doi:10.1007/s10509-010-0458-z
-
[79]
The Stellar Populations and Evolution of Lyman Break Galaxies
The Stellar Populations and Evolution of Lyman Break Galaxies. , keywords =. doi:10.1086/322412 , archivePrefix =. astro-ph/0105087 , primaryClass =
work page internal anchor Pith review Pith/arXiv arXiv doi:10.1086/322412
-
[80]
Properties of z -0.5ex 3-6 Lyman break galaxies. I. Testing star formation histories and the SFR-mass relation with ALMA and near-IR spectroscopy. , keywords =. doi:10.1051/0004-6361/201220002 , archivePrefix =. 1207.3074 , primaryClass =
work page internal anchor Pith review Pith/arXiv arXiv doi:10.1051/0004-6361/201220002
discussion (0)
Sign in with ORCID, Apple, or X to comment. Anyone can read and Pith papers without signing in.