REVIEW 4 major objections 4 minor 37 references
Probing Equatorial Ionospheric TEC at Sub-GHz Frequencies with Wide-Band (B4) uGMRT Interferometric Data
T0 review · 4 major / 4 minor · reviewed 2026-08-06 · deepseek-v4-flash
Pith's one-line read A ten-hour uGMRT Band-4 observation of the calibrator 3C48 measures differential ionospheric TEC with sub-mTECU precision and finds a steeper-than-classical phase structure function with slope 1.72 ± 0.07 and a 6.66 km diffractive scale…
desk verdict First uGMRT Band-4 TEC measurement with a plausible but under-robust beta and rdiff: the paper needs a filter-dependence analysis before the headline numbers are taken seriously. read the letter →
The pith
A machine-rendered reading of the paper's core claim, the machinery that carries it, and where it could break.
The reading
What carries the argument
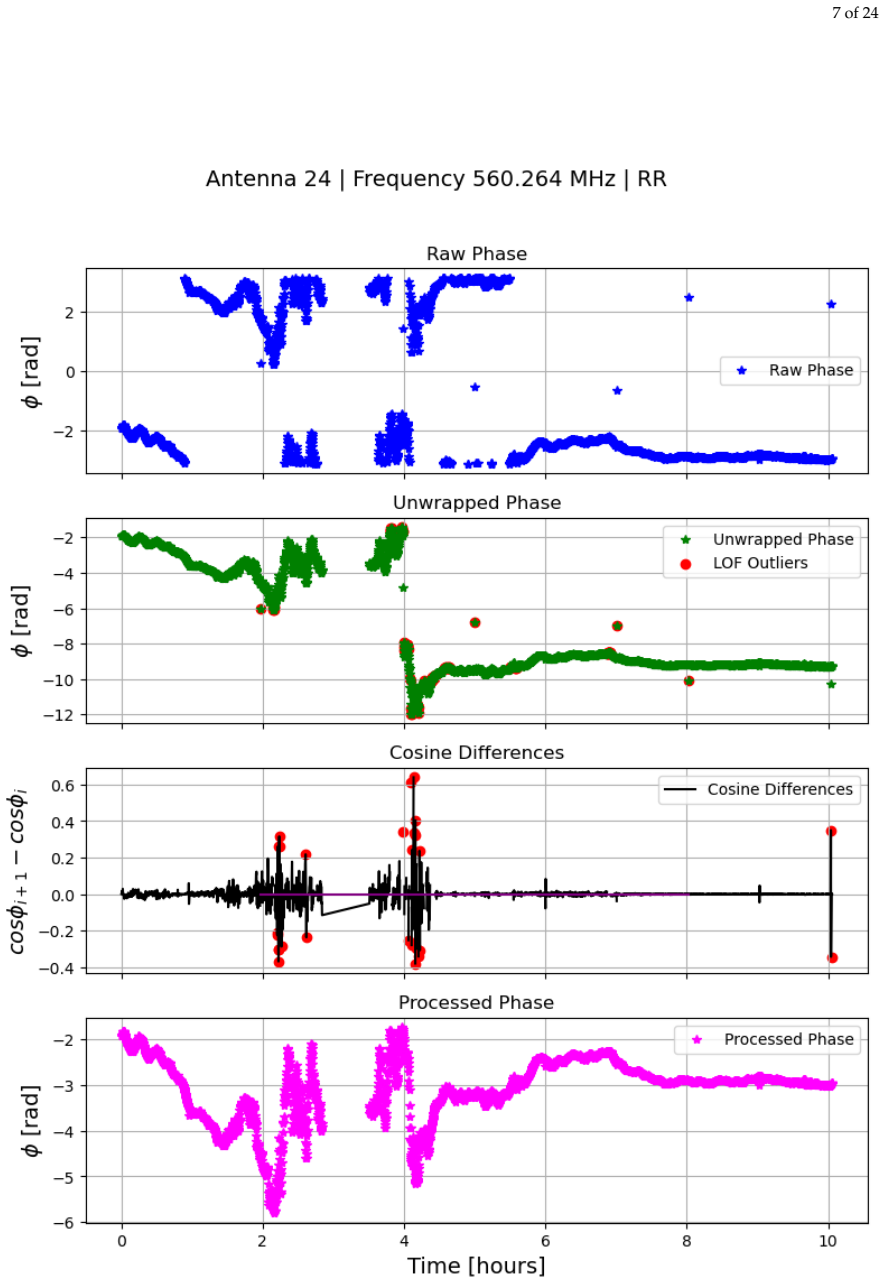
The load-bearing object is the bandpass phase solution from a bright compact calibrator, treated as an ionospheric phase screen after removing a one-hour boxcar continuum. The screen is converted to differential TEC with the dispersive relation $\Delta\phi \approx 8.45\,(1\,\mathrm{GHz}/\nu)\,(\delta\mathrm{TEC}/1\,\mathrm{TECU})$ radians, then projected onto a thin ionospheric shell at the IRI-predicted peak height so pierce-point separations and slant-to-vertical TEC corrections are geometrically consistent. TEC gradients come from a regularized weighted least-squares fit of a second-order Taylor polynomial to all antenna-pair differences, and the spatial statistics are summarized by the phase structure function $\Xi(r) = \langle[\phi(\mathbf{x})-\phi(\mathbf{x}+\mathbf{r})]^2\rangle \propto (r/r_{\rm diff})^\beta$, whose fitted slope and diffractive scale carry the paper's physical conclusion.
What would settle it
Recompute the phase structure function from the same data with boxcar smoothing windows of 30 minutes and 2 hours (or with the instrumental continuum fitted from narrow sub-bands at the two ends of the band): if the fitted $\beta$ and $r_{\rm diff}$ shift by more than the quoted uncertainties, the reported spectrum is an artifact of the continuum-removal choice rather than an ionospheric property. Independently, compare the $\delta\mathrm{TEC}$ time series with dense GNSS or VHF-radar TEC measurements over the array; large ionospheric fluctuations on the one-hour timescale that are absent from the residual phases would indicate that the subtraction discards real signal.
Extended reading notes
Core claim
The paper's central claim is that residual phase solutions from standard direction-independent calibration of a bright point source contain a high-fidelity measurement of the low-latitude ionosphere. After unwrapping, outlier rejection, and subtraction of a one-hour boxcar-smoothed continuum, the residual phases are interpreted as ionospheric phase and converted to differential TEC through the dispersive relation $\Delta\phi \approx 8.45\,(1\,\mathrm{GHz}/\nu)\,(\delta\mathrm{TEC}/1\,\mathrm{TECU})$ radians. The measured $\delta\mathrm{TEC}$ time series reach sub-mTECU precision on central baselines, and a second-order Taylor model fitted to all 406 antenna-pair differences reconstructs two-dimensional TEC gradients that show strong north–south variability. The phase structure function computed from these data follows $\Xi(r) = (r/r_{\rm diff})^\beta$ with $\beta = 1.72 \pm 0.07$ and $r_{\rm diff} \approx 6.66$ km, so the paper concludes that uGMRT's location and layout make it a uniquely capable instrument for equatorial ionospheric studies at sub-GHz frequencies.
Load-bearing premise
The analysis assumes that after subtracting a one-hour boxcar-smoothed continuum, the residual phases are purely ionospheric fluctuations; the paper states that it cannot separate slowly varying ionospheric phase from instrumental effects, so any real ionospheric signal varying on timescales longer than an hour is removed along with the instrument.
Editorial extensions
If this is right
- Routine uGMRT Band-4 calibrator scans can yield differential TEC time series with sub-mTECU precision on baselines below about 1.4 km and roughly 1 mTECU on longer baselines, exceeding the sensitivity available from the sparse GNSS stations around the site.
- At 600 MHz the ionospheric phase structure function over the array is steeper than the classical 5/3 turbulence scaling, with $\beta = 1.72 \pm 0.07$ and a diffractive scale of about 6.66 km, meaning phase variance reaches $1\,\mathrm{rad}^2$ over baselines of only a few kilometres and strongly limits temporal coherence for wide-field imaging.
- Reconstructed TEC gradients show pronounced north–south variability, with southern-arm gradients reaching roughly $\pm 0.01$ TECU/km, consistent with medium-scale travelling ionospheric disturbances in the post-sunset equatorial ionosphere.
- Five principal components explain nearly all of the variance in the differential TEC time series, indicating that the ionospheric screen over the array is low-dimensional and supports the application of reduced-order ionospheric models during calibration.
- Ionospheric fluctuations and phase instability are markedly stronger in the evening hours, coinciding with the post-sunset intensification of the Equatorial Ionization Anomaly and reported scintillation, so scheduling sensitive sub-GHz observations away from this window should improve data quality.
Reading between the lines
- The one-hour boxcar subtraction almost certainly removes real ionospheric power on timescales longer than an hour, so the reported $\beta$ and $r_{\rm diff}$ describe the residual fluctuations; a multi-window study could reveal whether the full spectrum has a break or a different slope at large scales.
- Applied to archival uGMRT Band-2, Band-3, and Band-4 observations, the same calibrator-phase technique could build a seasonal and solar-cycle climatology of equatorial ionospheric turbulence in a region where the closest public GNSS station is roughly 500 km away.
- Because the three GMRT arms sample different azimuths, a two-dimensional structure-function analysis of the kind the paper defers to future work could test whether the band-like anisotropic irregularities align with the geomagnetic field.
- If the near-unity variance captured by five principal components is a stable feature, calibration pipelines could fit a few time-varying TEC-gradient coefficients instead of full per-antenna phase screens, potentially improving sensitivity for faint low-frequency targets.
Editorial analysis
A structured set of objections, weighed in public.
Referee Report
Summary. This paper analyzes ten hours of uGMRT Band-4 (550–750 MHz) observations of the bright calibrator 3C48. After RFI flagging, delay and bandpass calibration, the authors remove a one-hour boxcar-smoothed continuum from the unwrapped antenna phases, convert the residual phases to differential TEC relative to reference antenna C06, apply pierce-point and slant-to-vertical geometric corrections, fit second-order polynomial TEC gradients over the array, and estimate a spatial phase structure function. The central claims are that uGMRT can achieve sub-mTECU differential TEC precision on the central square (approximately 1 mTECU on the arms) and that the ionospheric phase structure function is a power law with β = 1.72 ± 0.07 and diffractive scale rdiff = 6.66 km.
Significance. The paper addresses a worthwhile problem: using a low-latitude interferometer as a high-sensitivity ionospheric probe at sub-GHz frequencies. A successful demonstration would complement VLA and LOFAR mid-latitude results with unique equatorial EIA-region coverage and could inform calibration strategies. The pipeline broadly follows established methods (Helmboldt et al. 2012; Mangla and Datta 2022), and the AOFlagger cross-check for RFI robustness is a useful validation. However, the central quantitative claims are currently not supported by the analysis as presented: the abstract's precision numbers are contradicted by the MAD values reported in Section 3, and the structure-function parameters are derived from heavily filtered phases without a filter-sensitivity test or an uncertainty estimate for rdiff. The result is potentially valuable but requires revision before it can be accepted.
major comments (4)
- [Abstract; Section 3 (Figure 7 paragraph); Section 4] The precision claim is internally inconsistent. The abstract states less than 1 mTECU for central square antennas and approximately 1 mTECU for arm antennas, and Section 3 states 'less than mTECU' and 'a few mTECU' for the same quantities. Yet the text immediately after Figure 7 reports MAD values of about 0.0023 TECU (2.3 mTECU) for central-square baselines and about 0.0147 TECU (14.7 mTECU) for arm baselines. Section 4 also says precision 'drops by over an order of magnitude' on long baselines, although the ratio of the two quoted MADs is only about 6.4. Since 'sub-mTECU precision' is a headline claim, the reported MADs must be reconciled with the text, or the abstract and summary claims must be corrected.
- [Section 2.3; Section 3.2, Eqs. (10)-(11)] The structure-function parameters β and rdiff are computed from residual phases after a one-hour boxcar high-pass filter. As the authors acknowledge in Section 2.3, they 'lack the capability to separate the slowly varying component of the ionospheric phase from instrumental effects' and can only measure fluctuations on timescales ≤1 hour. Such a filter preferentially removes large-scale, slowly varying phase structure, and since the structure function at the largest pair separations is weighted by these scales, the fitted slope and rdiff can be biased. No alternative filter width, no simulation of the filter step, and no error bar on rdiff are given; the quoted ±0.07 is not connected to an explicit estimator or bootstrap. Please add a filter-sensitivity test (e.g., boxcar widths of 30 min and 2 h, or injection of a known power-law phase screen through the same pipeline) and report a full uncertainty for rdiff.
- [Section 2.3 (excluded 20:15-20:55 IST)] The exclusion of the 45-minute interval 20:15-20:55 IST is post hoc and the justification is not decisive. The text lists RFI, instrumental drift, and genuine ionospheric activity as possible causes, and notes that 'it is also possible that the ionosphere was more active during this period.' Because this is the most dynamic part of the night and the science goal explicitly includes evening EIA/plasma-bubble-related fluctuations, deleting this interval without an independent data-quality diagnostic (e.g., closure-phase stability or amplitude SNR unrelated to ionospheric phase) removes the very signal the array is best suited to detect. Please present results both with and without this interval, or justify the cut with a metric independent of the ionospheric phase amplitude.
- [Section 3.2] The estimation of Ξ(r) is under-specified. The paper does not state how the ensemble average is formed: how many time samples contribute, whether samples are independent, how pair separations are binned in r, how the anisotropic 'band-like pattern' is handled, or how the covariance between baselines sharing antennas is treated. Without this information, the reported β uncertainty cannot be reproduced or assessed. Please provide the estimator definition, the number of independent measurements per radial bin, and the procedure used to obtain the 0.07 uncertainty.
minor comments (4)
- [Abstract; Section 3] Several numerical values are missing in the printed text: the abstract reads 'precision of < mTECU' and 'approximately mTECU for the arm antennas', and Section 3 reads 'less than mTECU (≤ mTECU) uncertainty'. These need to be filled in or the text must match the reported MAD values.
- [Section 3.1, Eqs. (4)-(5)] Equation (4) includes a constant term p5, but Equation (5) drops it without comment; the units of the polynomial coefficients should also be stated explicitly, especially since p0 is described later as '±5 TECU' while the text also quotes physical gradient amplitudes of '±0.01 TECU/km'.
- [Section 2.3] The sentence defining the LOF score contains the repeated phrase 'is defined is defined as'; please correct.
- [Section 3.1] The claim that a second-order Taylor series 'well represents' the TEC structure is not supported by any goodness-of-fit statistic; please report the fit residuals or a reduced chi-square for the polynomial fits.
Circularity Check
No circular derivation: beta and rdiff are fitted directly from measured interferometric phases, with no load-bearing self-citation or definitional reduction.
full rationale
The paper's central quantities are computed from measured quantities rather than assumed into existence. The differential TEC values are obtained from residual calibration phases through Equation (2) using the physical conversion constant 8.45 x 10^9, and the structure function of Equation (10) is built directly from those phase-derived TEC measurements across antenna separations. The reported beta = 1.72 +/- 0.07 and rdiff = 6.66 km are parameters in the model of Equation (11), fitted to the measured structure function; they are not inputs to the measurement nor defined in terms of the conclusion. The authors explicitly state that they cannot separate slowly varying ionospheric phase from instrumental effects and therefore only measure fluctuations on timescales <= 1 hour; this is a stated modeling limitation and source of potential bias, not a circular step, because the power-law fit does not presuppose the slope or diffractive scale that are estimated. The method is attributed to prior external work (Helmboldt et al. 2012; Mangla and Datta 2022), and the authors of this paper do not rely on their own prior results to establish the central claim. Cross-checks such as the AOFlagger comparison and IRI-based geometry are independent checks on the data processing, not recycled outputs of the final fit. No self-definitional step, renamed prediction, or self-citation chain is present, so the appropriate finding is no significant circularity.
Assumptions & free parameters
free parameters (5)
- Power-law slope beta =
1.72 +/- 0.07
- Diffractive scale r_diff =
6.66 km
- TEC gradient polynomial coefficients p0-p4 =
time series (not quoted)
- Regularization parameter lambda =
1e-6
- Continuum-subtraction boxcar width =
1 hour
assumptions (5)
- domain assumption First-order ionospheric phase delay formula with constant 8.45 (Eq 2) is valid at 550-750 MHz; higher-order terms, Faraday rotation, and refraction are negligible.
- domain assumption The ionosphere can be represented as a thin shell at the IRI-predicted peak height for pierce-point projection and slant-to-vertical correction.
- ad hoc to paper Instrumental phase varies smoothly on timescales longer than 1 hour and is separable from ionospheric fluctuations by boxcar smoothing.
- domain assumption Phase structure function is a power law of baseline separation (Kolmogorov or modified), Eq 11.
- domain assumption 3C48 is a compact, stable source whose model visibilities are known well enough for calibration and source-phase removal.
Cite this review
Pith. "Pith review of Probing Equatorial Ionospheric TEC at Sub-GHz Frequencies with Wide-Band (B4) uGMRT Interferometric Data." pith.science (2026). https://pith.science/paper/GR4MZ3LF
@misc{pith2026250620690,
  author       = {Pith},
  title        = {Pith review of: Probing Equatorial Ionospheric TEC at Sub-GHz Frequencies with Wide-Band (B4) uGMRT Interferometric Data},
  year         = {2026},
  howpublished = {\url{https://pith.science/paper/GR4MZ3LF}},
  note         = {Machine review of arXiv:2506.20690}
}
abstract
Phase stability at low radio frequencies is severely impacted by ionospheric propagation delays. Radio interferometers such as the Giant Metrewave Radio Telescope (GMRT) are capable of detecting changes in the ionosphere's total electron content (TEC) over larger spatial scales and with greater sensitivity compared to conventional tools like the Global Navigation Satellite System (GNSS). Thanks to its unique design featuring both a dense central array and long outer arms-and its strategic location, the GMRT is particularly well-suited for studying the sensitive ionospheric region located between the northern peak of the Equatorial Ionization Anomaly (EIA) and the magnetic equator. In this study, we observe the bright flux calibrator 3C48 for ten hours to characterize and study the low-latitude ionosphere with the upgraded GMRT (uGMRT). We outline the methods used for wideband data reduction and processing to accurately measure differential TEC (dTEC) between antenna pairs, achieving a precision of less than 1 mTECU for the central square antennas and approximately 1 mTECU for the arm antennas. The measured dTEC values are used to estimate the TEC gradient across the GMRT arm antennas. We measure the ionospheric phase structure function and find a power-law slope of $\beta = 1.72$, indicating deviations from pure Kolmogorov turbulence. The inferred diffractive scale the spatial separation over which the phase variance reaches $1 \text{rad}^2$ is 6.66 km. A small diffractive scale implies high phase variability across the field of view and reduced temporal coherence, which poses challenges for calibration and imaging.
Figures


Figures from the paper (6 more)


Reference graph
Works this paper leans on
-
[1]
Interferometry and Synthesis in Radio Astronomy, 2nd Edition.; Wiley-Interscience, 2001
Thompson, A.R.; Moran, J.M.; Swenson, Jr., G.W. Interferometry and Synthesis in Radio Astronomy, 2nd Edition.; Wiley-Interscience, 2001
work page 2001
-
[2]
Atmospheric Refractive Electromagnetic Wave Bending and Propagation Delay
Mangum, J.G.; Wallace, P . Atmospheric Refractive Electromagnetic Wave Bending and Propagation Delay. Publications of the Astronomical Society of the Pacific 2015, 127, 74. https://doi.org/10.1086/679582
doi:10.1086/679582 2015
-
[3]
Fallows, R.A.; Forte, B.; Astin, I.; Allbrook, T.; Arnold, A.; Wood, A.; Dorrian, G.; Mevius, M.; Rothkaehl, H.; Matyjasiak, B.; et al. A LOFAR observation of ionospheric scintillation from two simultaneous travelling iono- spheric disturbances. Journal of Space Weather and Space Climate 2020, 10, 10, [arXiv:astro-ph.EP/2003.04013]. https://doi.org/10.105...
work page Pith review arXiv 2020
-
[4]
Latitudinal variation of the ionosphere in the African sector using GPS TEC data
Opio, P .; D’ujanga, F.; Ssenyonga, T. Latitudinal variation of the ionosphere in the African sector using GPS TEC data. Advances in Space Research 2015, 55, 1640–1650. https://doi.org/https://doi.org/10.1016/j.asr.20 14.12.036
-
[5]
Configuration Considerations for Low Frequency Arrays
Lonsdale, C.J. Configuration Considerations for Low Frequency Arrays. In Proceedings of the From Clark Lake to the Long Wavelength Array: Bill Erickson’s Radio Science; Kassim, N.; Perez, M.; Junor, W.; Henning, P ., Eds., 2005, Vol. 345,Astronomical Society of the Pacific Conference Series, p. 399
work page 2005
-
[6]
T..; van der Tol, S..; Cotton, W
Intema, H. T..; van der Tol, S..; Cotton, W. D..; Cohen, A. S..; van Bemmel, I. M..; Röttgering, H. J. A.. Ionospheric calibration of low frequency radio interferometric observations using the peeling scheme - I. Method description and first results. A&A 2009, 501, 1185–1205. https://doi.org/10.1051/0004-6361/2008 11094
-
[7]
High-precision measurements of ionospheric TEC gradients with the Very Large Array VHF system
Helmboldt, J.F.; Lazio, T.J.W.; Intema, H.T.; Dymond, K.F. High-precision measurements of ionospheric TEC gradients with the Very Large Array VHF system. Radio Science 2012, 47, RS0K02, [arXiv:physics.space- ph/1201.3872]. https://doi.org/10.1029/2011RS004883. 23 of 24
arXiv 2012
-
[8]
A method for characterizing transient ionospheric disturbances using a large radiotelescope array
Jacobson, A.R.; Erickson, W.C. A method for characterizing transient ionospheric disturbances using a large radiotelescope array. A & A 1992, 257, 401–409
work page 1992
Show all 37 references
-
[9]
Probing fine-scale ionospheric structure with the Very Large Array radio telescope
Cohen, A.S.; Röttgering, H.J.A. Probing fine-scale ionospheric structure with the Very Large Array radio telescope. The Astronomical Journal 2009, 138, 439. https://doi.org/10.1088/0004-6256/138/2/439
2009 doi
-
[10]
Characterization of the ionosphere above the Murchison Radio Observatory using the Murchison Widefield Array
Jordan, C.H.; Murray, S.; Trott, C.M.; Wayth, R.B.; Mitchell, D.A.; Rahimi, M.; Pindor, B.; Procopio, P .; Morgan, J. Characterization of the ionosphere above the Murchison Radio Observatory using the Murchison Widefield Array. MNRAS 2017, 471, 3974–3987, [arXiv:astro-ph.IM/17...
2017 arXiv
-
[11]
Climatology of midlatitude ionospheric dis- turbances from the Very Large Array Low-frequency Sky Survey
Helmboldt, J.F.; Lane, W.M.; Cotton, W.D. Climatology of midlatitude ionospheric dis- turbances from the Very Large Array Low-frequency Sky Survey. Radio Science 2012, 47, [https://agupubs.onlinelibrary.wiley.com/doi/pdf/10.1029/2012RS005025]. https://doi.org/https: //doi.org/...
2012 doi
-
[12]
Probing ionospheric structures using the LOFAR radio telescope
Mevius, M.; van der Tol, S.; Pandey, V .N.; Vedantham, H.K.; Brentjens, M.A.; de Bruyn, A.G.; Abdalla, F.B.; Asad, K.M.B.; Bregman, J.D.; Brouw, W.N.; et al. Probing ionospheric structures using the LOFAR radio telescope. Radio Science 2016, 51, 927–941, [arXiv:astro-ph.IM/160...
2016 arXiv
-
[13]
Two Anomalies in the Ionosphere.Nature 1946, 157, 691
Appleton, E.V . Two Anomalies in the Ionosphere.Nature 1946, 157, 691. https://doi.org/10.1038/157691a0
1946 doi
-
[14]
A brief review of equatorial ionization anomaly and ionospheric irregularities
Balan, N.; ,Institute of Geology and Geophysics, Chinese Academy of Sciences, Beijing 100029, China.; Liu, L.; Le, H. A brief review of equatorial ionization anomaly and ionospheric irregularities. Earth Planet. Phys. 2018, 2, 1–19
2018
-
[15]
Study of the equatorial ionosphere using the Giant Metrewave Radio Telescope (GMRT) at sub-GHz frequencies
Mangla, S.; Datta, A. Study of the equatorial ionosphere using the Giant Metrewave Radio Telescope (GMRT) at sub-GHz frequencies. MNRAS 2022, 513, 964–975, [arXiv:astro-ph.IM/2204.04230]. https: //doi.org/10.1093/mnras/stac942
2022 arXiv
-
[16]
The upgraded GMRT: opening new windows on the radio Universe
Gupta, Y.; Ajithkumar, B.; Kale, H.S.; Nayak, S.; Sabhapathy, S.; Sureshkumar, S.; Swami, R.V .; Chengalur, J.N.; Ghosh, S.K.; Ishwara-Chandra, C.H.; et al. The upgraded GMRT: opening new windows on the radio Universe. Current Science 2017, 113, 707–714. https://doi.org/10.185...
2017 doi
-
[17]
An Accurate Flux Density Scale from 1 to 50 GHz
Perley, R.A.; Butler, B.J. An Accurate Flux Density Scale from 1 to 50 GHz. ApJS 2013, 204, 19, [arXiv:astro- ph.IM/1211.1300]. https://doi.org/10.1088/0067-0049/204/2/19
2013 arXiv
-
[18]
CASA, the Common Astronomy Software Applications for Radio Astronomy
CASA Team.; Bean, B.; Bhatnagar, S.; Castro, S.; Donovan Meyer, J.; Emonts, B.; Garcia, E.; Garwood, R.; Golap, K.; Gonzalez Villalba, J.; et al. CASA, the Common Astronomy Software Applications for Radio Astronomy. P ASP2022, 134, 114501, [arXiv:astro-ph.IM/2210.02276]. https...
-
[19]
Revisiting the radio interferometer measurement equation
Smirnov, O.M. Revisiting the radio interferometer measurement equation. I. A full-sky Jones formalism. A & A 2011, 527, A106, [arXiv:astro-ph.IM/1101.1764]. https://doi.org/10.1051/0004-6361/201016082
2011 arXiv
-
[20]
Ionospheric Modelling using GPS to Calibrate the MWA
Arora, B.S.; Morgan, J.; Ord, S.M.; Tingay, S.J.; Bell, M.; Callingham, J.R.; Dwarakanath, K.S.; For, B.Q.; Hancock, P .; Hindson, L.; et al. Ionospheric Modelling using GPS to Calibrate the MWA. II: Regional Ionospheric Modelling using GPS and GLONASS to Estimate Ionospheric ...
-
[21]
The Giant Metre-Wave Radio Telescope
Swarup, G.; Ananthakrishnan, S.; Kapahi, V .K.; Rao, A.P .; Subrahmanya, C.R.; Kulkarni, V .K. The Giant Metre-Wave Radio Telescope. Current Science 1991, 60, 95
1991
-
[22]
Compact radio sources in the 3C catalog
Pearson, T.J.; Perley, R.A.; Readhead, A.C.S. Compact radio sources in the 3C catalog. AJ 1985, 90, 738–755. https://doi.org/10.1086/113782
1985 doi
-
[23]
A broad-band flux scale for low-frequency radio telescopes
Scaife, A.M.M.; Heald, G.H. A broad-band flux scale for low-frequency radio telescopes. MNRAS 2012, 423, L30–L34, [arXiv:astro-ph.IM/1203.0977]. https://doi.org/10.1111/j.1745-3933.2012.01251.x
2012 arXiv
-
[24]
The effect of the ionosphere on ultra- low-frequency radio-interferometric observations
de Gasperin, F.; Mevius, M.; Rafferty, D.A.; Intema, H.T.; Fallows, R.A. The effect of the ionosphere on ultra- low-frequency radio-interferometric observations. A & A 2018, 615, A179, [arXiv:astro-ph.IM/1804.07947]. https://doi.org/10.1051/0004-6361/201833012
2018 arXiv
-
[25]
A morphological algorithm for improving radio- frequency interference detection
Offringa, A.R.; van de Gronde, J.J.; Roerdink, J.B.T.M. A morphological algorithm for improving radio- frequency interference detection. A & A 2012, 539, A95, [arXiv:astro-ph.IM/1201.3364]. https://doi.org/10 .1051/0004-6361/201118497
2012 arXiv
-
[26]
Medium-scale traveling ionospheric disturbances affecting GPS measurements: Spatial and temporal analysis
Hernández-Pajares, M.; Juan, J.M.; Sanz, J. Medium-scale traveling ionospheric disturbances affecting GPS measurements: Spatial and temporal analysis. Journal of Geophysical Research: Space Physics 2006, 111, [https://agupubs.onlinelibrary.wiley.com/doi/pdf/10.1029/2005JA01147...
2006 doi
-
[27]
A new technique for spectral analysis of iono- spheric TEC fluctuations observed with the Very Large Array VHF system: From QP echoes to MSTIDs
Helmboldt, J.F.; Lazio, T.J.W.; Intema, H.T.; Dymond, K.F. A new technique for spectral analysis of iono- spheric TEC fluctuations observed with the Very Large Array VHF system: From QP echoes to MSTIDs. Radio Science 2012, 47, RS0L02, [arXiv:physics.space-ph/1201.3874]. https...
2012 arXiv
-
[28]
Spectral Analysis of Ionospheric Density Variations Measured With the Large Radio Tele- scope in the Low-Latitude Region
Mangla, S.; Datta, A. Spectral Analysis of Ionospheric Density Variations Measured With the Large Radio Tele- scope in the Low-Latitude Region. Geophysical Research Letters 2023, 50, e2023GL103305, [arXiv:physics.space- ph/2307.05687]. https://doi.org/10.1029/2023GL103305
2023 arXiv
-
[29]
The International Reference Ionosphere Model: A Review and Description of an Ionospheric Benchmark
Bilitza, D.; Pezzopane, M.; Truhlik, V .; Altadill, D.; Reinisch, B.W.; Pignalberi, A. The International Reference Ionosphere Model: A Review and Description of an Ionospheric Benchmark. Reviews of Geophysics 2022, 60, e2022RG000792. https://doi.org/10.1029/2022RG000792
2022 doi
-
[30]
Improvement of global ionospheric VTEC maps by using kriging interpolation technique
Orús, R.; Hernández-Pajares, M.; Juan, J.M.; Sanz, J. Improvement of global ionospheric VTEC maps by using kriging interpolation technique. Journal of Atmospheric and Solar-Terrestrial Physics 2005, 67, 1598–1609. https://doi.org/10.1016/j.jastp.2005.07.017
2005 doi
-
[31]
The IGS VTEC maps: a reliable source of ionospheric information since 1998
Hernández-Pajares, M.; Juan, J.M.; Sanz, J.; Orus, R.; Garcia-Rigo, A.; Feltens, J.; Komjathy, A.; Schaer, S.C.; Krankowski, A. The IGS VTEC maps: a reliable source of ionospheric information since 1998. Journal of Geodesy 2009, 83, 263–275. https://doi.org/10.1007/s00190-008-0266-1
1998 doi
-
[32]
Simultaneous radio interferometer and optical observations of ionospheric structure at the Very Large Array
Coker, C.; Thonnard, S.E.; Dymond, K.F.; Lazio, T.J.W.; Makela, J.J.; Loughmiller, P .J. Simultaneous radio interferometer and optical observations of ionospheric structure at the Very Large Array. Radio Science 2009, 44
2009
-
[33]
Scintillation noise in widefield radio interferometry
Vedantham, H.K.; Koopmans, L.V .E. Scintillation noise in widefield radio interferometry. MNRAS 2015, 453, 925–938, [arXiv:astro-ph.IM/1412.1420]. https://doi.org/10.1093/mnras/stv1594
2015 arXiv
-
[34]
Medium scale irregularities in the ionospheric electron content
Vanvelthoven, P .F.J. Medium scale irregularities in the ionospheric electron content. PhD thesis, Technical University of Eindhoven, Netherlands, 1990
1990
-
[35]
Real-time imaging of density ducts between the plasmasphere and ionosphere
Loi, S.T.; Murphy, T.; Cairns, I.H.; Menk, F.W.; Waters, C.L.; Erickson, P .J.; Trott, C.M.; Hurley-Walker, N.; Morgan, J.; Lenc, E.; et al. Real-time imaging of density ducts between the plasmasphere and ionosphere. Geophysical Research Letters 2015, 42, 3707–3714, [arXiv:phy...
2015 arXiv
-
[36]
A study of precursors to equatorial spread F using the Giant Meterwave Radio Telescope
DasGupta, A.; Paul, A.; Ray, S.; Das, A.; Ananthakrishnan, S. A study of precursors to equatorial spread F using the Giant Meterwave Radio Telescope. Radio Science 2008, 43, RS5002. https://doi.org/10.1029/2007 RS003667
2008 doi
-
[37]
Systematic effects in LOFAR data: A unified calibration strategy
de Gasperin, F.; Dijkema, T.J.; Drabent, A.; Mevius, M.; Rafferty, D.; van Weeren, R.; Brüggen, M.; Callingham, J.R.; Emig, K.L.; Heald, G.; et al. Systematic effects in LOFAR data: A unified calibration strategy. A & A 2019, 622, A5, [arXiv:astro-ph.IM/1811.07954]. https://do...
2019 arXiv
Reviewed August 6, 2026 · model on record in the stance chip above.
Discussion (0). Continue with ORCID to comment.