REVIEW 4 major objections 5 minor 34 references
Efficient Motion Sickness Assessment: Recreation of On-Road Driving on a Compact Test Track
T0 review · 4 major / 5 minor · reviewed 2026-08-11 · deepseek-v4-flash
Pith's one-line read A compact 70 m by 175 m test track can reproduce on-road motion sickness: in 47 participants, a model predictive controller that matches recorded longitudinal and lateral accelerations produced statistically indistinguishable subjective…
desk verdict A genuinely useful MPC-based method for recreating on-road motion sickness on a compact track, backed by a serious human experiment, but the 'no difference' claim rests on statistical tests that do not survive scrutiny. read the letter →
The pith
A machine-rendered reading of the paper's core claim, the machinery that carries it, and where it could break.
The reading
What carries the argument
The load-bearing object is an offline model predictive controller built on a linear bicycle model, using steering rate and longitudinal jerk as control inputs. The cost function penalizes squared errors between the generated and recorded longitudinal and lateral accelerations, position offsets from the track centre, and control effort, with adaptive weights that reduce acceleration-tracking priority near the track edges and pull the vehicle back toward the centre. Standstill events from the on-road drive are inserted manually by reconstructing constant-acceleration deceleration and acceleration phases. The objective comparison relies on ISO-2631 frequency-weighted motion sickness dose values computed for the tracked axes.
What would settle it
Run the same within-subject protocol on a deliberately rough track with speed bumps, an undulating surface, or a slalom so that vertical, roll, and pitch accelerations differ strongly between track and road while matched longitudinal and lateral MSDV remain similar; if mean MISC or the proportion reaching high MISC differs significantly between conditions, the assumption that only longitudinal and lateral acceleration drive sickness is false.
Extended reading notes
Core claim
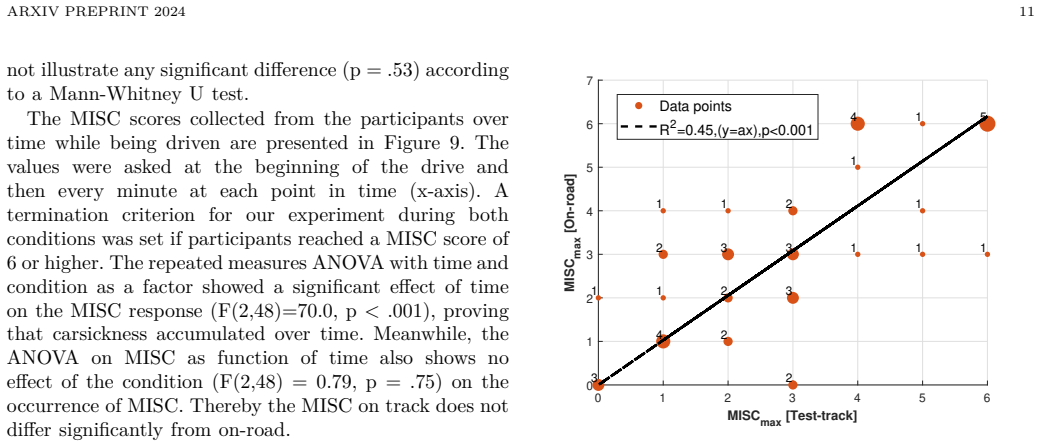
The central discovery is that subjective motion sickness, not just objective acceleration statistics, transfers from road to track when the replanned trajectory matches the on-road longitudinal and lateral accelerations. Across 47 participants, repeated-measures ANOVA found that time significantly increased MISC but condition did not (F(2,48)=0.79, p=0.75), and individual maximum MISC values correlated between conditions with fitted slope 1.03 and adjusted R-squared 0.45 (p<0.001). The objective motion sickness dose value was about 12% lower on the track (p<0.001), and unmodeled axes differed substantially (up to 71% for vertical MSDV and about 47 to 62% for roll and pitch), yet these differences did not translate into a detectable subjective difference at the low-to-moderate sickness levels studied. The authors conclude that a compact track can stand in for on-road driving in motion sickness studies.
Load-bearing premise
The load-bearing assumption is that vertical, roll, pitch, and yaw accelerations contribute so little to motion sickness that matching only longitudinal and lateral accelerations is enough, even though the paper's own measured data show vertical MSDV differs by about 71% and roll and pitch by about 47 to 62% between track and road.
Editorial extensions
If this is right
- Motion sickness studies can move from public roads to small controlled areas, removing traffic risk and day-to-day variability.
- Because the applied track motion is essentially identical for every participant, within- and between-group comparisons become cleaner and more reproducible.
- The reference can be any recorded on-road drive, so the method can replay different road types or candidate automated-vehicle control strategies without building a full route.
- The roughly 12% lower objective MSDV on the track is a measurable offset; if subjective equivalence holds across scenarios, it can be accounted for in dose-based protocols.
- Early-stage prototype vehicles that lack public-road approval could still be tested for motion comfort during development on a compact track.
Reading between the lines
- The paper only establishes equivalence for low-to-moderate sickness levels (mean maximum MISC around 2.3 to 2.7 with termination at 6), so extrapolating to severe nausea is an untested extension.
- The same MPC replay idea could be extended to include vertical, roll, and pitch reference accelerations if the track and vehicle actuation allow, which would directly test whether the unmodeled axes become important on rougher roads or at higher sickness levels.
- The manual standstill insertion is a practical workaround; automating stop-and-go events would make the method a turnkey tool for urban driving scenarios that involve frequent stops.
- The moderate individual-level correlation (R-squared 0.45) suggests the method reproduces group averages and extreme responses well, but researchers should still expect residual individual variability from personality or environment, as the authors themselves flag.
Signed reviews
Editorial analysis
A structured set of objections, weighed in public.
Referee Report
Summary. The paper proposes an MPC-based motion planner that maps on-road longitudinal and lateral acceleration profiles onto a compact 70 m by 175 m test track, and validates the approach with a 47-participant within-subject experiment comparing subjective motion sickness (MISC) between an on-road drive and a test-track drive. The authors report that the test-track motion closely matches the reference accelerations, that objective MSDV is about 12% lower on the track, and that the subjective MISC response shows no statistically significant difference between conditions. They conclude that the method enables reproducible, safer motion sickness experiments for automated vehicles.
Significance. If the statistical support were solid, this would be a practically useful contribution: it offers a way to run controlled, reproducible motion sickness studies on a small test track instead of public roads, which is valuable for AV development. The experimental design is a genuine strength: 47 participants, within-subject cross-randomized design, a controlled non-driving task, and both objective and subjective outcome measures. The MPC formulation is also not circular in the load-bearing sense, because the human MISC data were not used to tune the controller weights. However, the central claim of "no difference" between conditions currently rests on a null result obtained with inappropriate statistical tests and without an equivalence framework, so the main conclusion is not yet established.
major comments (4)
- [Section VI.B, MISCmax comparison] The maximum-MISC comparison uses a Mann-Whitney U test on paired within-subject data. Each participant contributes one observation per condition, so the two observations are dependent; the independence assumption of the Mann-Whitney U test is violated, and the test has reduced power to detect a within-subject difference. The reported p=0.53 is therefore not a valid basis for the claim of no difference. A paired test (e.g., Wilcoxon signed-rank test) or a mixed-effects model with participant as a random effect should be reported instead.
- [Section VI.B, repeated-measures ANOVA] The reported F(2,48)=70.0 for time and F(2,48)=0.79 for condition are not consistent with a simple 47-participant, two-condition repeated-measures design; the degrees of freedom suggest a collapsed or aggregated analysis, but the text does not state how time points were binned, how missing or aborted trials (MISC=6 terminations) were handled, whether sphericity corrections were applied, or whether the ANOVA was actually performed on condition means across participants. Please specify the exact model, the factors, and the df, and verify that the reported statistics correspond to the design.
- [Section VI.B and Section VII (Limitations)] The central conclusion "no difference" is an equivalence claim, but no equivalence margin, confidence interval, or power analysis is provided. The descriptive statistics show a 15% lower mean MISCmax on the track (2.69 vs. 2.29) and a 12% lower objective MSDV that is significant (p<.001, Figure 8). A non-significant p-value cannot support equivalence; the Limitations section repeats the assertion that "there was no significant difference" without addressing this. Please report a pre-specified equivalence bound and a confidence interval for the within-subject difference, or reframe the claim as "no detected difference" with appropriate caution.
- [Section V.C / Table III and Figure 8] The paper states in Section VI.A that the contribution of vertical, yaw, roll, and pitch to the total MSDV is less than 10%, which is consistent with Table III and reduces the concern about unmodeled motion channels. However, the same section describes the track motion as "perfectly aligned" with the generated path while also reporting a significant 12% reduction in MSDV relative to on-road. These statements should be reconciled, and the 95% confidence interval for the objective MSDV difference should be reported so the reader can judge whether the objective reduction is compatible with the subjective null result.
minor comments (5)
- [Equation (10)] In the cost function, the terms wdδ dδ_k and wdax da_x,k appear without squares; if these are intended as L1 penalties on control rates, please state so, and if they are intended as quadratic penalties, the squares appear to be missing.
- [Equations (14)-(17)] The notation for the adaptive weights is inconsistent: Eq. (14) defines i = {X,Y}, but Eq. (15) uses j = {x,y}; please harmonize the indices and define i_norm explicitly.
- [Section IV.E and Section VI.B] The procedure says the NDRT video contained 20 countable events, but Section VI.B reports counts "out of 16 in total." Please correct this inconsistency.
- [Figure 10 and surrounding text] The individual-level correspondence is described as "good," but the fit has adjusted R²=0.45 with y=a*x; this is a modest correlation. Please temper the wording or add additional agreement metrics (e.g., limits of agreement or ICC).
- [Section V.A / Figure 4] The on-road path in Figure 4a is plotted over a much larger coordinate range than the test-track path in Figure 4b; this is understandable, but the figures would benefit from a shared scale or an explicit note about the different extents.
Circularity Check
No significant circularity: the central claim rests on an independent subjective human experiment, and the objective MPC match is an explicit fit rather than a prediction.
full rationale
The paper's core claim is that a compact test track can reproduce on-road motion sickness exposure, and this is validated by a 47-participant within-subject experiment comparing subjective MISC scores between on-road and test-track conditions. That human comparison is independent of the MPC tuning: no participant responses were used to fit weights or path, and the subjective result is not derived from the accelerations by construction. The objective MSDV comparisons in Section V.C use the same longitudinal and lateral acceleration signals that the MPC cost function in Eq. (10) is designed to track, so those similarities are expected fitting outcomes, not independent predictions. However, the paper does not misrepresent them as predictions; it reports them as tracking performance and explicitly notes residual differences (e.g., 33% in MSDVx). The only self-citations with potentially load-bearing roles are [21] and [32], used to justify excluding vertical, roll, and pitch channels from the MPC; this choice is also supported by the paper's own Table III, which shows these channels contribute less than 10% to MSDVt. Thus the self-citations are not the sole or decisive support. No uniqueness theorems are imported, no known result is renamed, and no fitted parameter is presented as a prediction. The statistical weaknesses of the subjective null result (Mann-Whitney U on paired data, implausible ANOVA degrees of freedom, lack of an equivalence test) are serious correctness and rigor concerns, but they do not constitute circular reasoning. Accordingly, no specific circular step can be exhibited, and the paper's central validation remains externally grounded in human responses.
Assumptions & free parameters
free parameters (6)
- wc,ax =
300
- wc,ay =
500
- wc,X =
0.05
- wc,Y =
0.25
- wdδ =
0.2
- wdax =
0.2
assumptions (3)
- standard math Linear bicycle model and linear tire forces (Eq. 3-6) are valid for the speed range of the test track.
- domain assumption Motion sickness is primarily driven by low-frequency longitudinal and lateral accelerations; vertical, roll, pitch, and yaw contribute less than 10% to total MSDV.
- domain assumption The NDRT video-watching task ensures participants have eyes off the road and similar visual conditions in both environments.
Cite this review
Pith. "Pith review of Efficient Motion Sickness Assessment: Recreation of On-Road Driving on a Compact Test Track." pith.science (2026). https://pith.science/paper/GTFVYNDU
@misc{pith2026241214982,
  author       = {Pith},
  title        = {Pith review of: Efficient Motion Sickness Assessment: Recreation of On-Road Driving on a Compact Test Track},
  year         = {2026},
  howpublished = {\url{https://pith.science/paper/GTFVYNDU}},
  note         = {Machine review of arXiv:2412.14982}
}
read the original abstract
The ability to engage in other activities during the ride is considered by consumers as one of the key reasons for the adoption of automated vehicles. However, engagement in non-driving activities will provoke occupants' motion sickness, deteriorating their overall comfort and thereby risking acceptance of automated driving. Therefore, it is critical to extend our understanding of motion sickness and unravel the modulating factors that affect it through experiments with participants. Currently, most experiments are conducted on public roads (realistic but not reproducible) or test tracks (feasible with prototype automated vehicles). This research study develops a method to design an optimal path and speed reference to efficiently replicate on-road motion sickness exposure on a small test track. The method uses model predictive control to replicate the longitudinal and lateral accelerations collected from on-road drives on a test track of 70 m by 175 m. A within-subject experiment (47 participants) was conducted comparing the occupants' motion sickness occurrence in test-track and on-road conditions, with the conditions being cross-randomized. The results illustrate no difference and no effect of the condition on the occurrence of the average motion sickness across the participants. Meanwhile, there is an overall correspondence of individual sickness levels between on-road and test-track. This paves the path for the employment of our method for a simpler, safer and more replicable assessment of motion sickness.
Figures


Figures from the paper (7 more)



Reference graph
Works this paper leans on
-
[1]
M. Kyriakidis, R. Happee, and J. C. de Winter, “Public opinion on automated driving: Results of an international questionnaire among 5000 respondents,” Transportation Research Part F: Traffic Psychology and Behaviour, vol. 32, pp. 127–140, 2015
work page 2015
-
[2]
What impressions do users have after a ride in an automated shuttle? an interview study,
S. Nordhoff, J. de Winter, W. Payre, B. Van Arem, and R. Happee, “What impressions do users have after a ride in an automated shuttle? an interview study,” Transportation Research Part F: Traffic Psychology and Behaviour, vol. 63, pp. 252–269, 2019
work page 2019
-
[3]
C. Diels and J. E. Bos, “Self-driving carsickness,” Applied Ergonomics, vol. 53, pp. 374–382, 2016
work page 2016
-
[4]
An international survey on the incidence and modulating factors of carsickness,
E. A. Schmidt, O. X. Kuiper, S. Wolter, C. Diels, and J. E. Bos, “An international survey on the incidence and modulating factors of carsickness,” Transportation research part F: traffic psychology and behaviour, vol. 71, pp. 76–87, 2020
work page 2020
-
[5]
Occupants’ comfort: what about human body dynamics in road and rail vehicles?
G. Papaioannou, C. Shen, M. Rothhämel, and R. Happee, “Occupants’ comfort: what about human body dynamics in road and rail vehicles?” Vehicle System Dynamics, vol. 63, no. 7, pp. 1241–1299, 2025
work page 2025
-
[6]
Motion sickness adaptation: a neural mismatch model,
J. T. Reason, “Motion sickness adaptation: a neural mismatch model,” Journal of the Royal Society of Medicine, vol. 71, no. 11, pp. 819–829, 1978. [Online]. A vailable: https://pubmed.ncbi.nlm.nih.gov/731645 https://www.ncbi.nlm.nih.gov/pmc/articles/PMC1436193/
work page 1978
-
[7]
Will visual cues help alleviating motion sickness in automated cars? a review article,
W. Emond, D. Bohrmann, and M. Zare, “Will visual cues help alleviating motion sickness in automated cars? a review article,” Ergonomics, vol. 67, no. 6, pp. 772–800, 2024
work page 2024
-
[8]
I. Yunus, G. Papaioannou, J. Jerrelind, and L. Drugge, “A re- view of vehicle dynamics and control approaches for mitigating motion sickness in autonomous vehicles,” IEEE Access, 2025
work page 2025
Show all 34 references
-
[9]
Motion sickness in passenger vehicles during test track operations,
M. L. Jones, V. C. Le, S. M. Ebert, K. H. Sienko, M. P. Reed, and J. R. Sayer, “Motion sickness in passenger vehicles during test track operations,” Ergonomics, vol. 62, no. 10, pp. 1357– 1371, 2019
2019
-
[10]
Influence of dynamic stimulation, visual perception and in- dividual susceptibility to car sickness during controlled stop- and-go driving,
A. Brietzke, R. Pham Xuan, A. Dettmann, and A. C. Bullinger, “Influence of dynamic stimulation, visual perception and in- dividual susceptibility to car sickness during controlled stop- and-go driving,” Forschung Im Ingenieurwesen - Engineering Research, vol. 85, no. 2, pp. 51...
2021
-
[11]
Motion planning of self-driving vehicles for motion sickness minimisa- tion,
Z. Htike, G. Papaioannou, E. Velenis, and S. Longo, “Motion planning of self-driving vehicles for motion sickness minimisa- tion,” in European Control Conference, 2020, pp. 1719–1724
2020
-
[12]
Fundamentals of motion planning for mitigating motion sick- ness in automated vehicles,
Z. Htike, G. Papaioannou, E. Siampis, E. Velenis, and S. Longo, “Fundamentals of motion planning for mitigating motion sick- ness in automated vehicles,” IEEE Transactions on Vehicular Technology, vol. 71, no. 3, pp. 2375–2384, 2021
2021
-
[13]
Mechanical vibration and shock— evaluation of human exposure to whole body vibration. part 1: General requirements,
I. S. Organization, “Mechanical vibration and shock— evaluation of human exposure to whole body vibration. part 1: General requirements,” International Standard ISO 2631–1, 1997
1997
-
[14]
Multi-criteria evaluation for sorting motion planner alternatives,
G. Papaioannou, Z. Htike, C. Lin, E. Siampis, S. Longo, and E. Velenis, “Multi-criteria evaluation for sorting motion planner alternatives,” Sensors, vol. 22, no. 14, p. 5177, 2022
2022
-
[15]
Gpops-ii: A matlab software for solving multiple-phase optimal control problems using hp- adaptive gaussian quadrature collocation methods and sparse nonlinear programming,
M. A. Patterson and A. V. Rao, “Gpops-ii: A matlab software for solving multiple-phase optimal control problems using hp- adaptive gaussian quadrature collocation methods and sparse nonlinear programming,” ACM Transactions on Mathematical Software, vol. 41, no. 1, pp. 1–37, 2014
2014
-
[16]
Forces nlp: an efficient implementation of interior-point methods for multi- stage nonlinear nonconvex programs,
A. Zanelli, A. Domahidi, J. Jerez, and M. Morari, “Forces nlp: an efficient implementation of interior-point methods for multi- stage nonlinear nonconvex programs,” International Journal of Control, pp. 1–17, 2017
2017
-
[17]
Optimal trajectory planning for mitigated motion sick- ness: Simulator study assessment,
V. Jain, S. S. Kumar, G. Papaioannou, R. Happee, and B. Shy- rokau, “Optimal trajectory planning for mitigated motion sick- ness: Simulator study assessment,” Transactions on Intelligent Transportation Systems, vol. 24, pp. 10 653–10 664, 2023
2023
-
[18]
Mitigating motion sickness in automated vehicles with frequency-shaping approach to motion planning,
D. Li and J. Hu, “Mitigating motion sickness in automated vehicles with frequency-shaping approach to motion planning,” IEEE Robotics and Automation Letters, vol. 6, no. 4, pp. 7714– 7720, 2021
2021
-
[19]
Mitigating mo- tion sickness with optimization-based motion planning,
Y. Zheng, B. Shyrokau, and T. Keviczky, “Mitigating mo- tion sickness with optimization-based motion planning,” IEEE Transactions on Intelligent Vehicles, vol. 9, no. 1, pp. 2553–2563, 2024
2024
-
[20]
Comfort-oriented mo- tion planning for automated vehicles using deep reinforcement learning,
N. Rajesh, Y. Zheng, and B. Shyrokau, “Comfort-oriented mo- tion planning for automated vehicles using deep reinforcement learning,” IEEE Open Journal of Intelligent Transportation Systems, vol. 4, pp. 348–359, 2023
2023
-
[21]
The impact of body and head dynamics on motion comfort assessment,
G. Papaioannou, R. Desai, and R. Happee, “The impact of body and head dynamics on motion comfort assessment,” arXiv preprint arXiv:2307.03608, 2023
2023 arXiv
-
[22]
Ekastos: Individ- ualized human body model for seated occupants in automated vehicles,
C. Messiou, R. Happee, and G. Papaioannou, “Ekastos: Individ- ualized human body model for seated occupants in automated vehicles,” Preprint, 2025
2025
-
[23]
Trajectory planning considering motion sickness and head movements,
A. Steinke and U. Konigorski, “Trajectory planning considering motion sickness and head movements,” IF AC-PapersOnLine, vol. 55, no. 14, pp. 113–119, 2022. ARXIV PREPRINT 2024 13
2022
-
[24]
State of the art and simulation of motion cueing algorithms for a six degree of freedom driving simulator,
K. Stahl, G. Abdulsamad, K.-D. Leimbach, and Y. A. Vershinin, “State of the art and simulation of motion cueing algorithms for a six degree of freedom driving simulator,” in Int. Conference on Intelligent Transportation Systems, 2014, pp. 537–541
2014
-
[25]
Validation of a moving base driving simulator for motion sickness research,
T. M. Talsma, O. Hassanain, R. Happee, and K. N. de Winkel, “Validation of a moving base driving simulator for motion sickness research,” Applied Ergonomics, vol. 106, p. 103897, 2023
2023
-
[26]
Verifying motion sickness induction in automated vehicles using motion-based driving simulators,
A. Dam, C. Sanford, and M. Jeon, “Verifying motion sickness induction in automated vehicles using motion-based driving simulators,” International Journal of Human–Computer Inter- action, pp. 1–19, 2024
2024
-
[27]
Computationally-efficient motion cueing algorithm via model predictive control,
A. Chadha, V. Jain, A. M. R. Lazcano, and B. Shyrokau, “Computationally-efficient motion cueing algorithm via model predictive control,” in IEEE Int. Conference on Mechatronics, 2023, pp. 1–6
2023
-
[28]
Experimental validation of a kinematic bicycle model predictive control with lateral acceleration consideration,
J. A. Matute, M. Marcano, S. Diaz, and J. Perez, “Experimental validation of a kinematic bicycle model predictive control with lateral acceleration consideration,” IF AC PapersOnLine, vol. 52, no. 8, pp. 289–294, 2019
2019
-
[29]
Evaluation multimodaler physiologischer merkmale zur objektiven detektion von kinetose im pkw,
R. Pham Xuan, “Evaluation multimodaler physiologischer merkmale zur objektiven detektion von kinetose im pkw,” Ph.D. dissertation, Technische Universität Berlin, 2023
2023
-
[30]
How feelings of unpleasantness develop during the progression of motion sickness symptoms,
A. Reuten, S. Nooij, J. Bos, and J. Smeets, “How feelings of unpleasantness develop during the progression of motion sickness symptoms,” Experimental Brain Research, vol. 239, no. 12, pp. 3615–3624, 2021
2021
-
[31]
A study of carsickness of rear-seat passengers due to acceleration and deceleration when watch- ing an in-vehicle display,
K. Kato and S. Kitazaki, “A study of carsickness of rear-seat passengers due to acceleration and deceleration when watch- ing an in-vehicle display,” Review of automotive engineering, vol. 27, no. 3, p. 465, 2006
2006
-
[32]
Motion cueing algorithm for effective motion perception: A frequency- splitting mpc approach,
V. Jain, A. Lazcano, R. Happee, and B. Shyrokau, “Motion cueing algorithm for effective motion perception: A frequency- splitting mpc approach,” arXiv preprint arXiv:2309.01689, 2023
2023 arXiv
-
[33]
Does the visual input matter? influence of non-driving related tasks on car sickness in an open road setting,
M. Metzulat, B. Metz, A. Landau, A. Neukum, and W. Kunde, “Does the visual input matter? influence of non-driving related tasks on car sickness in an open road setting,” Transportation Research Part F: Traffic Psychology and Behaviour, vol. 104, pp. 234–248, 2024
2024
-
[34]
Effect of roll oscillation fre- quency on motion sickness,
H. V. Howarth and M. J. Griffin, “Effect of roll oscillation fre- quency on motion sickness,” A viation, space, and environmental medicine, vol. 74, no. 4, pp. 326–331, 2003. Hüseyin Harmankaya received a MSc degree, 2023, in Robotics from Delft University of Technology. He joi...
2003
Reviewed August 11, 2026 · model on record in the stance chip above.
Discussion (0). Continue with ORCID to comment.