REVIEW 4 major objections 5 minor 39 references
Cross-Sequence Semi-Supervised Learning for Multi-Parametric MRI-Based Visual Pathway Delineation
T0 review · 4 major / 5 minor · reviewed 2026-08-07 · deepseek-v4-flash
Pith's one-line read A semi-supervised framework that splits T1 and FA MRI scans into shared and sequence-specific features delineates the visual pathway more accurately than seven existing methods, reaching a Dice score of 0.85 on HCP with only 16 labeled…
desk verdict Plausible new combination of disentangled sparse coding and mean-teacher consistency for visual pathway segmentation, but the statistical evidence is too thin to support the significance claims as written. read the letter →
The pith
A machine-rendered reading of the paper's core claim, the machinery that carries it, and where it could break.
The reading
What carries the argument
The load-bearing machinery is the correlation-constrained feature decomposition (CFD), which models each MRI sequence $x$ as a sum of a non-unique component $c$ and a convolution of sequence-specific filters with sparse feature maps (Eqs. 1 and 2). The unique feature maps are predicted by a learned convolutional sparse coding network and serve as inputs to the final delineation branch, while the non-unique components align the two sequences during training. A decomposition loss $L_{dcp}$ drives the Pearson correlation between non-unique features up and between unique features down. The second moving part, consistency-based sample enhancement (CSE), uses a teacher model (an exponential moving average of the student) and $M$ noise-augmented passes; unlabeled samples whose prediction variance exceeds a threshold are excluded from the unsupervised consistency loss.
What would settle it
Quantify the reconstruction residual of Eqs. (1) and (2) on held-out T1 and FA images: if the residual is large relative to the signal, or if a plain two-stream U-Net receiving the same multi-parametric input achieves the same Dice score at the same label budgets, the central claim that the decomposition drives the improvement would be unsupported.
Extended reading notes
Core claim
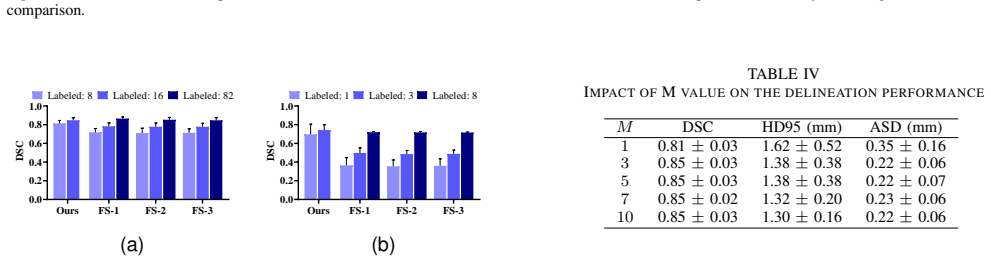
The central claim is that decomposing the two MRI sequences, T1-weighted and fractional anisotropy, into unique and non-unique components, and feeding only the unique features into the final segmentation stage, lets a mean-teacher semi-supervised network delineate the visual pathway from very few labeled scans. The decomposition is enforced by a loss that maximizes the Pearson correlation of non-unique features across sequences and minimizes the correlation of unique features, while the CSE module discards unlabeled samples whose student and teacher predictions are inconsistent across multiple noise-augmented views. The paper reports a DSC of 0.85 on the HCP test set with 16 labels against 0.79 for the best semi-supervised baseline (UG-MCL), 0.81 with 8 labels, 0.74 on the MDM dataset with 3 labels, and up to a 10-point DSC improvement on the multimodal brain MRI dataset with 2 labeled subjects.
Load-bearing premise
The framework assumes each MRI sequence is exactly a sum of a shared non-unique component and a convolution of learned unique filters with sparse maps; if that decomposition is not faithful, the claimed benefit of separating features could be an artifact of the loss rather than real structure in the data.
Editorial extensions
If this is right
- With 16 labeled HCP subjects, the method reaches a Dice score of 0.85, a 6-point gain over UG-MCL, the best semi-supervised baseline.
- With only 1 labeled MDM subject, the method reaches 0.70 DSC, a 9-point gain over UG-MCL and a 36-point gain over the supervised baseline.
- In low-label regimes the method matches or exceeds fully supervised models: on MDM with 3 labels it reaches 0.74 DSC versus 0.72 for FS-1 trained on all 8 labeled subjects.
- Ablations attribute a 3-point DSC gain on MDM to the CSE module and a 1-point gain on both datasets to the decomposition loss.
- On the multimodal brain MRI dataset, the method improves DSC by up to 10 points over the six compared semi-supervised methods using only 2 labeled subjects.
Reading between the lines
- The decomposition ansatz of Eqs. (1) and (2) is never validated by measuring the reconstruction residual on held-out images, so a direct test would be to quantify that residual and check whether it correlates with segmentation accuracy.
- The method's reliance on paired T1 and FA images may transfer to other multi-parametric MRI combinations, but the paper's own comparison shows T1+FA clearly beats T1+T2 or T2+FA, so sequence choice is load-bearing.
- The CSE module selects consistent samples with a hard threshold of 0.05; a softer weighting by the inconsistency score could extract more signal from the unlabeled pool without risking overconfidence, which the paper does not explore.
- If the CFD decomposition genuinely separates shared from sequence-specific structure, the unique features could serve downstream tasks beyond binary delineation, such as tractography initialization or quantifying structural changes in visual disorders.
Signed reviews
Editorial analysis
A structured set of objections, weighed in public.
Referee Report
Summary. The paper proposes a semi-supervised framework for delineating the visual pathway (VP) from multi-parametric MRI (T1-weighted and FA images). The method has two main components: a correlation-constrained feature decomposition (CFD) module, which decomposes each sequence into unique and non-unique features using multi-parametric convolutional sparse coding, and a consistency-based sample enhancement (CSE) module, which selects reliable pseudo-labels from unlabeled data within a mean-teacher framework. The framework is evaluated on the HCP dataset, an MDM dataset, and a multimodality brain MRI dataset. The authors report DSC improvements over six semi-supervised baselines and comparable or better performance than fully supervised methods in low-label regimes.
Significance. If the reported results are reliable, the work would be a useful contribution to annotation-efficient VP delineation and to the broader literature on semi-supervised multi-modal medical image segmentation. The CFD idea of explicitly separating shared and unique sequence features is interesting and the use of a consistency-based pseudo-label selection mechanism is well motivated. The paper also includes comparisons with several recent SSL methods, ablations of the main components, and a model-complexity analysis. However, the current evidence for the central claim of 'significant enhancements' is weak because the statistical analysis is invalid for the smallest test sets, hyperparameters appear to be tuned on the same test sets, and an important internal inconsistency in the reported hyperparameters is not resolved.
major comments (4)
- [IV.A.2 / Fig. 7b] The statistical significance claim for the MDM and multimodality datasets is not supported by the reported procedure. Both test sets contain only 2 subjects, so a paired t-test has 1 degree of freedom and requires |t| > 12.71 for two-tailed p < 0.05. The reported DSC differences (e.g., 0.70 vs 0.61 in Table III) cannot produce such a p-value unless the within-pair variance is essentially zero. The statement that 'we run two Monte Carlo simulations before computing the paired t-test' (Fig. 7b and Fig. 12 notes) is not accompanied by any description of what is simulated, what null distribution is used, or how the p-values are derived. Without per-subject scores and a valid inference procedure, the observed margins are point estimates on two subjects and cannot support the paper's significance claim.
- [IV.B / Tables IV-V / Fig. 8] The hyperparameters (M, thres, alpha, beta) appear to be selected by evaluating performance on the same test sets used to report the main results. Section IV.B describes varying M and thres while reporting DSC, HD95, and ASD on what appears to be the test set, and Fig. 8 shows alpha/beta selection using DSC and ASD on the MDM dataset. No validation split is described anywhere. This creates a risk of test-set overfitting and makes the reported gains over baselines difficult to interpret. The authors should either introduce a separate validation set or use nested cross-validation for hyperparameter selection.
- [IV.B.1 vs III.B.2] There is an internal inconsistency in the reported hyperparameters. Section III.B.2 states 'We set alpha = 10, beta = 1, M = 3, and threshold value thres = 0.05 as optimal values', but Section IV.B.1 states 'To obtain the optimal values of M, we fix alpha = 1, beta = 1, and thres = 0.05'. Likewise, Tables IV and V, which study M and thres, appear to use alpha = 1, while the main results and the component ablation (Table VI) use alpha = 10. The authors need to clarify which hyperparameter values were used for each reported result, since this affects the validity of the ablation conclusions.
- [II.A / Eqs. (1)-(2)] The central assumption of the CFD module is that each MRI sequence can be decomposed exactly into a non-unique component plus the convolution of learned unique filters and sparse feature maps. This assumption is never validated: the reconstruction residual of Eqs. (1)-(2) is not reported, and the t-SNE visualization in Fig. 1 is qualitative. If the decomposition is not faithful, the claimed benefit of separating unique and non-unique features could be an artifact of the decomposition loss rather than a genuine property of the data. The authors should report the reconstruction error of the CFD module and ideally compare the learned unique features against an alternative decomposition or a simple concatenation baseline with the same network.
minor comments (5)
- [III.A / Abstract] The abstract says 'two public datasets, and one in-house Multi-Shell Diffusion MRI (MDM) dataset', but Section III.A states 'Two datasets were used in this study, including the Human Connectome Project (HCP) dataset, the Multi-shell Diffusion MRI (MDM) dataset, and the multimodal brain MRI dataset'. This is a three-dataset evaluation, and the MDM dataset appears to be a public traveling-subject dataset (reference [23]) rather than in-house. Please correct the wording.
- [II.A / Eq. (7)] The decomposition loss in Eq. (7) is written as PCC(f_T1, f_FA)^2 / (epsilon + PCC(c_T1, c_FA)). Minimizing this loss reduces the unique-feature correlation and, through the denominator, also rewards a larger non-unique correlation, but the sign conventions and the role of epsilon are not explained. Please clarify the intended optimization direction and why a negative PCC in the denominator is not problematic.
- [IV.A.3 / Table III] The text states that on the MDM dataset the method showed 'comparable performance over FS-1, FS-2, and FS-3', but Table III reports only FS-1. FS-2 and FS-3 appear in Fig. 5 but not in Table III; please include all three fully supervised baselines in the corresponding table for reproducibility.
- [Table II / FS-1 row] The HD95 value for FS-1 in Table II is reported as 1.25 ± 0.00, which is suspicious for a standard deviation and suggests either a rounding artifact or a measurement issue. Please double-check this entry and report the appropriate precision.
- [IV.B.3 / Equation (14)] Section IV.B.3 refers to a hyperparameter lambda_1 that is 'defined as a time-dependent Gaussian function', but this term does not appear in Eq. (14), which uses alpha, delta, and beta. Please align the notation between the text and the objective function.
Circularity Check
Minor internal feature-role circularity; the main benchmark claim is not circular.
-
self definitional
[Section II.A (Eq. 8) and Section IV.B.8 (Fig. 11)]
"The unique features fl T 1,i and fl F A,j are fed to the student model to calculate the supervised loss (Sec. II). 'After obtaining the unique features from each MRI sequence, the non-unique features cl T 1,i and cl F A,j ... are obtained by subtracting the unique features from the original images' (Sec. II.A). 'The results presented in Fig. 11 clearly demonstrates that utilizing only unique features in the final stages of the network enhances the accuracy of delineating the visual pathway structure, specifically the optic nerve, yielding a well-defined boundary' (Sec. IV.B.8)."
The supervised loss Lsup (Eq. 8) is defined on unique features only, so the student network is optimized to make unique features carry VP segmentation information. Non-unique features are defined as the residual and never receive Lsup. The Fig. 11 comparison and the t-SNE 'demonstration' in Fig. 1 therefore retest the training objective: unique features win because the segmentation loss was applied to them, not because the CFD decomposition independently discovered which signal is more useful. This is circular by construction for the feature-role claim, but it is not load-bearing for the paper's main empirical claim, which is a benchmarked comparison against external SSL methods on held-out test subjects.
full rationale
The paper's central claim—that the proposed semi-supervised framework outperforms seven state-of-the-art methods on HCP, MDM, and multimodal brain MRI—rests on external test-subject comparisons with fixed partitions and official implementations, so it does not reduce to a fitted parameter or to a self-citation. The self-citations to [25], [26], and [32] are to published dataset-generation, architecture, and baseline methods; none is used as an unverified uniqueness theorem or as the sole justification for the headline result. The only circular-by-construction element is the internal feature-role analysis: because Lsup (Eq. 8) trains the student only on unique features, and non-unique features are defined as the residual, the Fig. 11/t-SNE evidence that unique features are better for delineation restates the training objective rather than independently validating the decomposition. This does not affect the external comparisons. Separate statistical-correctness concerns are real but are not circularity: the paper itself admits 'the MDM test sample is too small, we run two Monte Carlo simulations before computing the paired t-test' (Fig. 7 note), and hyperparameters are tuned on the same test sets (Section IV.B), but these are validity issues, not derivation circularity.
Assumptions & free parameters
free parameters (5)
- alpha =
10
- beta =
1
- M (number of augmented versions) =
3
- CSE threshold =
0.05
- sigma (sparsity regularization) =
unreported
assumptions (6)
- domain assumption The visual pathway ground truth generated by the tractography pipeline in [25] is accurate.
- ad hoc to paper Equations (1)-(2) are valid: each MRI sequence is exactly the sum of non-unique features and a convolution of learned unique filters with sparse feature maps.
- ad hoc to paper Unique features alone suffice for accurate delineation, and non-unique features harm the final segmentation.
- ad hoc to paper The CSE threshold of 0.05 identifies reliable pseudo-labels across all datasets.
- domain assumption Two-tailed paired t-tests, after Monte Carlo simulations, remain valid with as few as two test subjects.
- standard math Mean-teacher EMA and consistency regularization improve semi-supervised segmentation.
Cite this review
Pith. "Pith review of Cross-Sequence Semi-Supervised Learning for Multi-Parametric MRI-Based Visual Pathway Delineation." pith.science (2026). https://pith.science/paper/GTMWQFEQ
@misc{pith2026250519733,
  author       = {Pith},
  title        = {Pith review of: Cross-Sequence Semi-Supervised Learning for Multi-Parametric MRI-Based Visual Pathway Delineation},
  year         = {2026},
  howpublished = {\url{https://pith.science/paper/GTMWQFEQ}},
  note         = {Machine review of arXiv:2505.19733}
}
read the original abstract
Accurately delineating the visual pathway (VP) is crucial for understanding the human visual system and diagnosing related disorders. Exploring multi-parametric MR imaging data has been identified as an important way to delineate VP. However, due to the complex cross-sequence relationships, existing methods cannot effectively model the complementary information from different MRI sequences. In addition, these existing methods heavily rely on large training data with labels, which is labor-intensive and time-consuming to obtain. In this work, we propose a novel semi-supervised multi-parametric feature decomposition framework for VP delineation. Specifically, a correlation-constrained feature decomposition (CFD) is designed to handle the complex cross-sequence relationships by capturing the unique characteristics of each MRI sequence and easing the multi-parametric information fusion process. Furthermore, a consistency-based sample enhancement (CSE) module is developed to address the limited labeled data issue, by generating and promoting meaningful edge information from unlabeled data. We validate our framework using two public datasets, and one in-house Multi-Shell Diffusion MRI (MDM) dataset. Experimental results demonstrate the superiority of our approach in terms of delineation performance when compared to seven state-of-the-art approaches.
Figures


Figures from the paper (8 more)



Reference graph
Works this paper leans on
-
[1]
Deep learning guided partitioned shape model for anterior visual pathway segmentation,
A. Mansoor, J. J. Cerrolaza, R. Idrees, E. Biggs, M. A. Alsharid, R. A. Avery, and M. G. Linguraru, “Deep learning guided partitioned shape model for anterior visual pathway segmentation,” IEEE transactions on medical imaging, vol. 35, no. 8, pp. 1856–1865, 2016
work page 2016
-
[2]
H. Takemura, S. Ogawa, A. A. Mezer, H. Horiguchi, A. Miyazaki, K. Matsumoto, K. Shikishima, T. Nakano, and Y . Masuda, “Diffusivity and quantitative t1 profile of human visual white matter tracts after retinal ganglion cell damage,” NeuroImage: Clinical, vol. 23, p. 101826, 2019
work page 2019
-
[3]
J. Ma, S. Su, S. Yue, Y . Zhao, Y . Li, X. Chen, H. Maet al., “Preoperative visualization of cranial nerves in skull base tumor surgery using diffusion tensor imaging technology,” Turk Neurosurg, vol. 26, no. 6, pp. 805–12, 2016
work page 2016
-
[4]
Two parallel stages deep learning network for anterior visual pathway segmentation,
S. Li, Z. Chen, W. Guo, Q. Zeng, and Y . Feng, “Two parallel stages deep learning network for anterior visual pathway segmentation,” in Computational Diffusion MRI: International MICCAI Workshop, Lima, Peru, October 2020. Springer, 2021, pp. 279–290
work page 2020
-
[5]
S. Liang, K.-H. Thung, D. Nie, Y . Zhang, and D. Shen, “Multi-view spatial aggregation framework for joint localization and segmentation of organs at risk in head and neck CT images,” IEEE Transactions on Medical Imaging, vol. 39, no. 9, pp. 2794–2805, 2020
work page 2020
-
[6]
B. Huang, Y . Ye, Z. Xu, Z. Cai, Y . He, Z. Zhong, L. Liu, X. Chen, H. Chen, and B. Huang, “3d lightweight network for simultaneous registration and segmentation of organs-at-risk in CT images of head and neck cancer,” IEEE Transactions on Medical Imaging, vol. 41, no. 4, pp. 951–964, 2021. JOURNAL OF LATEX CLASS FILES, VOL. 14, NO. 8, AUGUST 2025 12
work page 2021
-
[7]
Robust optic nerve segmentation on clinically acquired computed tomography,
R. L. Harrigan, S. Panda, A. J. Asman, K. M. Nelson, S. Chaganti, M. P. DeLisi, B. C. W. Yvernault, S. A. Smith, R. L. Galloway, and L. A. Mawn, “Robust optic nerve segmentation on clinically acquired computed tomography,” Journal of Medical Imaging , vol. 1, no. 3, p. 34006, 2014
work page 2014
-
[8]
Geometrical model-based segmentation of the organs of sight on CT images,
G. Bekes, E. M ´at´e, L. G. Ny ´ul, A. Kuba, and M. Fidrich, “Geometrical model-based segmentation of the organs of sight on CT images,” Medical physics, vol. 35, no. 2, pp. 735–743, 2008
work page 2008
Show all 39 references
-
[9]
An atlas-navigated optimal medial axis and deformable model algorithm (NOMAD) for the segmentation of the optic nerves and chiasm in MR and CT images,
J. H. Noble and B. M. Dawant, “An atlas-navigated optimal medial axis and deformable model algorithm (NOMAD) for the segmentation of the optic nerves and chiasm in MR and CT images,” Medical image analysis, vol. 15, no. 6, pp. 877–884, 2011
2011
-
[10]
Weighted partitioned active shape model for optic pathway segmentation in MRI,
X. Yang, J. Cerrolaza, C. Duan, Q. Zhao, J. Murnick, N. Safdar, R. Avery, and M. G. Linguraru, “Weighted partitioned active shape model for optic pathway segmentation in MRI,” in Clinical Image- Based Procedures. Translational Research in Medical Imaging: Third International W...
2014
-
[11]
Springer, 2014, pp. 109–117
2014
-
[12]
Interleaved 3D-CNN s for joint segmentation of small-volume struc- tures in head and neck CT images,
X. Ren, L. Xiang, D. Nie, Y . Shao, H. Zhang, D. Shen, and Q. Wang, “Interleaved 3D-CNN s for joint segmentation of small-volume struc- tures in head and neck CT images,” Medical physics, vol. 45, no. 5, pp. 2063–2075, 2018
2018
-
[13]
U-net: Convolutional networks for biomedical image segmentation,
O. Ronneberger, P. Fischer, and T. Brox, “U-net: Convolutional networks for biomedical image segmentation,” in Medical Image Computing and Computer-Assisted Intervention–MICCAI 2015: 18th International Conference, Munich, Germany, October 5-9, 2015, Proceedings, Part III
2015
-
[14]
Adaptive region-specific loss for improved medical image segmentation,
Y . Chen, L. Yu, J.-Y . Wang, N. Panjwani, J.-P. Obeid, W. Liu, L. Liu, N. Kovalchuk, M. F. Gensheimer, L. K. Vitzthum et al. , “Adaptive region-specific loss for improved medical image segmentation,” IEEE Transactions on Pattern Analysis and Machine Intelligence , 2023
2023
-
[15]
Spatial probabilistic distribution map-based two-channel 3D U-net for visual pathway segmentation,
D. Ai, Z. Zhao, J. Fan, H. Song, X. Qu, J. Xian, and J. Yang, “Spatial probabilistic distribution map-based two-channel 3D U-net for visual pathway segmentation,” Pattern Recognition Letters, vol. 138, pp. 601– 607, 2020
2020
-
[16]
Annotation-efficient deep learning for automatic medical image segmentation,
S. Wang, C. Li, R. Wang, Z. Liu, M. Wang, H. Tan, Y . Wu, X. Liu, H. Sun, R. Yang et al., “Annotation-efficient deep learning for automatic medical image segmentation,” Nature communications , vol. 12, no. 1, p. 5915, 2021
2021
-
[17]
Interpretable Multi- modal Image Registration Network Based on Disentangled Convolu- tional Sparse Coding,
X. Deng, E. Liu, S. Li, Y . Duan, and M. Xu, “Interpretable Multi- modal Image Registration Network Based on Disentangled Convolu- tional Sparse Coding,” IEEE Transactions on Image Processing, vol. 32, pp. 1078–1091, 2023
2023
-
[18]
Springer, 2015, pp. 234–241
2015
-
[19]
Mean teachers are better role mod- els: Weight-averaged consistency targets improve semi-supervised deep learning results,
A. Tarvainen and H. Valpola, “Mean teachers are better role mod- els: Weight-averaged consistency targets improve semi-supervised deep learning results,” Advances in neural information processing systems , vol. 30, 2017
2017
-
[20]
Deep convolutional neural network for multi-modal image restoration and fusion,
X. Deng and P. L. Dragotti, “Deep convolutional neural network for multi-modal image restoration and fusion,” IEEE transactions on pattern analysis and machine intelligence, vol. 43, no. 10, pp. 3333–3348, 2020
2020
-
[21]
Learned convolutional sparse coding,
H. Sreter and R. Giryes, “Learned convolutional sparse coding,” in 2018 IEEE International Conference on Acoustics, Speech and Signal Processing (ICASSP). IEEE, 2018, pp. 2191–2195
2018
-
[22]
Semi-supervised strong-teacher consis- tency learning for few-shot cardiac mri image segmentation,
Y . Qiu, J. Meng, and B. Li, “Semi-supervised strong-teacher consis- tency learning for few-shot cardiac mri image segmentation,” Computer Methods and Programs in Biomedicine , p. 108613, 2025
2025
-
[23]
St++: Make self-training work better for semi-supervised semantic segmentation,
L. Yang, W. Zhuo, L. Qi, Y . Shi, and Y . Gao, “St++: Make self-training work better for semi-supervised semantic segmentation,” in Proceedings of the IEEE/CVF conference on computer vision and pattern recognition, 2022, pp. 4268–4277
2022
-
[24]
The human connectome project: a data acquisition perspective,
D. C. Van Essen, K. Ugurbil, E. Auerbach, D. Barch, T. E. Behrens, R. Bucholz, A. Chang, L. Chen, M. Corbetta, S. W. Curtiss et al., “The human connectome project: a data acquisition perspective,” Neuroimage, vol. 62, no. 4, pp. 2222–2231, 2012
2012
-
[25]
Reproducibility of multi-shell diffusion tractography on traveling subjects: a multicenter study prospective,
Q. Tong, H. He, T. Gong, C. Li, P. Liang, T. Qian, Y . Sun, Q. Ding, K. Li, and J. Zhong, “Reproducibility of multi-shell diffusion tractography on traveling subjects: a multicenter study prospective,” Magnetic resonance imaging, vol. 59, pp. 1–9, 2019
2019
-
[26]
Test– retest reproducibility of a multi-atlas automated segmentation tool on multimodality brain mri,
T. J. Rezende, B. M. Campos, J. Hsu, Y . Li, C. Ceritoglu, K. Kutten, M. C. Franca Junior, S. Mori, M. I. Miller, and A. V . Faria, “Test– retest reproducibility of a multi-atlas automated segmentation tool on multimodality brain mri,” Brain and behavior, vol. 9, no. 10, p. e0...
2019
-
[27]
CNTSeg: A multimodal deep-learning-based network for cranial nerves tract segmentation,
L. Xie, J. Huang, J. Yu, Q. Zeng, Q. Hu, Z. Chen, G. Xie, and Y . Feng, “CNTSeg: A multimodal deep-learning-based network for cranial nerves tract segmentation,” Medical Image Analysis , vol. 86, p. 102766, 2023
2023
-
[28]
Learning cross-modal deep representations for multi-modal MR image segmen- tation,
C. Li, H. Sun, Z. Liu, M. Wang, H. Zheng, and S. Wang, “Learning cross-modal deep representations for multi-modal MR image segmen- tation,” in Medical Image Computing and Computer Assisted Interven- tion–MICCAI 2019: 22nd International Conference, Shenzhen, China, October 13–1...
2019
-
[29]
Uncertainty-aware self-ensembling model for semi-supervised 3d left atrium segmentation,
L. Yu, S. Wang, X. Li, C.-W. Fu, and P.-A. Heng, “Uncertainty-aware self-ensembling model for semi-supervised 3d left atrium segmentation,” in Medical Image Computing and Computer Assisted Intervention– MICCAI 2019: 22nd International Conference, Shenzhen, China, Octo- ber 13–...
2019
-
[30]
Semi-supervised medical image segmentation through dual-task consistency,
X. Luo, J. Chen, T. Song, and G. Wang, “Semi-supervised medical image segmentation through dual-task consistency,” inProceedings of the AAAI conference on artificial intelligence , vol. 35, no. 10, 2021, pp. 8801– 8809
2021
-
[31]
Uncertainty-guided mutual consistency learning for semi-supervised medical image segmen- tation,
Y . Zhang, R. Jiao, Q. Liao, D. Li, and J. Zhang, “Uncertainty-guided mutual consistency learning for semi-supervised medical image segmen- tation,” Artificial Intelligence in Medicine , vol. 138, p. 102476, 2023
2023
-
[32]
Bidirectional Copy-Paste for Semi-Supervised Medical Image Segmentation,
Y . Bai, D. Chen, Q. Li, W. Shen, and Y . Wang, “Bidirectional Copy-Paste for Semi-Supervised Medical Image Segmentation,” in Proceedings of the IEEE/CVF Conference on Computer Vision and Pattern Recognition, 2023, pp. 11 514–11 524
2023
-
[33]
DMSPS: Dynamically mixed soft pseudo-label supervision for scribble-supervised medical image segmentation,
M. Han, X. Luo, X. Xie, W. Liao, S. Zhang, T. Song, G. Wang, and S. Zhang, “DMSPS: Dynamically mixed soft pseudo-label supervision for scribble-supervised medical image segmentation,” Medical Image Analysis, vol. 97, p. 103274, 2024
2024
-
[34]
Deep Multimodal Fusion Network for the Retinogeniculate Visual Pathway Segmentation,
L. Xie, L. Yang, Q. Zeng, J. He, J. Huang, Y . Feng, E. Amelina, and M. Amelin, “Deep Multimodal Fusion Network for the Retinogeniculate Visual Pathway Segmentation,” inThe 42nd Chinese Control Conference (CCC 2023), 2023
2023
-
[35]
Transattunet: Multi-level attention-guided u-net with transformer for medical image segmentation,
B. Chen, Y . Liu, Z. Zhang, G. Lu, and A. W. K. Kong, “Transattunet: Multi-level attention-guided u-net with transformer for medical image segmentation,” IEEE Transactions on Emerging Topics in Computational Intelligence, 2023
2023
-
[36]
Msdanet: A multi-scale dilation attention network for medical image segmentation,
J. Zhang, Z. Luan, L. Ni, L. Qi, and X. Gong, “Msdanet: A multi-scale dilation attention network for medical image segmentation,” Biomedical Signal Processing and Control , vol. 90, p. 105889, 2024
2024
-
[37]
Small data challenges in big data era: A survey of recent progress on unsupervised and semi-supervised methods,
G.-J. Qi and J. Luo, “Small data challenges in big data era: A survey of recent progress on unsupervised and semi-supervised methods,” IEEE Transactions on Pattern Analysis and Machine Intelligence , vol. 44, no. 4, pp. 2168–2187, 2020
2020
-
[38]
Slim unetr: Scale hybrid transformers to efficient 3d medical image segmentation under limited computational resources,
Y . Pang, J. Liang, T. Huang, H. Chen, Y . Li, D. Li, L. Huang, and Q. Wang, “Slim unetr: Scale hybrid transformers to efficient 3d medical image segmentation under limited computational resources,” IEEE Transactions on Medical Imaging , 2023
2023
-
[39]
A unified global tractography framework for automatic visual pathway reconstruction,
J. He, S. Yao, Q. Zeng, J. Chen, T. Sang, L. Xie, Y . Pan, and Y . Feng, “A unified global tractography framework for automatic visual pathway reconstruction,” NMR in Biomedicine , vol. 36, no. 7, p. e4904, 2023
2023
Reviewed August 7, 2026 · model on record in the stance chip above.
Discussion (0). Continue with ORCID to comment.