REVIEW 4 major objections 7 minor 15 references
Enhanced Drought Analysis in Bangladesh: A Machine Learning Approach for Severity Classification Using Satellite Data
T0 review · 4 major / 7 minor · reviewed 2026-08-07 · deepseek-v4-flash
Pith's one-line read A K-means clustering of daily satellite weather data from 2012–2024 divides 38 Bangladeshi districts into three drought-severity levels, and supervised classifiers reproduce those levels with up to 92% accuracy.
desk verdict Standard clustering pipeline applied to Bangladesh drought data; geographic novelty is real but severity labels are never externally validated, so the high accuracy is circular. read the letter →
The pith
A machine-rendered reading of the paper's core claim, the machinery that carries it, and where it could break.
The reading
What carries the argument
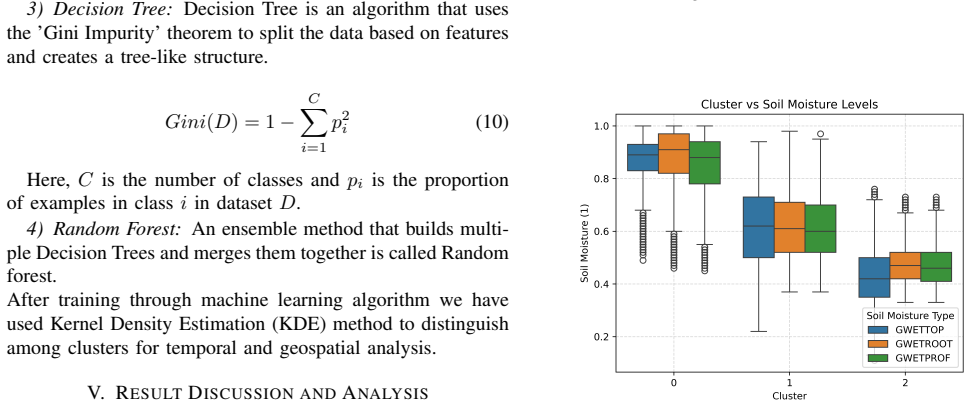
The load-bearing machinery is the K-means clustering algorithm applied to the scaled satellite feature set, with the number of clusters fixed at three by the elbow method on within-cluster sum of squares (WCSS) and validated by silhouette score (0.833). K-means minimizes squared Euclidean distances between data points and their cluster centroid; here it produces clusters that are then interpreted as drought levels through soil-moisture boxplots, radar profiles, and day-of-year density plots. A Bayesian Gaussian Mixture, which uses a Dirichlet-process prior and is estimated by maximizing the evidence lower bound, serves as the probabilistic alternative and scores 0.749, so the paper proceeds with K-means. The resulting cluster labels become the target for four supervised classifiers (KNN, Random Forest, Decision Tree, and Naive Bayes), making the whole framework a two-stage clustering-then-classification pipeline.
What would settle it
Compute a standard drought index such as SPI or SPEI from the same 2012–2024 precipitation and temperature record for the 38 districts and compare it with the cluster labels; if the winter high-drought cluster appears in months the index calls normal or wet, or the monsoon low-drought cluster appears in months the index calls dry, the core severity mapping fails.
Extended reading notes
Core claim
The central discovery is that a three-cluster partition of the satellite weather record is sufficient to organize drought conditions across 38 Bangladeshi districts into severity levels. On 2012–2024 daily data, K-means (silhouette score 0.833) outperforms Bayesian Gaussian Mixture (0.749) and is chosen as the basis for labelling. The clusters are interpreted through soil moisture and seasonality: Cluster 1 has the lowest soil-moisture medians (0.6–0.7), appears in winter (days 0–50 and 250–365), and is treated as high drought; Cluster 0 appears in the monsoon (days 150–250) with the highest soil moisture (0.8–0.9) and is treated as low drought; Cluster 2 occupies the dry/transitional season with the lowest relative humidity and high radiation and is treated as moderate drought. The classification stage then treats these clusters as labels, with Random Forest replicating them at 92% accuracy, Decision Tree at 91%, Naive Bayes at 86%, and KNN at 84%. Geographically, cluster densities are highest in the northwest—interpreted as year-round drought vulnerability—and lower in the eastern and southeastern coastal districts.
Load-bearing premise
The clusters are assumed to correspond to real drought severity levels; the paper interprets them using soil moisture and seasonality but does not validate the labels against an established drought index or historical drought records.
Editorial extensions
If this is right
- Once the K-means centroids are fixed, a district-day can be assigned to a drought level from satellite values alone, with no ground-station measurements needed.
- Random Forest's 92% accuracy suggests the three-level labelling is learnable, so the framework could be run operationally on incoming satellite data.
- The seasonal structure of the clusters—winter high, dry-season moderate, monsoon low—gives a built-in calendar expectation for when each severity level should appear.
- The geospatial pattern, with the northwest showing high density across all clusters and the east and southeast showing lower density, points to specific regions where drought monitoring and water-resource planning should concentrate.
Reading between the lines
- Because the cluster names are assigned after clustering rather than validated against an established drought index or recorded drought events, the high, moderate, and low labels could partly reflect normal seasonal weather variation rather than drought per se; an independent index comparison would settle this.
- The same pipeline could be extended from classification to forecasting by using preceding months' satellite values to predict the next season's cluster membership, a step the paper leaves unstated.
- The approach is likely portable to other data-sparse, agriculture-dependent regions with satellite coverage, though the paper does not demonstrate that transfer.
- A district-level time series of cluster membership would make it possible to ask whether drought severity in the northwest is increasing over the 2012–2024 record, a trend question the paper does not address.
Editorial analysis
A structured set of objections, weighed in public.
Referee Report
Summary. The paper proposes a two-stage machine-learning framework for drought severity classification in Bangladesh. Daily satellite-derived weather variables (temperature, humidity, soil moisture, radiation, pressure, wind) for 38 districts from 2012 to 2024 are clustered with K-means and Bayesian Gaussian Mixture models; the K-means solution with k=3 is selected using an elbow method and a silhouette score of 0.833. The three clusters are interpreted in Table IV as high, moderate, and low drought extremity based on seasonality and median soil moisture, mapped geographically, and then used as labels to train KNN, Random Forest, Decision Tree, and Naive Bayes classifiers, with reported accuracies of 84-92%. The paper concludes that it effectively classifies drought into three distinct levels across Bangladesh.
Significance. Drought monitoring for Bangladesh is a practically important problem, and the paper addresses it with a straightforward integration of publicly available NASA POWER satellite data across multiple districts. If the cluster labels genuinely corresponded to externally defined drought severity, the framework could be a useful screening tool. However, the central claim depends entirely on an unvalidated interpretive step: the clusters are never checked against established drought indices such as SPI, SPEI, or PDSI, against recorded drought events, or against any independent drought criterion. The high silhouette score only attests to cluster compactness, not to drought semantics, and the supervised accuracies only measure how well classifiers reproduce the K-means partition from the same features. The paper also uses a random temporal split and full-data standardization, which likely inflate the reported accuracies. The manuscript is clearly written and reproducible in broad outline, but no code, data, or hyperparameter details are provided, and the lack of external validation is a load-bearing gap for the paper's stated conclusion.
major comments (4)
- [§V-B, Table IV] The central semantic step, renaming K-means clusters as 'higher,' 'moderate,' and 'lower' drought extremity, is never validated against an established drought index or recorded drought events. The silhouette scores in Table III measure cluster compactness and separation, not whether a cluster corresponds to drought. Table IV assigns severity levels using median soil moisture and seasonality, but soil moisture is one of the input features to the clustering, so the severity ordering is derived from the same data that produced the clusters and is therefore a data artifact rather than an independent criterion.
- [§V-D, Table V] The reported classification accuracies are circular with respect to the paper's drought claim. The target labels are generated by K-means on the very same feature set, and held-out test points are labeled by that same K-means model. Consequently, the 84-92% accuracies only demonstrate that Random Forest, Decision Tree, KNN, and Naive Bayes can approximate the K-means labeling function; they do not demonstrate prediction of drought severity. To support the conclusion in Section VI, the classifiers would need to be trained and evaluated on labels from an external drought index or from independently documented drought events.
- [§V-A, Fig. 3, and Table IV] The choice k=3 from the elbow method and the subsequent interpretation of Cluster 1 as 'higher' extremity are not internally consistent with the cluster characteristics listed in Table IV. Cluster 1 is described as winter (days 0-50 and 250-365) with low temperature, low radiation, high surface pressure, and median soil moisture 0.6-0.7. Low soil moisture during the winter dry season is normal climatology in Bangladesh and does not by itself indicate drought; the paper provides no evidence that this cluster corresponds to higher drought severity rather than to a seasonal weather regime.
- [§III-B, §V-D] The evaluation protocol is mismatched with the temporal nature of the data. The entire dataset is standardized with StandardScaler before the 80:20 split, so scaling statistics computed on the full dataset leak information into the test set. Moreover, the 80:20 split is random over daily observations spanning 2012-2024, so training and test points are often adjacent in time and highly autocorrelated, which inflates the reported accuracies. A temporal split (for example, training on earlier years and testing on later years) with scaler fitted on the training portion only would be needed to support any forecasting or prediction claim.
minor comments (7)
- [§II, Table I] The introduction states that traditional indices such as SPI and PDSI overlook soil moisture and temperature, but Table I itself lists soil moisture and temperature among PDSI's inputs; this framing should be corrected for internal consistency.
- [§V-B] The text contains typos and awkward wording, including 'extrimity sections' and 'indifferent clusters'; a careful proofread is needed.
- [§IV-A] Equation (9) is typeset incorrectly: the square root and parentheses are malformed, making the Gaussian Naive Bayes formula hard to read.
- [§III-A] The text says 'valueable insights' in describing the correlation matrix; this should be corrected.
- [§IV, §V] The manuscript does not report hyperparameters for K-means, Bayesian Gaussian Mixture, or the classifiers, nor the random seed used for the train-test split, which limits reproducibility.
- [§V-A] The Bayesian Gaussian Mixture model is clustered and scored but is not carried forward into the classification stage; the paper should either justify this omission or compare classifiers trained on BGMM labels as well.
- [§III-A, Ref. [14]] The NASA POWER dataset reference lacks a direct URL or version identifier beyond 'Hourly 2.3.6 version'; adding a full citation would help readers access the exact data product.
Circularity Check
The three drought-severity levels are labels assigned to K-means clusters built from the same weather features that are later used as classifier inputs; the reported 84-92% accuracies therefore measure reproduction of the clustering function, not prediction of an independently defined drought severity.
-
self definitional
[Section V-B, Table IV; Section V-A]
"Based on the Temporal Distribution, Soil Moisture Levels and other Environmental Characteristics which has been described in the table IV, as well as we have categorized the clusters into three different extrimity sections and mentioned there."
The drought-extremity labels (high/moderate/low) are assigned to the three K-means clusters after clustering. The characteristics used to name the clusters (soil moisture, temperature, humidity, seasonality) are the same input features that produced the clusters in the first place, and no external drought index or recorded drought event is used. Thus 'drought severity' is defined as cluster membership over the feature vector; classifying severity is the same task as reproducing the clustering by construction.
-
fitted input called prediction
[Section III-B, Eq. (2), Section V-D, Table V]
"Table V shows the confusion matrix and accuracy score of our 4 different ML classification models based on their drought cluster prediction which we’ve previously interpreted through clustering methodology."
The ground-truth labels in Table V are the K-means assignments c_i = argmin_k ||x_i - mu_k||^2 computed on the full feature set before the 80/20 split (Section III-B: 'after scaling, the dataset subjected into Unsupervised ML analysis. Then the entire dataset were split'). The supervised classifiers are trained and tested on the same feature vectors x_i to output exactly these labels. Reported accuracies therefore measure how well Random Forest/Decision Tree/KNN/Naive Bayes approximate the K-means labeling function; they do not validate any independent drought-severity construct. The 'prediction' is forced by the construction.
full rationale
The paper's central claim is that the framework 'effectively classified drought into three distinct levels' (Section VI). However, the three levels are produced by K-means clustering over weather features (temperature, humidity, soil moisture, radiation, etc.; Table II) and then renamed as drought-extremity categories in Table IV using the same features. The only quantitative validation, the silhouette scores in Table III, measures cluster compactness, not correspondence to drought. The subsequent supervised models are evaluated against these self-generated cluster labels using the same feature vectors, so their high accuracies are expected consequences of the labeling scheme rather than evidence of drought-classification skill. Because the label definition and the input features are the same object, the derivation reduces to 'the clusters are the clusters.' This is a definitional circularity in the central claim. There are no load-bearing self-citations, so the score is driven entirely by the label-construction circularity. An external benchmark against SPI/PDSI/VHI or documented drought events would be needed to turn the clustering result into an actual drought analysis.
Assumptions & free parameters
free parameters (2)
- Number of clusters k =
3
- Train-test split ratio =
80/20
assumptions (3)
- domain assumption Clusters of weather variables are equivalent to drought severity levels
- domain assumption NASA POWER satellite data accurately represents district-level weather conditions
- domain assumption Each daily record is independent
Cite this review
Pith. "Pith review of Enhanced Drought Analysis in Bangladesh: A Machine Learning Approach for Severity Classification Using Satellite Data." pith.science (2026). https://pith.science/paper/GVFTL2IP
@misc{pith2026250604696,
  author       = {Pith},
  title        = {Pith review of: Enhanced Drought Analysis in Bangladesh: A Machine Learning Approach for Severity Classification Using Satellite Data},
  year         = {2026},
  howpublished = {\url{https://pith.science/paper/GVFTL2IP}},
  note         = {Machine review of arXiv:2506.04696}
}
read the original abstract
Drought poses a pervasive environmental challenge in Bangladesh, impacting agriculture, socio-economic stability, and food security due to its unique geographic and anthropogenic vulnerabilities. Traditional drought indices, such as the Standardized Precipitation Index (SPI) and Palmer Drought Severity Index (PDSI), often overlook crucial factors like soil moisture and temperature, limiting their resolution. Moreover, current machine learning models applied to drought prediction have been underexplored in the context of Bangladesh, lacking a comprehensive integration of satellite data across multiple districts. To address these gaps, we propose a satellite data-driven machine learning framework to classify drought across 38 districts of Bangladesh. Using unsupervised algorithms like K-means and Bayesian Gaussian Mixture for clustering, followed by classification models such as KNN, Random Forest, Decision Tree, and Naive Bayes, the framework integrates weather data (humidity, soil moisture, temperature) from 2012-2024. This approach successfully classifies drought severity into different levels. However, it shows significant variabilities in drought vulnerabilities across regions which highlights the aptitude of machine learning models in terms of identifying and predicting drought conditions.
Figures


Figures from the paper (4 more)


Reference graph
Works this paper leans on
-
[1]
E. Foroumandi, V . Nourani, and S. A. Kantoush, “Investigating the main reasons for the tragedy of large saline lakes: Drought, climate change, or anthropogenic activities? A call to action,” Journal of Arid Environments, vol. 196, p. 104652, Jan. 2022. Available: https://doi.org/ 10.1016/j.jaridenv.2021.104652
arXiv 2022
-
[2]
Climate Change and Drought: the Soil Moisture Perspective,
A. Berg and J. Sheffield, “Climate Change and Drought: the Soil Moisture Perspective,” Current Climate Change Reports , vol. 4, no. 2, pp. 180–191, Apr. 2018. Available: https://doi.org/10.1007/ s40641-018-0095-0
work page 2018
-
[3]
Drought forecasting using new ma- chine learning methods
A. Belayneh and J. Adamowski, “Drought forecasting using new ma- chine learning methods” Journal of Water and Land Development , vol. 18, no. 9, pp. 3–12, Jun. 2013. Available: https://doi.org/10.2478/ jwld-2013-0001
work page 2013
-
[4]
C. Lalika, A. U. H. Mujahid, M. James, and M. C. S. Lalika, ”Machine learning algorithms for the prediction of drought conditions in the Wami River sub-catchment, Tanzania,” Journal of Hydrology: Regional Studies, vol. 53, pp. 101794, Jun. 2024. Available: https://doi.org/10. 1016/J.EJRH.2024.101794
arXiv 2024
-
[5]
K. Sundararajan, L. Garg, K. Srinivasan, A. K. Bashir, J. Kaliappan, G. P. Ganapathy, S. K. Selvaraj, and T. Meena, ”A contemporary review on drought modeling using machine learning approaches,” CMES - Computer Modeling in Engineering and Sciences , vol. 128, no. 2, pp. 447–487, 2021. Available: https://doi.org/10.32604/CMES.2021.015528
-
[6]
N. Nandgude, T. P. Singh, S. Nandgude, and M. Tiwari, “Drought prediction: A comprehensive review of different drought prediction models and adopted technologies,” Sustainability, vol. 15, no. 15, p. 11684, Jul. 2023. Available: https://doi.org/10.3390/su151511684
-
[7]
A. D. Gorgij, M. Alizamir, O. Kisi, and A. Elshafie, “Drought modelling by standard precipitation index (SPI) in a semi-arid climate using deep learning method: long short-term memory,” Neural Computing and Applications, vol. 34, no. 3, pp. 2425–2442, Sep. 2021. Available: https://doi.org/10.1007/s00521-021-06505-6
-
[8]
F. A. Prodhan, J. Zhang, S. S. Hasan, T. P. Sharma, and H. P. Mohona, “A review of machine learning methods for drought hazard monitoring and forecasting: Current research trends, challenges, and future research directions,” Environmental Modelling & Software , vol. 149, p. 105327, Mar. 2022. Available: https://doi.org/10.1016/j.envsoft.2022.105327
Show all 15 references
-
[9]
Enhancing crop yield prediction utilizing machine learning on Satellite- Based vegetation health indices,
H. T. Pham, J. Awange, M. Kuhn, B. Van Nguyen, and L. K. Bui, “Enhancing crop yield prediction utilizing machine learning on Satellite- Based vegetation health indices,” Sensors, vol. 22, no. 3, p. 719, Jan
-
[10]
Assessment and prediction of meteorological drought using machine learning algo- rithms and climate data,
K. En-Nagre, M. Aqnouy, A. Ouarka, S. A. Naqvi, I. Bouizrou, J. E. S. El Messari, A. Tariq, W. Soufan, W. Li, and H. El-Askary, “Assessment and prediction of meteorological drought using machine learning algo- rithms and climate data,” Climate Risk Management, vol. 45, p. 1006...
2024
-
[11]
Comprehensive evaluation of machine learning techniques for hydrological drought forecasting,
M. Jehanzaib, M. B. Idrees, D. Kim, and T. W. Kim, “Comprehensive evaluation of machine learning techniques for hydrological drought forecasting,” Journal of Irrigation and Drainage Engineering , vol. 147, no. 7, Jul. 2021. Available: https://doi.org/10.1061/(asce)ir.1943-4774...
2021 doi
-
[12]
A new method for assessment of regional drought risk: information diffusion and interval mapping adjustment based on k-means cluster points,
W. Xu, M. Tang, and Y . Li, “A new method for assessment of regional drought risk: information diffusion and interval mapping adjustment based on k-means cluster points,” Journal of Water and Climate Change, vol. 13, no. 12, pp. 4302–4316, Nov. 2022. Available: https://doi.org...
2022
-
[13]
Optimizing spatial distribution of watershed-scale hydrologic models using Gaussian Mixture Models,
T. Maurer, F. Avanzi, C. A. Oroza, S. D. Glaser, M. Conklin, and R. C. Bales, “Optimizing spatial distribution of watershed-scale hydrologic models using Gaussian Mixture Models,” Environmental Modelling & Software, vol. 142, p. 105076, Aug. 2021. Available: https://doi.org/10...
2021
-
[14]
Prediction of Worldwide Energy Resource (POWER) Project,
NASA Langley Research Center, “Prediction of Worldwide Energy Resource (POWER) Project,” NASA Earth Science/Applied Science Program, Hourly 2.3.6 version, accessed Aug. 12, 2024
2024
-
[2022]
Available: https://doi.org/10.3390/s22030719
Reviewed August 7, 2026 · model on record in the stance chip above.
Discussion (0). Continue with ORCID to comment.