REVIEW 2 major objections 4 minor 34 references
This paper claims that in O-RAN, end-to-end energy and latency can be jointly modeled and optimized as functions of where baseband processing and AI inference run, with edge placement minimizing latency and centralized placement minimizing
Reviewed by Pith at T0; open to challenge. T0 means a machine referee read the full paper against a public rubric. the ladder, T0–T4 →
T0 review · deepseek-v4-flash
2026-08-04 15:24 UTC pith:GVZ66OP6
load-bearing objection Solid modeling extension with a load-bearing simplification in the latency stack; worth a referee but the high-load results need rework. the 2 major comments →
Energy-Latency Trade-offs in O-RAN with Distributed Baseband Processing and AI Inference
The pith
A machine-rendered reading of the paper's core claim, the machinery that carries it, and where it could break.
Core claim
The central claim is that the end-to-end model (Eqs. 1–11) together with the optimization (18–23) jointly captures baseband, transport, and AI-inference energy and latency, and that placing baseband processing closer to the network edge significantly reduces latency but incurs higher energy consumption, whereas centralized deployments at the O-CU or data center achieve lower energy per bit at the cost of increased transport latency. The paper further establishes that network load and server frequency are the two operating variables shaping feasibility regions for latency budgets: raising frequency compensates for queuing-induced delay under moderate load, but centralized configurations remai
What carries the argument
The key objects are (i) the four functional configurations {G, F, M, B} that place baseband processing and co-located AI inference at the O-RU, O-DU, O-CU, or data center; (ii) closed-form per-bit energy terms for processing (Eqs. 1–3) and transport across backhaul, midhaul, and fronthaul (Eqs. 5–7); (iii) an M/M/1 queueing model for Ethernet switch delay (Eq. 8), combined with propagation, eCPRI encapsulation, baseband, and AI-inference latency terms; and (iv) a hierarchical binary tuple (χ, η, ω) mapped to a one-hot configuration-selection vector x, turning the placement choice into a small MILP that minimizes end-to-end latency subject to an energy budget. The MILP is solved exactly by en
Load-bearing premise
Every switch along the path is assumed to experience the same network load ρ, so queueing delay at each hop is computed with the same M/M/1 utilization; per-switch arrival rates are never derived from user traffic.
What would settle it
Measure end-to-end latency in a small O-RAN testbed or simulation with realistic per-switch utilization tapering (e.g., fronthaul at 0.9, midhaul at 0.6, backhaul at 0.3) and compare against the paper's single-ρ M/M/1 prediction: if the latency ordering among configurations F, M, and B at high load reverses, the global-load assumption is refuted.
If this is right
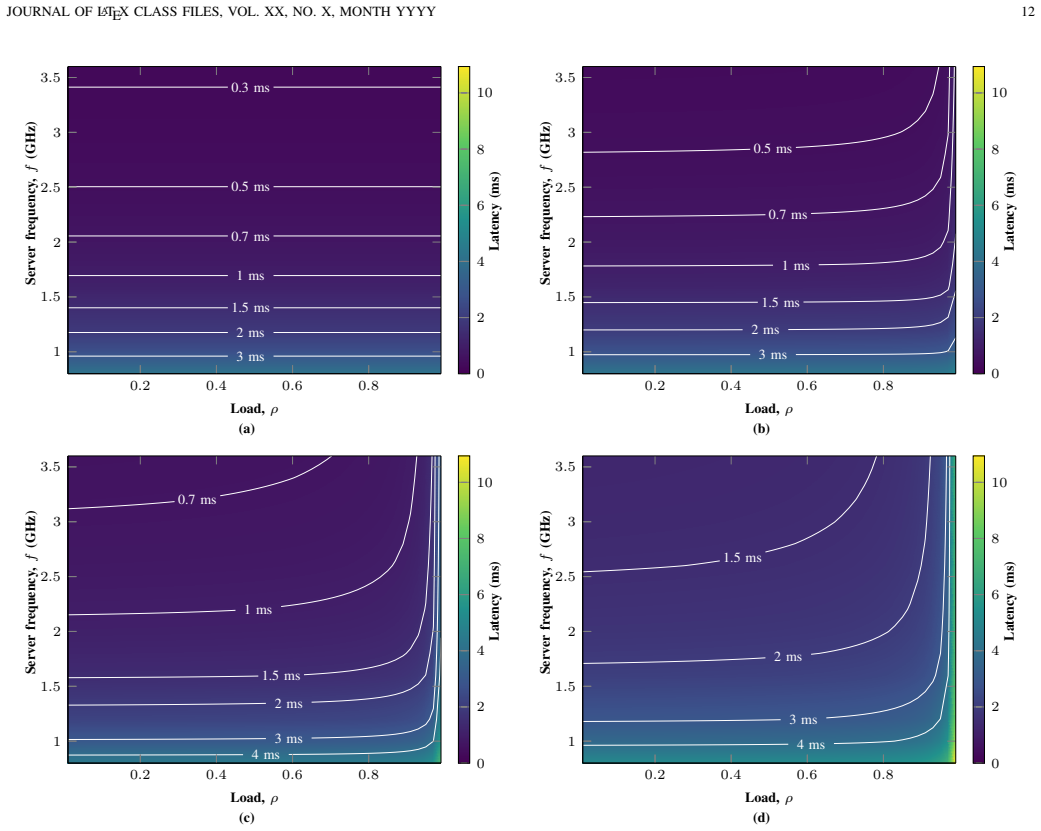
- If a deployment targets sub-millisecond latency, processing must remain at the O-RU or O-DU; configurations M and B cannot meet tight latency budgets even at the highest server frequency and zero load.
- Under near-saturation load (ρ=0.99), centralized configurations degrade sharply—configuration B stays above roughly 7 ms even at the best frequency—so latency-critical services must stay at the edge or rely on frequency scaling where possible.
- Raising the energy budget shifts the optimal configuration from centralized to distributed, creating an explicit energy-versus-latency trade-off curve that operators can use for placement decisions.
- Server frequency scaling can compensate for moderate queuing delay; for example, configuration F maintains about 2 ms latency as load rises from 0.01 to 0.99 by increasing frequency from 1.2 to 1.6 GHz.
- The optimization is cheap to solve (four enumerations with low-dimensional continuous subproblems), enabling re-optimization as load and compute conditions change.
Where Pith is reading between the lines
- If the single-global-load assumption were relaxed to per-switch arrival rates derived from user traffic, the configuration ordering at high load could change: realistic load tapering toward the aggregation/core would reduce queueing delay on midhaul and backhaul switches, likely making centralized configurations more competitive than the paper's ρ=0.99 results suggest.
- The framework treats AI inference as a fixed compute term co-located with baseband; decoupling inference placement (e.g., edge baseband with cloud inference) would introduce a new optimization degree of freedom and could shift the Pareto frontier for AI-native workloads.
- Replacing the deterministic average-delay abstraction with quantile-based or closed-loop latency constraints—identified in the paper as complementary—could make the feasibility regions stricter for reliability-critical services and change which configurations are selected under low energy budgets.
- The model's energy gap between edge and central processing depends on assumed processor efficiencies (6 W/core at O-RU/O-DU/O-CU vs. 5.5 W/core at DC); if edge hardware becomes more energy-proportional, the energy penalty of distributed processing would shrink, altering the optimal placement boundary.
Editorial analysis
A structured set of objections, weighed in public.
Referee Report
Summary. The paper develops an end-to-end energy and latency model for O-RAN with four functional configurations (G, F, M, B) that place baseband processing and co-located AI inference at the O-RU, O-DU, O-CU, or DC. The energy part combines a previously published throughput-based model with a new AI-inference energy term; the latency part adds M/M/1 switch queueing, propagation, baseband processing, and AI inference components. The authors then formulate a mixed-integer program that minimizes end-to-end latency subject to an energy-per-bit budget over configuration choice and operating point (server frequency f and network load rho). Numerical results show that edge processing gives lower latency but higher energy, while centralized processing gives lower energy but higher latency, with the gap widening under high load. The central trade-off claim is plausible and consistent with prior work, but two modeling aspects—the shared global load rho in the queueing analysis and the monotone structure of the optimization—need to be addressed before the quantitative conclusions can be accepted.
Significance. If the model were fully validated, the paper would provide a useful system-level framework for O-RAN deployment studies, especially the explicit inclusion of AI inference energy and latency alongside conventional baseband and transport components. The decomposition into processing, transport, and inference terms is a reasonable contribution, and the paper correctly identifies that configuration choice couples compute and transport costs. The paper also gives a clear, low-dimensional enumeration procedure for the MIP, which is practical. However, the load-dependent latency results and the claimed joint optimization of operating point are not yet supported by the current formulation. The low-load trade-off (edge vs. centralized) is robust and useful; the high-load saturation behavior, which is emphasized in the conclusions, depends on an unverified uniformity assumption about switch loads. No code or data are provided, so numerical claims cannot be checked directly. Overall the framework has potential, but the central quantitative and optimization claims require revision.
major comments (2)
- [Section III-B and Eqs. (5)-(7)] The latency model applies one global load rho to every switch along the path: L_FH = tau_o d_f + H_f,s L_sw, L_MH = tau_o d_m + H_m,s L_sw, and L_BH = tau_o d_b + H_b,s L_sw + H_b,r L_ro, where L_sw uses the same M/M/1 delay L_q(rho) from Eq. (8) on every hop. Yet the energy model in Eqs. (5)-(7) uses segment-specific traffic scaling factors gamma_f, gamma_m, gamma_b that differ by configuration, implying that the carried traffic per segment is known to be different. No derivation connects per-switch arrival rates to these gamma factors or to user traffic. Consequently, the high-load ordering in Figs. 4-7—especially Conf. B reaching ~7 ms at rho=0.99—is largely a mechanical consequence of multiplying a chosen divergent queue delay by hop counts. With realistic load tapering toward aggregation/core, the ordering of configurations under saturation could change. Please derive per-switch uti
- [Section IV-C, Eqs. (18)-(23)] The optimization minimizes L(x,f,rho) over configuration x and operating point (f,rho). The objective is monotone in both continuous variables: L_bp in Eq. (9) decreases as f increases (roughly as 1/f^2), and L_sw in Eq. (8) increases with rho. The energy constraint (19) uses per-configuration constants E_i that do not depend on f or rho. Therefore, for any feasible configuration i, the optimal operating point is trivially f=f_max and rho=rho_min; there is no frequency-load trade-off to optimize. The claim that the method 'jointly selects' the operating point is thus not realized by the formulation. Either make the energy model depend on f and rho (e.g., frequency-dependent processor power, load-dependent network equipment energy), add a coupling term that makes the objective non-monotone, or treat rho as an exogenous scenario parameter and state that the only decision is configuration s
minor comments (4)
- [Section III-B2] Units error: the text says 'service rate mu, measured in packets per second', then gives 'mu=0.138 Mbps'. For a 10 Gbps line card with jumbo frames, the service rate should be approximately 138,888 packets/s (or the equation should be written in bits/s). Please correct the units and verify that any numerical latency results that use mu are dimensionally correct.
- [Eq. (9)] The typesetting of L_bp = N_rb f^2 sum zeta_j i_m^j is ambiguous. Please clarify whether the intended formula is L_bp = (N_rb / f^2) * sum_j zeta_j i_m^j, and state the units of N_rb, zeta_j, and f explicitly, along with the source of the coefficient values used in the numerical evaluation.
- [Section III-A and Eqs. (5)-(7)] The notation gamma_u in Eq. (1) and gamma_(.) in Eqs. (5)-(7) is overloaded. It would help readers to use distinct symbols (e.g., gamma_u for node scaling and g_f, g_m, g_b for segment scaling) and to state explicitly in one place how each gamma depends on the BBP location.
- [Section V-B2] Typographical errors: 'fro configuration G' and 'the latency behavior fro configuration G' should be 'for'. Please proofread the results section.
Circularity Check
No significant circularity: the energy model is cited from prior work [5] with externally specified hardware parameters, and the latency/AI components come from independent literature; the central trade-off is not fitted or self-referential.
full rationale
I walked the paper's claimed derivation chain. The energy-per-bit formulas in Eqs. (1)-(7) are taken from the authors' own prior work [5], but the paper states this explicitly ('we start from the throughput-based O-RAN energy model in [5] and extend it') and the parameters (P_sc, C_sc, P_ls,u, C_ls,u, α, σ, φ, γ) are specified hardware/overprovisioning values, not quantities fitted to produce the paper's conclusions. The latency model is assembled from independent sources: M/M/1 queuing from [22], propagation/switching constants from [21], baseband-processing curve fit from [11], and AI inference latency decomposition from [27]. The optimization (18)-(23) enumerates four fixed configurations and compares stored per-configuration constants; no parameter is fitted to make the energy-latency trade-off appear. The only self-citation is [5], and although it is load-bearing for the energy component, it is not circular: it does not assume the target result, and its parameter values are externally specified. The reviewer concern that a single global ρ is applied to every switch (Eq. 8 feeding L_FH, L_MH, L_BH) is a modeling assumption that may affect the quantitative high-load ordering, but it is an assumption about traffic, not an equivalence between the model's inputs and outputs by construction; that belongs to correctness risk rather than circularity. No circular step meets the evidentiary bar of Eq. X = Eq. Y by definition or a fitted parameter renamed as a prediction.
Axiom & Free-Parameter Ledger
free parameters (5)
- Overprovisioning, overhead, coverage, and traffic scaling factors alpha, sigma, phi, gamma =
from [5], not tabulated
- Inference request rate lambda_in =
1 request/s
- BBP latency polynomial coefficients zeta_j =
from [11], not listed
- Transport link distances d_f, d_m, d_b =
20 km, 40 km, 100 km
- Switch service rate mu =
example given as 0.138 Mbps (units inconsistent)
axioms (6)
- domain assumption Each egress switch port is an M/M/1 queue with Poisson arrivals and exponential service.
- domain assumption The same global network load rho applies to every switch in every traversed segment.
- domain assumption AI inference latency is dominated by compute time, L_in approximately L_ic = N_op/T_ex.
- ad hoc to paper BBP and AI inference are co-located at the selected configuration node.
- ad hoc to paper One inference request per second per user (lambda_in=1).
- domain assumption The curve-fitted BBP latency polynomial (9) from [11] holds for the modeled O-RAN servers.
read the original abstract
The Open Radio Access Network (O-RAN) architecture introduces flexible functional splits and open interfaces that enable distributed and centralized deployment of baseband processing. While this flexibility offers opportunities for improved resource utilization, it also introduces fundamental trade-offs between energy efficiency and latency. In this paper, we develop a throughput-based end-to-end energy consumption model for O-RAN and extend it by incorporating detailed latency modeling and application-specific Artificial Intelligence/Machine Learning inference costs. The proposed end-to-end modeling framework provides a general representation of processing, transport, and inference-related energy and delay across the access, metro, and long-haul network segments. Building on this general model, we formulate an optimization problem that selects the placement of baseband processing and AI inference tasks across candidate O-RAN configurations to analyze energy-latency tradeoffs under network load, server frequency, and energy-budget constraints. Using representative hardware platforms and realistic traffic assumptions, we evaluate multiple baseband processing placements corresponding to different O-RAN functional configurations. Our results reveal how user quality of service requirements and network load conditions jointly determine the optimal placement of baseband processing and AI inference tasks, highlighting the inherent trade-off between energy efficiency and latency. The analysis provides practical insights for latency-aware and energy-efficient O-RAN deployments supporting emerging AI-driven services.
Figures



Reference graph
Works this paper leans on
-
[1]
O-RAN specifications,
O-RAN Alliance, “O-RAN specifications,” 2025. Accessed: Jul. 21,
2025
-
[2]
NN-Meter: Towards accurate latency prediction of deep-learning model inference on diverse edge devices,
L. L. Zhanget al., “NN-Meter: Towards accurate latency prediction of deep-learning model inference on diverse edge devices,” inProc. Int. Conf. Mobile Syst., Appl., Services, WI, USA, pp. 81–93, 2021
2021
-
[3]
O-RAN: Disrupting the virtu- alized RAN ecosystem,
A. Garcia-Saavedra and X. Costa-Perez, “O-RAN: Disrupting the virtu- alized RAN ecosystem,”IEEE Commun. Standards Mag., vol. 5, no. 4, pp. 96–103, 2021
2021
-
[4]
Energy consumption of machine learning enhanced open RAN: A comprehensive review,
X. Lianget al., “Energy consumption of machine learning enhanced open RAN: A comprehensive review,”IEEE Access, vol. 12, pp. 81889– 81910, 2024
2024
-
[5]
Design and analysis of power consumption models for Open-RAN architectures,
U. Tariq, R. Raj, and D. Kilper, “Design and analysis of power consumption models for Open-RAN architectures,” inProc. IEEE Int. Conf. Commun. Workshops, Montreal, QC, Canada, pp. 1037–42, 2025
2025
-
[6]
O-RAN: Analysis of latency-critical interfaces and overview of time sensitive networking solutions,
E. Municio, G. Garcia-Aviles, A. Garcia-Saavedra, and X. Costa-P ´erez, “O-RAN: Analysis of latency-critical interfaces and overview of time sensitive networking solutions,”IEEE Commun. Standards Mag., vol. 7, no. 3, pp. 82–89, 2023
2023
-
[7]
On the road to 6G: Visions, requirements, key technologies, and testbeds,
C.-X. Wanget al., “On the road to 6G: Visions, requirements, key technologies, and testbeds,”IEEE Commun. Surveys Tuts., vol. 25, no. 2, pp. 905–974, 2023
2023
-
[8]
A survey of the functional splits proposed for 5G mobile crosshaul networks,
L. M. P. Larsen, A. Checko, and H. L. Christiansen, “A survey of the functional splits proposed for 5G mobile crosshaul networks,”IEEE Commun. Surveys Tuts., vol. 21, no. 1, pp. 146–172, 2019
2019
-
[9]
Toward sustainable O-RAN deployment: An in-depth analysis of power consumption,
G. Baldiniet al., “Toward sustainable O-RAN deployment: An in-depth analysis of power consumption,”IEEE Trans. Green Commun. Netw., vol. 9, no. 2, pp. 429–444, 2025
2025
-
[10]
Power-efficient baseband-function placement in latency-constrained 5G metro access,
L. M. M. Zorello, M. Sodano, S. Troia, and G. Maier, “Power-efficient baseband-function placement in latency-constrained 5G metro access,” IEEE Trans. Green Commun. Netw., vol. 6, no. 3, pp. 1683–96, 2022
2022
-
[11]
Energy-efficient DU-CU deployment and lightpath provisioning for service-oriented 5G metro access/aggregation networks,
Y . Xiao, J. Zhang, and Y . Ji, “Energy-efficient DU-CU deployment and lightpath provisioning for service-oriented 5G metro access/aggregation networks,”J. Lightw. Technol., vol. 39, no. 17, pp. 5347–5361, 2021
2021
-
[12]
DRL-based energy-efficient baseband function deployments for service-oriented open RAN,
H. Liet al., “DRL-based energy-efficient baseband function deployments for service-oriented open RAN,”IEEE Trans. Green Commun. Netw., vol. 8, no. 1, pp. 224–237, 2024
2024
-
[13]
Energy-aware CPU orchestration in O-RAN: A dApp- driven lightweight approach,
F. Crespoet al., “Energy-aware CPU orchestration in O-RAN: A dApp- driven lightweight approach,” 2025. arXiv:2508.00629. Accessed: Jul. 21, 2026. [Online]. Available: https://arxiv.org/abs/2508.00629
Pith/arXiv arXiv 2025
-
[14]
Statistical characterization of closed-loop latency at the mobile edge,
S. Sumanet al., “Statistical characterization of closed-loop latency at the mobile edge,”IEEE Trans. Commun., vol. 71, no. 7, pp. 4391–4405, 2023
2023
-
[15]
Unified timing analysis for closed-loop goal-oriented wireless communication,
L. Li, A. E. Kalør, P. Popovski, and W. Chen, “Unified timing analysis for closed-loop goal-oriented wireless communication,”IEEE Trans. Wireless Commun., vol. 24, no. 4, pp. 2814–2831, 2025
2025
-
[16]
Statistical analysis for energy-efficient satellite edge computing with latency guarantees,
N. D. Lyholmet al., “Statistical analysis for energy-efficient satellite edge computing with latency guarantees,” 2026. arXiv:2605.10215. Accessed: Jul. 21, 2026. [Online]. Available: https://arxiv.org/abs/2605. 10215
Pith/arXiv arXiv 2026
-
[17]
Roofline: An insightful visual performance model for multicore architectures,
S. Williams, A. Waterman, and D. Patterson, “Roofline: An insightful visual performance model for multicore architectures,”Commun. ACM, vol. 52, no. 4, pp. 65–76, 2009
2009
-
[18]
MobileNetV2: Inverted residuals and linear bottle- necks,
M. Sandleret al., “MobileNetV2: Inverted residuals and linear bottle- necks,” inProc. IEEE Conf. Comput. Vis. Pattern Recognit., Salt Lake City, UT, USA, pp. 4510–4520, 2018
2018
-
[19]
How to evaluate deep neural network processors: TOPS/W (alone) considered harmful,
V . Sze, Y .-H. Chen, T.-J. Yang, and J. S. Emer, “How to evaluate deep neural network processors: TOPS/W (alone) considered harmful,”IEEE Solid-State Circuits Mag., vol. 12, no. 3, pp. 28–41, 2020
2020
-
[20]
Edge AI: On-demand acceler- ating deep neural network inference via edge computing,
E. Li, L. Zeng, Z. Zhou, and X. Chen, “Edge AI: On-demand acceler- ating deep neural network inference via edge computing,”IEEE Trans. Wireless Commun., vol. 19, no. 1, pp. 447–457, 2020
2020
-
[21]
Edge-enhanced graph neural network for DU-CU place- ment and lightpath provision in X-Haul networks,
R. Wanget al., “Edge-enhanced graph neural network for DU-CU place- ment and lightpath provision in X-Haul networks,”J. Opt. Commun. Netw., vol. 14, no. 10, pp. 828–839, 2022
2022
-
[22]
C. G. Cassandras and S. Lafortune,Introduction to Discrete Event Systems. Springer, 2nd ed., 2008
2008
-
[23]
Scal- ability and performance evaluation of edge cloud systems for latency constrained applications,
S. Maheshwari, D. Raychaudhuri, I. Seskar, and F. Bronzino, “Scal- ability and performance evaluation of edge cloud systems for latency constrained applications,” inProc. IEEE/ACM Symp. Edge Comput., Bellevue, W A, USA, pp. 286–299, 2018
2018
-
[24]
Evaluation of process bus data latency with PRP/HSR enabled ethernet switches,
M. Han, P. A. Crossley, and S. Salyani, “Evaluation of process bus data latency with PRP/HSR enabled ethernet switches,” inProc. Int. Conf. Develop. Power Syst. Protection, Liverpool, U.K., pp. 1–6, 2020
2020
-
[25]
A machine learning approach to estimating queuing delay on a router over a single-hop path,
T. Rickeret al., “A machine learning approach to estimating queuing delay on a router over a single-hop path,” inProc. IEEE Int. Conf. Commun., Seoul, South Korea, pp. 2720–2725, 2022
2022
-
[26]
Understanding the computa- tional requirements of virtualized baseband units using a programmable cloud radio access network testbed,
T. X. Tran, A. Younis, and D. Pompili, “Understanding the computa- tional requirements of virtualized baseband units using a programmable cloud radio access network testbed,” inProc. IEEE Int. Conf. Auton. Comput., Columbus, OH, USA, pp. 221–226, 2017
2017
-
[27]
Paleo: A performance model for deep neural networks,
H. Qi, E. R. Sparks, and A. Talwalkar, “Paleo: A performance model for deep neural networks,” inProc. Int. Conf. Learn. Representations, Toulon, France, pp. 1–10, 2017
2017
-
[28]
Efficient LLMs training and inference: An introduction,
R. Liet al., “Efficient LLMs training and inference: An introduction,” IEEE Access, vol. 13, pp. 32944–32970, 2025
2025
-
[29]
Mobile data traffic forecast—ericsson mobility report,
Ericsson, “Mobile data traffic forecast—ericsson mobility report,” 2025. Accessed: Jul. 21, 2026. [Online]. Available: https://www.ericsson.com/en/reports-and-papers/mobility-report/ dataforecasts/mobile-traffic-forecast
2025
-
[30]
Eyeriss v2: A flexible accelerator for emerging deep neural networks on mobile devices,
Y .-H. Chen, T.-J. Yang, J. Emer, and V . Sze, “Eyeriss v2: A flexible accelerator for emerging deep neural networks on mobile devices,”IEEE J. Emerg. Sel. Topics Circuits Syst., vol. 9, no. 2, pp. 292–308, 2019
2019
-
[31]
NVIDIA A100 tensor core GPU,
NVIDIA, “NVIDIA A100 tensor core GPU,” Dec. 25, 2025. Ac- cessed: Jul. 21, 2026. [Online]. Available: https://www.nvidia.com/ en-us/data-center/a100/
2025
-
[32]
L4 tensor core GPU for AI and graphics,
NVIDIA, “L4 tensor core GPU for AI and graphics,” 2025. Ac- cessed: Jul. 21, 2026. [Online]. Available: https://www.nvidia.com/ en-us/data-center/l4/
2025
-
[33]
Optical front/mid-haul with open access- edge server deployment framework for sliced O-RAN,
S. Mondal and M. Ruffini, “Optical front/mid-haul with open access- edge server deployment framework for sliced O-RAN,”IEEE Trans. Netw. Service Manag., vol. 19, no. 3, pp. 3202–3219, 2022
2022
-
[2026]
Available: https://www.o-ran.org/specifications
[Online]. Available: https://www.o-ran.org/specifications
discussion (0)
Sign in with ORCID, Apple, or X to comment. Anyone can read and Pith papers without signing in.