Electrical Noise Produced by Micron-Sized Particles above a Surface Paul Trap
Pith reviewed 2026-06-26 20:19 UTC · model grok-4.3
The pith
Micron-sized particles on ion trap surfaces produce the observed electric field noise when modeled as lossy dielectrics.
A machine-rendered reading of the paper's core claim, the machinery that carries it, and where it could break.
Core claim
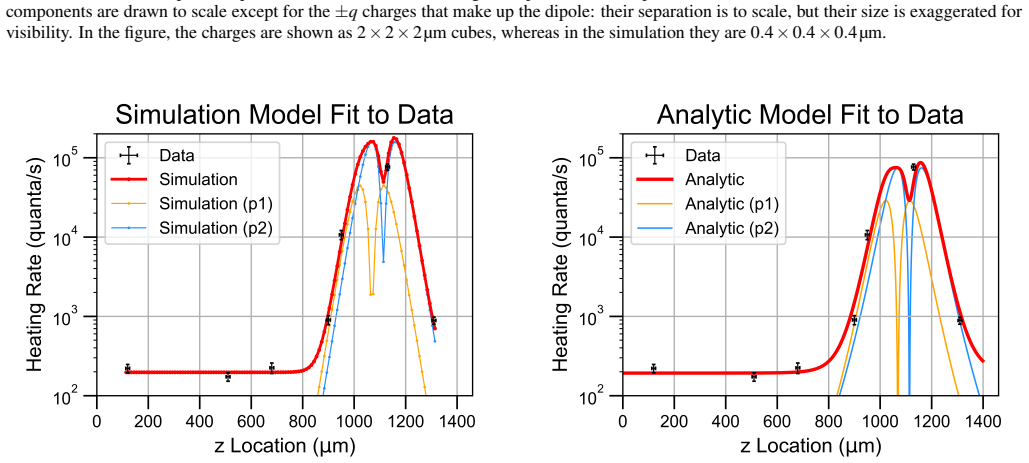
Electric field noise arises from micron-sized particles that are modeled as a lossy dielectric with effective loss tangent tanθ=0.33(0.06); this single parameter accounts for the absolute noise level as well as its spatial and frequency dependence along the trap axis.
What carries the argument
Modeling of visible micron-sized particles as a lossy dielectric with effective loss tangent tanθ=0.33(0.06)
If this is right
- Noise strength can change by orders of magnitude when particles are present or absent.
- The same dielectric-loss model predicts both the position dependence and the frequency spectrum of the noise.
- Presence or absence of such particles can account for the large scatter in noise values reported across different traps in the literature.
Where Pith is reading between the lines
- Surface cleaning protocols that target micron-scale particles could bring noise down to the lowest observed levels.
- The same loss mechanism may operate in other microfabricated quantum devices that rely on clean electrode surfaces.
- If the loss tangent is characteristic of common fabrication residues, targeted material studies could identify lower-loss alternatives.
Load-bearing premise
The micron-sized particles seen in the images are the dominant source of the measured noise rather than unseen surface features or other contaminants.
What would settle it
Remove or cover the visible micron-sized particles at a high-noise location and re-measure the electric field noise to check whether it falls to the low levels observed at particle-free sites.
Figures
read the original abstract
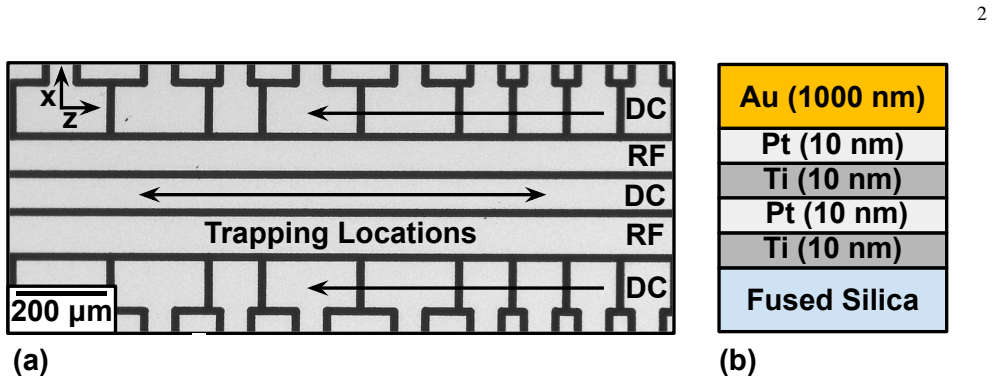
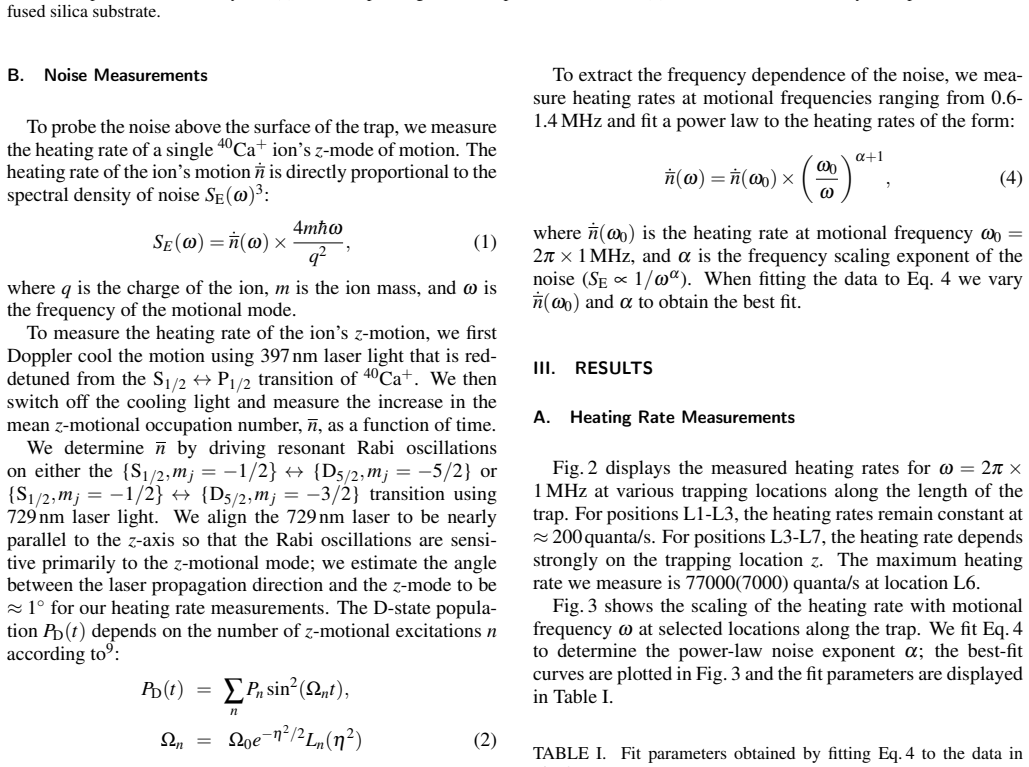
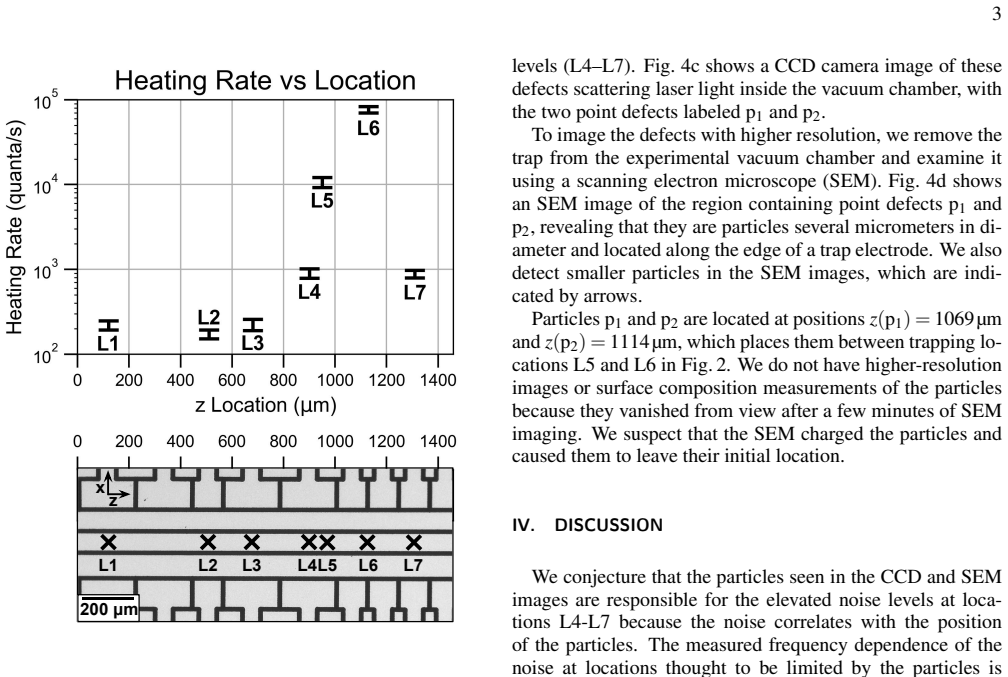
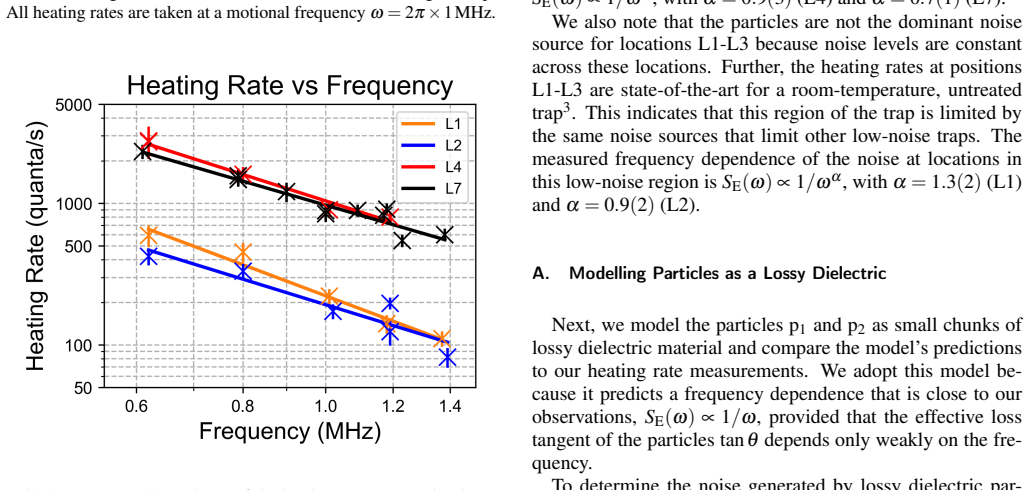
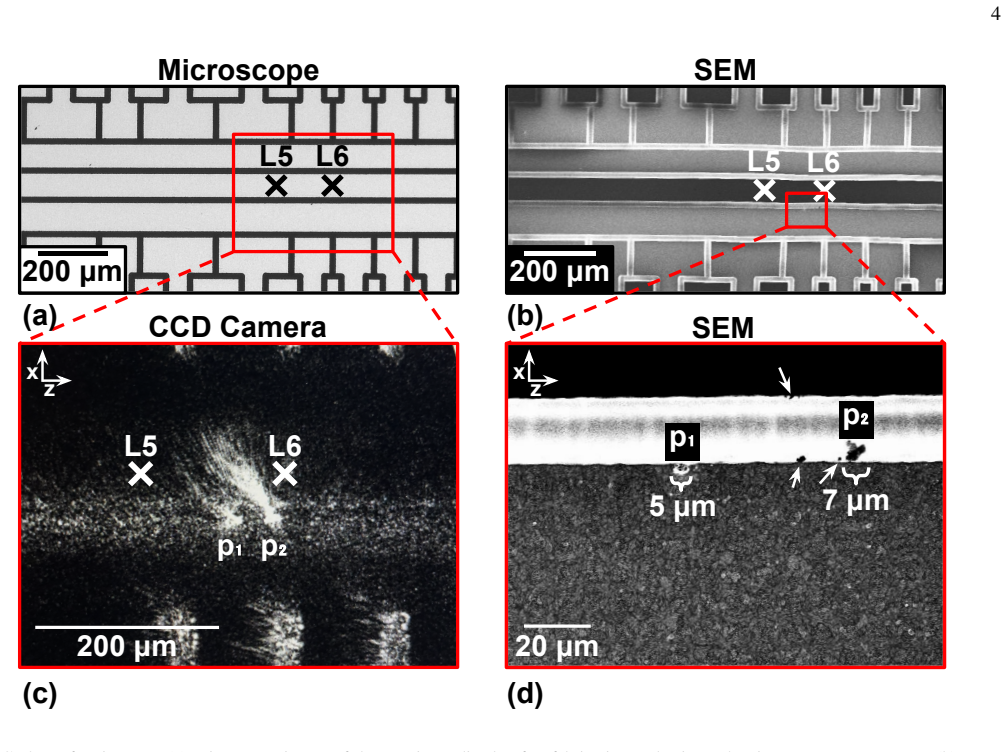
Electric field noise produced by the surface of ion trap electrodes reduces the fidelity of quantum computing operations. Despite decades of investigation its microscopic origins remain unclear. Here, we measure electric field noise at trapping locations along the symmetry axis of a linear surface Paul trap. We find that noise levels vary by three orders-of-magnitude in one 600$\,\mu$m section of the trap. Optical and scanning electron microscope images show micron-sized particles close to the trapping locations with the highest noise levels. We find that modeling the particles as a lossy dielectric with a effective loss tangent $\tan\theta=0.33(0.06)$ describes the magnitude of the noise, as well as its spatial and frequency dependence. Our observations may explain the large variation of reported noise levels in literature.
Editorial analysis
A structured set of objections, weighed in public.
Referee Report
Summary. The paper reports measurements of electric field noise along the axis of a linear surface Paul trap, finding three orders of magnitude variation over a 600 μm section. Optical and SEM imaging show micron-sized particles near the highest-noise trapping sites. The authors model the particles as lossy dielectrics using a single effective loss tangent tanθ=0.33(0.06) obtained from a fit and claim that this accounts for the observed noise magnitude as well as its spatial and frequency dependence, potentially explaining variations reported in the ion-trap literature.
Significance. If the particles are established as the dominant source, the result would supply a concrete, testable mechanism for the large scatter in measured electric-field noise across surface traps, a key obstacle to high-fidelity ion-trap quantum computing. The reported spatial correlation between imaged particles and noise hotspots, together with a simple one-parameter model that reproduces the position and frequency trends, constitutes a useful empirical anchor even if further controls are required.
major comments (2)
- [Abstract and Results] Abstract and main results: the interpretation that the imaged micron particles are the dominant noise source is load-bearing, yet the manuscript provides only spatial correlation; no particle-removal experiments, no comparison to identically prepared particle-free electrodes, and no quantitative upper bounds on contributions from unseen contaminants or electrode roughness are described. Without such isolation the correlation alone does not establish causality.
- [Model description] Model section: the loss tangent tanθ=0.33(0.06) is obtained by fitting the lossy-dielectric model directly to the measured noise spectra. Consequently the statement that the model “describes the magnitude … as well as its spatial and frequency dependence” is a post-fit statement rather than an independent, parameter-free prediction from material properties.
minor comments (1)
- [Abstract] Abstract: the summary of the measurements does not mention error bars, raw-data availability, or the criteria used to select the 600 μm section and the trapping locations.
Simulated Author's Rebuttal
We thank the referee for the careful reading and constructive comments on our manuscript. We address each major comment below. Where the points identify limitations in the current evidence, we agree and will revise the text to clarify the scope of our claims.
read point-by-point responses
-
Referee: [Abstract and Results] Abstract and main results: the interpretation that the imaged micron particles are the dominant noise source is load-bearing, yet the manuscript provides only spatial correlation; no particle-removal experiments, no comparison to identically prepared particle-free electrodes, and no quantitative upper bounds on contributions from unseen contaminants or electrode roughness are described. Without such isolation the correlation alone does not establish causality.
Authors: We agree that the primary evidence is a strong spatial correlation between imaged particles and noise hotspots, together with the model's reproduction of position and frequency trends using one fitted parameter. No particle-removal experiments, clean-electrode controls, or quantitative bounds on other sources (e.g., roughness or unseen contaminants) are presented. In the revised manuscript we will explicitly describe the evidence as correlational, tone down causal language in the abstract and conclusions, and outline the control experiments needed to strengthen the claim. revision: yes
-
Referee: [Model description] Model section: the loss tangent tanθ=0.33(0.06) is obtained by fitting the lossy-dielectric model directly to the measured noise spectra. Consequently the statement that the model “describes the magnitude … as well as its spatial and frequency dependence” is a post-fit statement rather than an independent, parameter-free prediction from material properties.
Authors: The effective loss tangent is obtained by a global fit to the measured spectra. Once fixed, the same value is used without further adjustment to account for the observed spatial variation across the trap and the frequency dependence. We will revise the model section and abstract to state clearly that the parameter is fitted and that the model then reproduces the spatial and frequency trends with this single value. revision: yes
Circularity Check
Fitted loss tangent reduces magnitude claim to post-fit statement
specific steps
-
fitted input called prediction
[Abstract]
"We find that modeling the particles as a lossy dielectric with a effective loss tangent tanθ=0.33(0.06) describes the magnitude of the noise, as well as its spatial and frequency dependence."
The effective loss tangent tanθ=0.33(0.06) is obtained by fitting the lossy-dielectric model to the measured noise data. The assertion that this model describes the magnitude of the noise is therefore a direct consequence of the fitting step rather than an independent prediction or first-principles result.
full rationale
The paper's central modeling result fits a single parameter (loss tangent) to noise data and then asserts that the model 'describes the magnitude' along with spatial and frequency dependence. This matches the fitted_input_called_prediction pattern exactly: the magnitude match is forced by construction once the parameter is adjusted to the data. Spatial and frequency agreement may supply limited independent content, but the headline claim about describing magnitude is tautological after fitting. No first-principles material value or external benchmark for tanθ is invoked. The assumption that imaged particles dominate noise is a separate evidentiary issue, not a circularity in the derivation chain itself.
Axiom & Free-Parameter Ledger
free parameters (1)
- effective loss tangent tanθ =
0.33(0.06)
axioms (1)
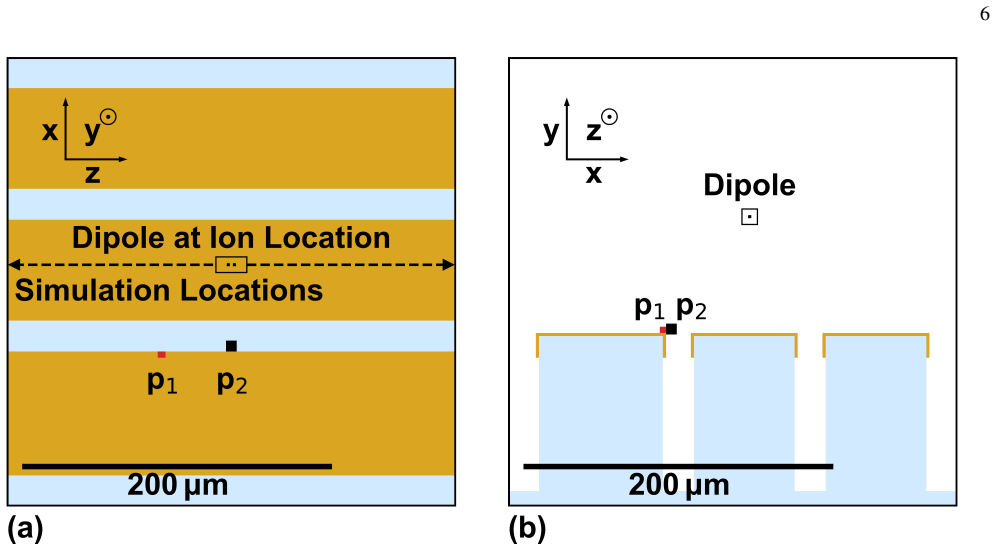
- domain assumption Micron-sized particles act as lossy dielectrics whose loss tangent is spatially uniform and frequency-independent over the measured range.
Reference graph
Works this paper leans on
-
[1]
C. J. Ballance and T. P. Harty and N. M. Linke and M. A. Sepiol and D. M. Lucas , title =. Phys. Rev. Lett. , volume =. 2016 , doi =
2016
-
[2]
T. P. Harty and M. A. Sepiol and D. T. C. Allcock and C. J. Ballance and J. E. Tarlton and D. M. Lucas , title =. Phys. Rev. Lett. , volume =. 2016 , doi =
2016
-
[3]
K. R. Brown and J. Chiaverini and J. M. Sage and H. H. Materials Challenges for Trapped-Ion Quantum Computers , journal =. 2021 , doi =
2021
-
[4]
Brownnutt and M
M. Brownnutt and M. Kumph and P. Rabl and R. Blatt , title =. Rev. Mod. Phys. , volume =. 2015 , doi =
2015
-
[5]
Q. A. Turchette and D. Kielpinski and B. E. King and D. Leibfried and D. M. Meekhof and C. J. Myatt and M. A. Rowe and C. A. Sackett and C. S. Wood and W. M. Itano and C. Monroe and D. J. Wineland , title =. Phys. Rev. A , volume =. 2000 , doi =
2000
-
[6]
P. B. Barna and M. Adamik , title =. Thin Solid Films , volume =. 1998 , doi =
1998
-
[7]
Zhou and W
S. Zhou and W. Wu and T. Shao , title =. Surf. Coat. Technol. , volume =. 2016 , doi =
2016
-
[8]
Palli and S
S. Palli and S. R. Dey , title =. Adv. Mater. Sci. , volume =. 2017 , doi =
2017
-
[9]
Talukdar and D
I. Talukdar and D. J. Gorman and N. Daniilidis and P. Schindler and S. Ebadi and H. Kaufmann and T. Zhang and H. H. Implications of Surface Noise for the Motional Coherence of Trapped Ions , journal =. 2016 , doi =
2016
-
[10]
Daniilidis and S
N. Daniilidis and S. Gerber and G. Bolloten and M. Ramm and A. Ransford and E. Ulin-Avila and I. Talukdar and H. H. Surface Noise Analysis Using a Single-Ion Sensor , journal =. 2014 , doi =
2014
-
[11]
D. A. Hite et al. , title =. Phys. Rev. Lett. , volume =. 2012 , doi =
2012
-
[12]
D. T. C. Allcock et al. , title =. New J. Phys. , volume =. 2011 , doi =
2011
-
[13]
McConnell and C
R. McConnell and C. Bruzewicz and J. Chiaverini and J. Sage , title =. Phys. Rev. A , volume =. 2015 , doi =
2015
-
[14]
C. F. Roos , title =
-
[15]
Berlin-Udi , title =
M. Berlin-Udi , title =
-
[16]
Noel et al
C. Noel et al. , title =. Phys. Rev. A , volume =. 2019 , doi =
2019
-
[17]
Berlin-Udi et al
M. Berlin-Udi et al. , title =. Phys. Rev. B , volume =. 2022 , doi =
2022
-
[18]
Kumph and C
M. Kumph and C. Henkel and P. Rabl and M. Brownnutt and R. Blatt , title =. New J. Phys. , volume =. 2016 , doi =
2016
-
[19]
Nasrin and H
R. Nasrin and H. Kabir and H. Akter and A. H. Bhuiyan , title =. Results Phys. , volume =. 2020 , doi =
2020
-
[20]
J. W. Lee et al. , title =. Sci. Adv. , volume =. 2017 , doi =
2017
-
[21]
Teller et al
M. Teller et al. , title =. Phys. Rev. Lett. , volume =. 2021 , doi =
2021
-
[22]
Springer Handbook of Materials Measurement Methods , year =
Jan Obrzut , title =. Springer Handbook of Materials Measurement Methods , year =
-
[23]
IEEJ Transactions on Electrical and Electronic Engineering , year =
Yoshimichi Ohki , title =. IEEJ Transactions on Electrical and Electronic Engineering , year =. doi:10.1002/tee.23565 , publisher =
-
[24]
IEEJ Transactions on Fundamentals and Materials , year =
Tan, Qi and Irwin, Patricia and Cao, Yang , title =. IEEJ Transactions on Fundamentals and Materials , year =
-
[25]
Selective Laser Etching , year =
-
[26]
Reviews of Modern Physics , volume=
Quantum dynamics of single trapped ions , author=. Reviews of Modern Physics , volume=. 2003 , publisher=
2003
discussion (0)
Sign in with ORCID, Apple, or X to comment. Anyone can read and Pith papers without signing in.