Which Metric Reflects the Spelling Rate Accuracy in Event-Related Potential-Based Brain-Computer Interfaces?
Pith reviewed 2026-07-02 16:04 UTC · model grok-4.3
The pith
Brier score, Matthews correlation coefficient, and imbalance-aware metrics best reflect spelling rate in ERP-based brain-computer interfaces.
A machine-rendered reading of the paper's core claim, the machinery that carries it, and where it could break.
Core claim
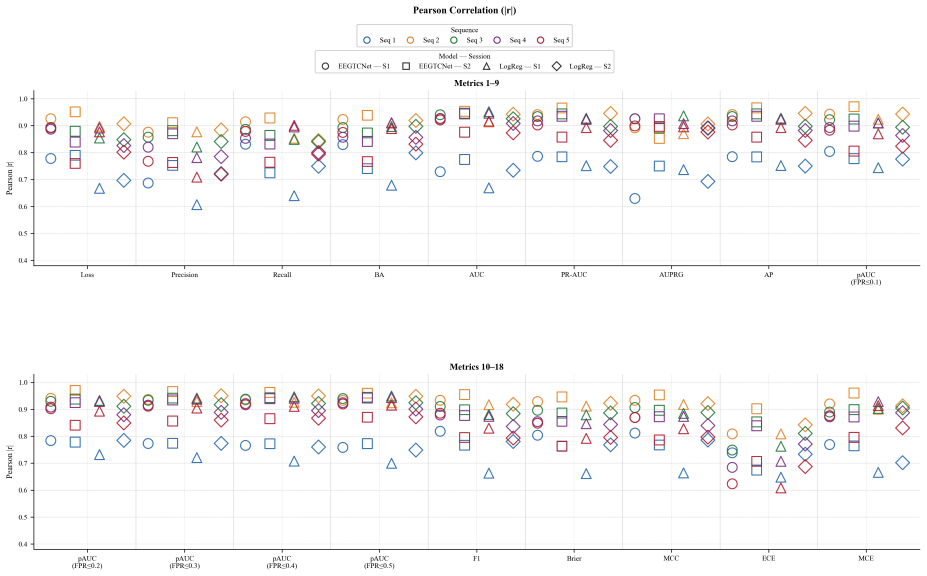
Results from the LARESI ERP dataset and the OpenBMI ERP dataset show that spelling rate correlates most strongly with the Brier score, Matthews Correlation Coefficient, and the class-imbalance-aware metrics ROC AUC, PR AUC, Average Precision, and partial AUC. These metrics outperform accuracy and loss when trial repetition is varied, because they better capture the binary classification task of detecting event-related potentials amid dominant non-target trials.
What carries the argument
Correlation analysis of spelling rate against 13 metrics, evaluated at different numbers of trial repetitions on two ERP datasets.
If this is right
- ERP-BCI papers should report Brier score and Matthews correlation coefficient alongside or instead of accuracy.
- Imbalance-aware metrics give a more faithful estimate of how many characters a user can spell correctly per minute.
- Model selection and hyper-parameter tuning in ERP-BCI should prioritize these metrics when spelling rate is the ultimate goal.
- Information transfer rate calculations will be more reliable when based on the recommended metrics rather than raw accuracy.
Where Pith is reading between the lines
- Adopting these metrics could change which models are considered state-of-the-art in the ERP-BCI literature.
- Online, closed-loop BCI experiments might reveal different correlation patterns than the offline analyses performed here.
- The same metric comparison could be applied to other imbalanced BCI paradigms such as motor imagery or steady-state visual evoked potentials.
Load-bearing premise
The correlations found between spelling rate and the recommended metrics in these two datasets will hold for other users, paradigms, and hardware.
What would settle it
A new ERP-BCI dataset in which accuracy or cross-entropy loss shows higher correlation with spelling rate than the Brier score or ROC AUC across multiple repetition counts.
Figures

read the original abstract
For predictive models, the often-reported performance metrics are the loss and accuracy. In synchronous Brain- Computer Interface (BCI) systems, these metrics are informative for most BCI paradigms; however, for Event-Related Potential (ERP) applications the spelling rate, which measures the number of characters correctly selected is more important as it influences the estimation of information transfer rate (ITR) and any related metric measuring spelling performance. Moreover, ERP-based BCIs hold imbalanced data class distributions, which require reporting metrics that can handle the imbalance, such as the area under the receiver operating characteristic curve (ROC AUC). In this work, we study the correlation of the spelling rate with 13 metrics to identify which among them best reflect user spelling performance and how they are affected by trial repetition. The Results of two datasets (a private LARESI ERP dataset and the public OpenBMI ERP dataset) favor the Brier score, Matthews Correlation Coefficient (MCC), and the metrics that account for class imbalance in binary classification: ROC AUC, area under the Precision-Recall curve (PR AUC), Average Precision (AP), and partial AUC (pAUC). These findings encourage researchers and practitioners to report those metrics in ERP-based BCI experiments.
Editorial analysis
A structured set of objections, weighed in public.
Referee Report
Summary. The paper examines correlations between spelling rate (as ground-truth performance) and 13 classification metrics across two ERP-BCI datasets (private LARESI and public OpenBMI). It reports that Brier score, MCC, ROC AUC, PR AUC, AP, and pAUC show the strongest correlations and best handle class imbalance, and therefore encourages researchers to report these metrics in ERP-based BCI experiments.
Significance. If the reported correlations prove robust, the study supplies concrete empirical guidance for metric choice in imbalanced ERP classification, where spelling rate directly affects ITR estimates. The inclusion of a public dataset alongside a private one is a positive step toward reproducibility.
major comments (2)
- [Results] Results section: the recommendation to report Brier score, MCC, ROC AUC, PR AUC, AP, and pAUC in ERP-BCI experiments rests on correlations observed in only the LARESI and OpenBMI collections; no cross-dataset validation, meta-analysis, or sensitivity check to paradigm/hardware variation is described that would support generalizing the ranking beyond these two datasets.
- [Discussion] Discussion/Conclusion: spelling rate is adopted as the sole reference without independent justification or comparison to alternative ground-truth measures (e.g., ITR variants or user-reported usability), which is load-bearing for the claim that the favored metrics 'best reflect' spelling performance.
minor comments (2)
- [Abstract] Abstract and Methods: the manuscript provides no numerical values for subject counts, correlation coefficients, p-values, or multiple-comparison corrections, making it impossible to judge the statistical support for the metric ranking.
- [Title] Notation: the distinction between 'spelling rate accuracy' in the title and the spelling-rate quantity used in the correlations should be clarified to avoid reader confusion.
Simulated Author's Rebuttal
We thank the referee for the constructive comments on our manuscript. We address each major comment below with honest responses based on the scope and content of the study. We agree that certain limitations should be more explicitly discussed and will revise the manuscript accordingly.
read point-by-point responses
-
Referee: [Results] Results section: the recommendation to report Brier score, MCC, ROC AUC, PR AUC, AP, and pAUC in ERP-BCI experiments rests on correlations observed in only the LARESI and OpenBMI collections; no cross-dataset validation, meta-analysis, or sensitivity check to paradigm/hardware variation is described that would support generalizing the ranking beyond these two datasets.
Authors: We thank the referee for highlighting this point. The study is an empirical correlation analysis performed separately on each of the two datasets (private LARESI and public OpenBMI) to identify which metrics track spelling rate within those collections. While the top-performing metrics were consistent across both, we did not perform cross-dataset validation, meta-analysis, or explicit sensitivity checks to additional paradigm or hardware variations, as that was outside the stated scope. We agree this limits claims of broad generalizability. In the revised manuscript we will expand the Discussion to explicitly state this limitation and recommend future work involving additional datasets and sensitivity analyses. revision: partial
-
Referee: [Discussion] Discussion/Conclusion: spelling rate is adopted as the sole reference without independent justification or comparison to alternative ground-truth measures (e.g., ITR variants or user-reported usability), which is load-bearing for the claim that the favored metrics 'best reflect' spelling performance.
Authors: Spelling rate was selected as the reference because the paper focuses on synchronous ERP spelling BCIs, where the number of correctly selected characters is the direct performance outcome that determines ITR and practical utility (as noted in the Abstract and Introduction). This choice aligns with standard practice in the ERP-BCI spelling literature. We did not include comparisons to ITR variants or usability measures, as the goal was to correlate classification metrics against this primary spelling outcome rather than to validate alternative ground truths. We acknowledge that adding explicit justification would strengthen the manuscript. In revision we will insert a short paragraph in the Discussion providing references to prior BCI work that motivates spelling rate as the key reference and noting that exploration of alternatives lies beyond the current scope. revision: yes
Circularity Check
Purely empirical correlation study with no derivation chain
full rationale
The paper reports observed correlations between spelling rate and 13 classification metrics on two fixed datasets (LARESI and OpenBMI). No equations, derivations, fitted parameters renamed as predictions, or self-citation chains appear in the provided text. The central claim is an empirical ranking of metrics by correlation strength; it does not reduce to its inputs by construction. This is the expected non-finding for a dataset-driven empirical study.
Axiom & Free-Parameter Ledger
axioms (1)
- domain assumption Spelling rate is the most important performance measure in ERP-BCI because it influences ITR estimation.
Reference graph
Works this paper leans on
-
[1]
An accurate and rapidly calibrating speech neuro- prosthesis,
N. S. Cardet al., “An accurate and rapidly calibrating speech neuro- prosthesis,”N. Engl. J. Med., vol. 391, no. 7, pp. 609–618, Aug. 2024
work page 2024
-
[2]
Inner speech in motor cortex and implications for speech neuroprostheses,
E. M. Kunzet al., “Inner speech in motor cortex and implications for speech neuroprostheses,”Cell, vol. 188, no. 17, pp. 4658–4673, Aug. 2025
work page 2025
-
[3]
A step-by-step tutorial for a motor imagery–based BCI,
H. Cho, M. Ahn, M. Kwon, and S. C. Jun, “A step-by-step tutorial for a motor imagery–based BCI,” inBrain–Computer Interfaces Handbook. Boca Raton: CRC Press, 2018, pp. 445–460
work page 2018
-
[4]
J. Kalraet al., “How visual stimuli evoked P300 is transforming the brain-computer interface landscape: A PRISMA compliant systematic review,”IEEE Trans. Neural Syst. Rehabil. Eng., vol. 31, pp. 1429– 1439, 2023
work page 2023
-
[5]
Towards solving of the illiteracy phenomenon for VEP-based brain- computer interfaces,
I. V olosyak, A. Rezeika, M. Benda, F. Gembler, and P. Stawicki, “Towards solving of the illiteracy phenomenon for VEP-based brain- computer interfaces,”Biomed. Phys. Eng. Express, vol. 6, no. 3, May 2020
work page 2020
-
[6]
Systems, subjects, sessions: To what extent do these factors influence EEG data?,
A. Melniket al., “Systems, subjects, sessions: To what extent do these factors influence EEG data?,”Front. Hum. Neurosci., vol. 11, pp. 1–20, 2017
work page 2017
-
[7]
Mind the traps! Design guidelines for rigorous BCI experiments,
C. Jeunetet al., “Mind the traps! Design guidelines for rigorous BCI experiments,” inBrain–Computer Interfaces Handbook. Boca Raton: CRC Press, 2018, pp. 613–634
work page 2018
-
[8]
Is it significant? Guidelines for reporting BCI per- formance,
M. Billingeret al., “Is it significant? Guidelines for reporting BCI per- formance,” inTowards Practical Brain-Computer Interfaces. Springer, 2012, pp. 333–354
work page 2012
-
[9]
D. E. Thompson, S. Blain-Moraes, and J. E. Huggins, “Performance as- sessment in brain-computer interface-based augmentative and alternative communication,”Biomed. Eng. Online, vol. 12, no. 1, 2013
work page 2013
-
[10]
Performance measurement for brain–computer or brain–machine interfaces: A tutorial,
D. E. Thompsonet al., “Performance measurement for brain–computer or brain–machine interfaces: A tutorial,”J. Neural Eng., vol. 11, no. 3, p. 035001, 2014
work page 2014
-
[11]
T. Kaufmannet al., “Face stimuli effectively prevent brain-computer interface inefficiency in patients with neurodegenerative disease,”Clin. Neurophysiol., vol. 124, no. 5, pp. 893–900, 2013
work page 2013
-
[12]
An efficient ERP- based brain-computer interface using random set presentation and face familiarity,
S.-K. Yeom, S. Fazli, K.-R. M ¨uller, and S.-W. Lee, “An efficient ERP- based brain-computer interface using random set presentation and face familiarity,”PLoS One, vol. 9, no. 11, p. e111157, Nov. 2014
work page 2014
-
[13]
P. Yuan, X. Gao, B. Allison, Y . Wang, G. Bin, and S. Gao, “A study of the existing problems of estimating the information transfer rate in online brain–computer interfaces,”J. Neural Eng., vol. 10, no. 2, p. 026014, Apr. 2013
work page 2013
-
[14]
An auditory oddball (P300) spelling system for brain- computer interfaces,
A. Furdeaet al., “An auditory oddball (P300) spelling system for brain- computer interfaces,”Psychophysiology, vol. 46, no. 3, pp. 617–625, May 2009
work page 2009
-
[15]
G. Townsendet al., “A novel P300-based brain-computer interface stimulus presentation paradigm: Moving beyond rows and columns,” Clin. Neurophysiol., vol. 121, no. 7, pp. 1109–1120, Jul. 2010
work page 2010
-
[16]
L. R. Quitadamoet al., “Evaluation of the performances of different P300 based brain–computer interfaces by means of the efficiency met- ric,”J. Neurosci. Methods, vol. 203, no. 2, pp. 361–368, Jan. 2012
work page 2012
-
[17]
Z. Wang, H. Hu, T. Zhou, T. Xu, and X. Zhao, “Average time con- sumption per character: A practical performance metric for generic synchronous BCI spellers,”IEEE Trans. Biomed. Eng., vol. 71, no. 9, pp. 2684–2698, 2024
work page 2024
-
[18]
Classifier-based latency estimation: A novel way to estimate and predict BCI accuracy,
D. E. Thompson, S. Warschausky, and J. E. Huggins, “Classifier-based latency estimation: A novel way to estimate and predict BCI accuracy,” J. Neural Eng., vol. 10, no. 1, 2013
work page 2013
-
[19]
Projected accuracy metric for the P300 speller,
K. Colwell, C. Throckmorton, L. Collins, and K. Morton, “Projected accuracy metric for the P300 speller,”IEEE Trans. Neural Syst. Rehabil. Eng., vol. 22, no. 5, pp. 921–925, 2014
work page 2014
-
[20]
Evaluating machine learning models and their diagnostic value,
G. Varoquaux and O. Colliot, “Evaluating machine learning models and their diagnostic value,” inNeuromethods, O. Colliot, Ed. New York, NY: Springer, 2023, pp. 601–630
work page 2023
-
[21]
The balanced accuracy and its posterior distribution,
K. H. Brodersen, C. S. Ong, K. E. Stephan, and J. M. Buhmann, “The balanced accuracy and its posterior distribution,” inProc. 20th Int. Conf. Pattern Recognit., Aug. 2010, pp. 3121–3124
work page 2010
-
[22]
D. Chicco and G. Jurman, “The advantages of the Matthews correlation coefficient (MCC) over F1 score and accuracy in binary classification evaluation,”BMC Genomics, vol. 21, no. 1, p. 6, Dec. 2020
work page 2020
-
[23]
An introduction to ROC analysis,
T. Fawcett, “An introduction to ROC analysis,”Pattern Recognit. Lett., vol. 27, no. 8, pp. 861–874, Jun. 2006
work page 2006
-
[24]
T. Saito and M. Rehmsmeier, “The precision-recall plot is more informa- tive than the ROC plot when evaluating binary classifiers on imbalanced datasets,”PLoS One, vol. 10, no. 3, p. e0118432, Mar. 2015
work page 2015
-
[25]
Recall, precision and average precision,
M. Zhu, “Recall, precision and average precision,”Dep. Stat. Actuar . Sci., pp. 1–11, 2004
work page 2004
-
[26]
Precision-recall-gain curves: PR analysis done right,
P. Flach and M. Kull, “Precision-recall-gain curves: PR analysis done right,” inAdv. Neural Inf. Process. Syst., 2015
work page 2015
-
[27]
Partial AUC estimation and regression,
L. E. Dodd and M. S. Pepe, “Partial AUC estimation and regression,” Biometrics, vol. 59, no. 3, pp. 614–623, Sep. 2003
work page 2003
-
[28]
Supervised learning of probability distribu- tions by neural networks,
E. Baum and F. Wilczek, “Supervised learning of probability distribu- tions by neural networks,” inNeural Inf. Process. Syst., 1987
work page 1987
-
[29]
Verification of forecasts expressed in terms of probability,
G. W. Brier, “Verification of forecasts expressed in terms of probability,” Mon. Weather Rev., vol. 78, no. 1, pp. 1–3, Jan. 1950
work page 1950
-
[30]
On calibration of modern neural networks,
C. Guo, G. Pleiss, Y . Sun, and K. Q. Weinberger, “On calibration of modern neural networks,” inProc. 34th Int. Conf. Mach. Learn., 2017, pp. 2130–2143
work page 2017
-
[31]
O. Bekhelifi, N.-E. Berrached, and A. Bendahmane, “Effects of the presentation order of stimulations in sequential ERP/SSVEP hybrid brain-computer interface,”Biomed. Phys. Eng. Express, vol. 10, no. 3, p. 035009, May 2024
work page 2024
-
[32]
EEG dataset and OpenBMI toolbox for three BCI paradigms: An investigation into BCI illiteracy,
M. H. Leeet al., “EEG dataset and OpenBMI toolbox for three BCI paradigms: An investigation into BCI illiteracy,”Gigascience, vol. 8, no. 5, May 2019
work page 2019
-
[33]
xDAWN algorithm to enhance evoked potentials: Application to brain-computer interface,
B. Rivet, A. Souloumiac, V . Attina, and G. Gibert, “xDAWN algorithm to enhance evoked potentials: Application to brain-computer interface,” IEEE Trans. Biomed. Eng., vol. 56, no. 8, pp. 2035–2043, Aug. 2009
work page 2035
-
[34]
T. M. Ingolfssonet al., “EEG-TCNet: An accurate temporal convolu- tional network for embedded motor-imagery brain–machine interfaces,” inProc. IEEE Int. Conf. Syst., Man, Cybern., Oct. 2020, pp. 2958–2965. 6
work page 2020
discussion (0)
Sign in with ORCID, Apple, or X to comment. Anyone can read and Pith papers without signing in.