REVIEW 4 major objections 6 minor 56 references
On the Existence of Simpler Machine Learning Models
T0 review · 4 major / 6 minor · reviewed 2026-08-14 · deepseek-v4-flash
Pith's one-line read This paper argues that simple, accurate models are likely to exist whenever the Rashomon set—the set of almost-equally-accurate models—is large, and introduces the Rashomon ratio and curve to detect this before searching.
desk verdict New framing for why simple models exist, with honest conditional theory; the empirical estimator is too fragile to support the headline quantitative claims, but the paper deserves a serious referee. read the letter →
The pith
A machine-rendered reading of the paper's core claim, the machinery that carries it, and where it could break.
The reading
What carries the argument
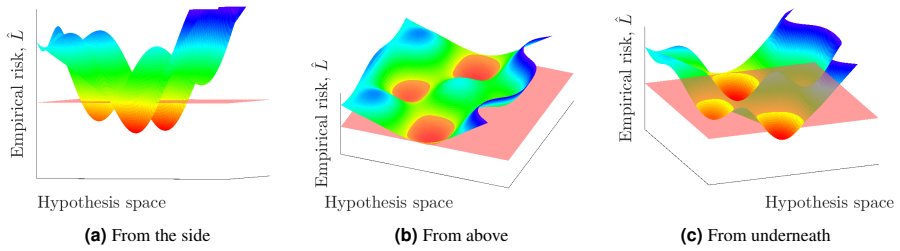
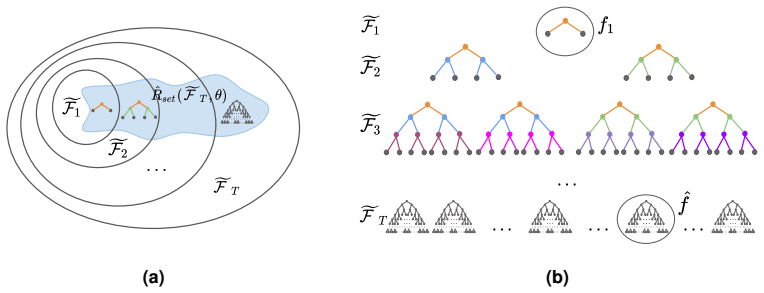
The Rashomon set and its normalized version, the Rashomon ratio, are the load-bearing objects. The Rashomon set is $\hat{R}_{\mathrm{set}}(\mathcal{F},\theta)=\{f\in\mathcal{F}: \hat{L}(f)\le \hat{L}(\hat{f})+\theta\}$—the models within $\theta$ of the best training loss—and the ratio is $V(\hat{R}_{\mathrm{set}}(\mathcal{F},\theta))/V(\mathcal{F})$, the fraction of the hypothesis space that is almost-optimal. The argument runs on two levers: approximation and smoothness. If the simple class $\mathcal{F}_1$ $\delta$-covers the Rashomon set of $\mathcal{F}_2$ and the loss is $K$-Lipschitz, then each packing ball in the Rashomon set contains an $\mathcal{F}_1$ model, which is what yields the existence and generalization statements of Theorems 9 and 10. To make the ratio measurable, the paper supplies a closed-form ellipsoid volume for ridge regression, a pattern-based ratio that groups models by prediction vectors and converges to a binomial-entropy limit as the model class grows, and importance-sampling estimators for tree classes; the empirical Rashomon curve then connects empirical risk to log Rashomon ratio along a hierarchy and locates the Rashomon elbow.
What would settle it
Recompute the Rashomon ratios for the same 38 data sets using a different proposal distribution (for example, random leaf labels as well as random splits, or trees of depth 9 instead of 7) and check whether the ordering of data sets by ratio—and especially the large-versus-small boundary near $10^{-37}\%$—survives; if the ordering flips for even a handful of data sets, the empirical link between large ratios and similar cross-algorithm performance is an artifact of the estimator rather than a property of the data.
Extended reading notes
Core claim
The paper's central claim is that the size of the Rashomon set is a data-dependent gauge of how easy it is to find simple, accurate models. Formally, for finite hypothesis spaces $\mathcal{F}_1\subset\mathcal{F}_2$, if the true Rashomon set of $\mathcal{F}_2$ at tolerance $\gamma$ contains even one model from $\mathcal{F}_1$, then the best empirical model in $\mathcal{F}_1$ has training risk within $\gamma$ plus a small sample term of the best true risk in $\mathcal{F}_2$ (Theorem 3); if $\mathcal{F}_1$ is sampled randomly from $\mathcal{F}_2$, a sufficiently large true Rashomon ratio makes this event likely (Theorems 4 and 6). For the empirical Rashomon set, Theorem 9 proves that when the loss is $K$-Lipschitz and every model in $\hat{R}_{\mathrm{set}}(\mathcal{F}_2,\theta)$ is within $\delta$ of some $\mathcal{F}_1$ model, then at least $\mathcal{B}(\hat{R}_{\mathrm{set}}(\mathcal{F}_2,\theta),2\delta)$ models from $\mathcal{F}_1$ lie in the Rashomon set and each has $|L(\bar{f}_1)-\hat{L}(\bar{f}_1)|\le 2K R_n(\mathcal{F}_1)+ b\sqrt{\log(2/\varepsilon)/(2n)}$. Theorem 10 extends the same reasoning to bound generalization for every model in $\mathcal{F}_2$'s Rashomon set using only the complexity of $\mathcal{F}_1$, meaning a large Rashomon set with a good simple approximating class makes the whole problem simpler than a naive analysis suggests. The paper also derives a closed-form Rashomon volume for ridge regression, an entropy-bounded pattern Rashomon ratio for classification, and the empirical Rashomon curve.
Load-bearing premise
The empirical claim that large Rashomon sets are common rests on treating depth-seven decision trees as a stand-in for the true union of the five algorithms' hypothesis spaces and on an importance-sampling estimate whose proposal weights set the scale for what counts as large; if either is unrepresentative, the observed ordering of large versus small ratios could change.
Editorial extensions
If this is right
- A practitioner who sees several standard algorithms agree in training and test accuracy can treat that agreement as an indirect signal of a large Rashomon set, making it worth searching for interpretable or sparse models before assuming they do not exist.
- Under $K$-Lipschitz loss and a $\delta$-covering simple class, a large empirical Rashomon set guarantees not just one but many simple-yet-accurate models, each with a generalization bound that uses only the simple class's Rademacher complexity.
- The Rashomon elbow, chosen from training data alone, balances empirical risk against Rashomon ratio and, in the 52 data sets studied, generalized as well as or better than the other hypothesis spaces in the hierarchy.
- Because the Rashomon ratio depends on both the data set and the hypothesis space and tracks multiplicity of models, it captures aspects of simplicity that VC dimension, stability, margins, and Rademacher complexity leave out.
- In ridge regression, the Rashomon volume can be written in closed form as an ellipsoid whose size depends on the feature matrix's singular values but not on the target values, so the simplicity gauge can be computed exactly for this class.
Reading between the lines
- A direct test of the paper's practical thesis would be to run a large library of data sets through two cheap probes—cross-algorithm accuracy agreement and average pairwise prediction disagreement—and compare those probes with a directly estimated Rashomon ratio; if the correlation is strong, the ratio itself becomes unnecessary for routine model selection.
- Because the absolute magnitudes of the reported Rashomon ratios are set by the importance-sampling proposal (per-tree weights around $3\times10^{-39}$), the robust content is the ordering of data sets and the within-hierarchy shape of the Rashomon curve; cross-paper comparisons of raw ratio values will require a normalized estimator.
- The $\Gamma$-shape suggests a decision rule for benchmark progress: problems for which all modern algorithms saturate in accuracy sit on the vertical part of the curve, where effort should go into finding simpler models inside the Rashomon set, while problems where accuracy still climbs with model complexity sit on the horizontal part, where more complex classes still have room.
Signed reviews
Editorial analysis
A structured set of objections, weighed in public.
Referee Report
Summary. The paper introduces the Rashomon set and Rashomon ratio as data-dependent measures of model multiplicity, and argues that a large Rashomon set for a complex hypothesis space can certify the existence of simpler, accurate models that generalize. The theoretical part defines the empirical and true Rashomon sets, proves generalization and existence results for simpler classes (Theorems 3, 4, 6, 9, 10), gives a closed-form Rashomon volume for ridge regression (Theorem 11), and introduces the pattern Rashomon ratio (Definition 12, Proposition 13). The experimental part estimates Rashomon ratios for depth-seven decision trees on 38 UCI classification datasets, reports that large estimated ratios correlate with similar performance across five algorithms, observes a universal Gamma-shaped Rashomon curve over tree-depth hierarchies, and proposes the Rashomon elbow as a model-selection criterion.
Significance. If the empirical claims hold, the paper provides a genuinely new, data-dependent perspective on model simplicity and multiplicity, distinct from VC dimension, stability, margins, and Rademacher complexity. The closed-form ridge-regression volume and the approximating-set generalization bounds are coherent and useful contributions, and the Rashomon curve is a falsifiable empirical prediction. The significance is currently conditional, however, because the headline empirical conclusions rest on an unvalidated surrogate hypothesis space and on an importance-sampling estimator whose absolute scale and large/small dichotomy are not shown to be robust. The paper is transparent about several of these limitations, which is a strength, but the experiments as presented do not yet support the strength of the practical conclusions drawn in Sections 6, 8, and 9.
major comments (4)
- [Section 5.3, Supplementary Information H] The importance-sampling estimator is the sole basis for the Rashomon-ratio values used in Section 6 and Figure 5, yet the paper reports no confidence intervals, effective sample sizes, or proposal-sensitivity results. As the authors state in Supplementary H, every sampled depth-seven tree carries the same importance weight 2^{-128} ≈ 3×10^{-39}, so the reported ratios are rescaled acceptance rates; a different proposal distribution would change the estimated size. The paper therefore does not establish that the dichotomy between 'large' ratios (around 10^{-37}%) and 'small' ratios (below 10^{-40}%) is robust, and this dichotomy drives the central empirical correlation claim. Please report effective sample sizes and confidence intervals, and verify that the large/small ordering and the Section 6 correlations are stable under alternative proposal distributions.
- [Section 6] The surrogate choice of depth-seven decision trees for F2, described as the union of the hypothesis spaces of logistic regression, CART, random forests, gradient boosted trees, and SVMs, is not validated. The theorems used to interpret the experiments, particularly Theorems 9 and 10, require that a simpler class F1 delta-covers the empirical Rashomon set of F2; nothing in Section 6 checks this cover condition or checks that depth-seven trees attain training risk within theta=0.05 of the union space's best model. The paper acknowledges that the surrogate is an empirical observation about 38 tabular datasets, but the headline conclusion—that similar performance across algorithms signals a large Rashomon set—concerns the union space, not depth-seven trees. Please provide at least a partial validation of the surrogate on several datasets, for example by comparing the training risk of depth-seven trees with the best algorithm in F2 and by checking whether simpler classes satisfy the delta-cover condition on the measured empirical Rashomon set.
- [Sections 4.1 and 6] The theoretical results that motivate the experiments, Theorems 3, 4, and 6, concern the true population Rashomon set, whereas the experiments estimate an empirical Rashomon ratio for a surrogate class. Propositions 7 and 8 only connect true and empirical anchored Rashomon sets for a fixed model, not for the full Rashomon set or for the ratios plotted in Figure 5. Thus the inference from 'the estimated empirical Rashomon ratio is large' to 'the conditions of Theorem 3 hold' is not justified by the stated results. The paper says it is using the empirical ratio as a surrogate for the true ratio, but no high-probability bound relating the two quantities for the function classes used is provided. Please either derive such a bound, or explicitly reframe the experimental conclusions as statements about the empirical Rashomon set of the surrogate class rather than about the true Rashomon set of F2.
- [Section 8.2, Definition 16, Figure 9] The paper states that the Rashomon elbow 'either helps, or has no effect, but never achieves worse performance than other possible choices,' but the supporting evidence is visual and based on selected examples. No numerical comparison is reported across the 38 datasets, and the elbow is not compared with standard model-selection baselines such as validation-error minimization. Because the abstract and Section 9 present the elbow as a reliable model-selection criterion, please provide quantitative results, such as mean and median test error, win/tie/loss counts against alternatives, and an explicit statement of how many datasets fall into each of the three categories in Figure 9.
minor comments (6)
- [Section 4.1.1, Theorem 4] The expression for p uses binomial coefficients with (1 - Rratio(F2, gamma))|F2|, which is not an integer in general; please clarify that the formula should be read with rounding or state that Rratio is assumed to make the relevant quantities integers.
- [Section 4.1, Theorem 3 proof] The proof refers to f*_1 as an optimal function in F1, but this symbol is not defined in the theorem statement; please define it explicitly.
- [Section 4.2, Theorem 9] The theorem statement says the constructed functions lie in \hat Rset(F, \theta) without specifying F; from the context this should be \hat Rset(F2, \theta), and item 1 should clarify that they are in F1. Please fix the notation.
- [Section 8.1] The text says all Rashomon curves for all 38 datasets follow the same trend, but then notes that some curves exhibit only the vertical or only the horizontal part; please consistently state that the observed curves are full or partial Gamma-shaped trends.
- [Section 5.2] The text refers to 'the pattern Rashomon ratio defined in (12)', but Definition 12 is not numbered as an equation; please refer to Definition 12 instead.
- [Section 4.1] There is a typo, 'Occham’s razor', which should be 'Occam’s razor'.
Circularity Check
No significant circularity: the Rashomon ratio is a new definition, the formal results are conditional theorems proved from explicit assumptions, and the empirical correlations are presented as empirical observations rather than derived from the definitions.
full rationale
The paper's central formal results are conditional theorems, not circular re-statements. Definitions 1 and 2 define the Rashomon set and ratio as volume fractions of models within a threshold of the empirical risk minimizer; Theorems 3-10 prove generalization and existence-of-simpler-model results under explicit assumptions (e.g., a member of F1 lies in the true Rashomon set, F1 is a delta-cover of the Rashomon set of F2, the loss is K-Lipschitz and bounded). The conclusions are not assumed in the inputs: for instance, Theorem 9's conclusion that at least B(Rset(F2,theta),2delta) simpler models generalize follows from the cover assumption plus standard Rademacher bounds, and the cover condition is stated as a hypothesis rather than inferred from the definition of the Rashomon ratio. The empirical section explicitly acknowledges that depth-seven decision trees are a 'surrogate' for the union space F2 and that the suitability of this surrogate 'is an empirical observation'; similarly, the sensitivity of the estimated ratios to the importance-sampling proposal is disclosed in Supplementary H. These are estimation and approximation limitations, not definitional equivalences. Self-citations to Fisher, Rudin, and Dominici (2019) and to Tulabandhula and Rudin are contextual background; the one borrowed intuition (Proposition 8) is independently proved via Hoeffding in Supplementary D.5, so the self-citation is not load-bearing. There are some proof-presentation gaps (e.g., Theorem 22 is stated without a full theorem statement, and Theorem 9's proof does not fully spell out the Lipschitz-based membership check), but these are correctness risks, not circularity. No step in the paper reduces a claimed prediction to an input by construction.
Assumptions & free parameters
free parameters (3)
- theta (Rashomon parameter) =
0.05 for classification, 0.1 * Lhat(f_t) for regression
- C (ridge regularization) =
0.01
- Number of principal components =
3
assumptions (7)
- domain assumption Loss is bounded in [0,b] and data are drawn i.i.d. from an unknown distribution
- domain assumption Loss is K-Lipschitz with respect to the function norm
- domain assumption The simpler class F1 is a delta-cover of the Rashomon set of F2
- domain assumption The true Rashomon set of F2 contains at least one function from F1
- ad hoc to paper Depth-seven decision trees serve as a surrogate for the union hypothesis space of the five algorithms
- domain assumption For the pattern Rashomon ratio limit, the hypothesis space becomes flexible enough to realize every label pattern
- domain assumption The feature Gram matrix is positive definite, obtained via PCA in ridge experiments
invented entities (2)
-
Rashomon ratio
-
Rashomon curve and Rashomon elbow
Cite this review
Pith. "Pith review of On the Existence of Simpler Machine Learning Models." pith.science (2026). https://pith.science/paper/HDFNW3WL
@misc{pith2026190801755,
  author       = {Pith},
  title        = {Pith review of: On the Existence of Simpler Machine Learning Models},
  year         = {2026},
  howpublished = {\url{https://pith.science/paper/HDFNW3WL}},
  note         = {Machine review of arXiv:1908.01755}
}
read the original abstract
It is almost always easier to find an accurate-but-complex model than an accurate-yet-simple model. Finding optimal, sparse, accurate models of various forms (linear models with integer coefficients, decision sets, rule lists, decision trees) is generally NP-hard. We often do not know whether the search for a simpler model will be worthwhile, and thus we do not go to the trouble of searching for one. In this work, we ask an important practical question: can accurate-yet-simple models be proven to exist, or shown likely to exist, before explicitly searching for them? We hypothesize that there is an important reason that simple-yet-accurate models often do exist. This hypothesis is that the size of the Rashomon set is often large, where the Rashomon set is the set of almost-equally-accurate models from a function class. If the Rashomon set is large, it contains numerous accurate models, and perhaps at least one of them is the simple model we desire. In this work, we formally present the Rashomon ratio as a new gauge of simplicity for a learning problem, depending on a function class and a data set. The Rashomon ratio is the ratio of the volume of the set of accurate models to the volume of the hypothesis space, and it is different from standard complexity measures from statistical learning theory. Insight from studying the Rashomon ratio provides an easy way to check whether a simpler model might exist for a problem before finding it, namely whether several different machine learning methods achieve similar performance on the data. In that sense, the Rashomon ratio is a powerful tool for understanding why and when an accurate-yet-simple model might exist. If, as we hypothesize in this work, many real-world data sets admit large Rashomon sets, the implications are vast: it means that simple or interpretable models may often be used for high-stakes decisions without losing accuracy.
Figures


Figures from the paper (8 more)




Reference graph
Works this paper leans on
-
[1]
Certifiably optimal rule lists for categorical data
Elaine Angelino, Nicholas Larus-Stone, Daniel Alabi, Margo Seltzer, and Cynthia Rudin. Certifiably optimal rule lists for categorical data. Journal of Machine Learning Research, 18: 0 1--78, 2018
work page 2018
-
[2]
Julia Angwin, Jeff Larson, Surya Mattu, and Lauren Kirchner. Machine bias. Available from:, May 2016
work page 2016
-
[3]
Rademacher and G aussian complexities: Risk bounds and structural results
Peter L Bartlett and Shahar Mendelson. Rademacher and G aussian complexities: Risk bounds and structural results. Journal of Machine Learning Research, 3 0 (Nov): 0 463--482, 2002
work page 2002
-
[4]
Local R ademacher complexities
Peter L Bartlett, Olivier Bousquet, Shahar Mendelson, et al. Local R ademacher complexities. The Annals of Statistics, 33 0 (4): 0 1497--1537, 2005
work page 2005
-
[5]
Stability and generalization
Olivier Bousquet and Andr \'e Elisseeff. Stability and generalization. Journal of machine learning research, 2 0 (Mar): 0 499--526, 2002
2002
-
[6]
Statistical modeling: The two cultures (with comments and a rejoinder by the author)
Leo Breiman et al. Statistical modeling: The two cultures (with comments and a rejoinder by the author). Statistical science, 16 0 (3): 0 199--231, 2001
work page 2001
-
[7]
A tutorial on support vector machines for pattern recognition
Christopher JC Burges. A tutorial on support vector machines for pattern recognition. Data mining and knowledge discovery, 2 0 (2): 0 121--167, 1998
work page 1998
-
[8]
Multi-class L 2, 1-norm support vector machine
Xiao Cai, Feiping Nie, Heng Huang, and Chris Ding. Multi-class L 2, 1-norm support vector machine. In Data Mining (ICDM), 2011 IEEE 11th International Conference on, pages 91--100. IEEE, 2011
work page 2011
Show all 56 references
-
[9]
The estimate for approximation error of neural networks: A constructive approach
Feilong Cao, Tingfan Xie, and Zongben Xu. The estimate for approximation error of neural networks: A constructive approach. Neurocomputing, 71 0 (4-6): 0 626--630, 2008
2008
-
[10]
Intelligible models for healthcare: Predicting pneumonia risk and hospital 30-day readmission
Rich Caruana, Yin Lou, Johannes Gehrke, Paul Koch, Mark Sterm, and No\'emie Elhadad. Intelligible models for healthcare: Predicting pneumonia risk and hospital 30-day readmission. In Proceedings of Knowledge Discovery in Databases ( KDD ) , pages 1721--1730, 2015
2015
-
[11]
Entropy- SGD : Biasing gradient descent into wide valleys
Pratik Chaudhari, Anna Choromanska, Stefano Soatto, Yann LeCun, Carlo Baldassi, Christian Borgs, Jennifer Chayes, Levent Sagun, and Riccardo Zecchina. Entropy- SGD : Biasing gradient descent into wide valleys. arXiv preprint arXiv:1611.01838, 2016
2016 arXiv
-
[12]
An interpretable model with globally consistent explanations for credit risk
Chaofan Chen, Kancheng Lin, Cynthia Rudin, Yaron Shaposhnik, Sijia Wang, and Tong Wang. An interpretable model with globally consistent explanations for credit risk. In Proceedings of NeurIPS 2018 Workshop on Challenges and Opportunities for AI in Financial Services: the Impac...
2018
-
[13]
A theory of statistical inference for ensuring the robustness of scientific results
Beau Coker, Cynthia Rudin, and Gary King. A theory of statistical inference for ensuring the robustness of scientific results. arXiv preprint arXiv:1804.08646, 2018
2018 arXiv
-
[14]
Algorithms and error bounds for multivariate piecewise constant approximation
Oleg Davydov. Algorithms and error bounds for multivariate piecewise constant approximation. In Approximation Algorithms for Complex Systems, pages 27--45. Springer, 2011
2011
-
[15]
Nonlinear approximation
Ronald A DeVore. Nonlinear approximation. Acta numerica, 7: 0 51--150, 1998
1998
-
[16]
Sharp minima can generalize for deep nets
Laurent Dinh, Razvan Pascanu, Samy Bengio, and Yoshua Bengio. Sharp minima can generalize for deep nets. arXiv preprint arXiv:1703.04933, 2017
2017 arXiv
-
[17]
UCI machine learning repository, 2019
Dheeru Dua and Casey Graff. UCI machine learning repository, 2019
2019
-
[18]
All models are wrong, but many are useful: Learning a variable's importance by studying an entire class of prediction models simultaneously
Aaron Fisher, Cynthia Rudin, and Francesca Dominici. All models are wrong, but many are useful: Learning a variable's importance by studying an entire class of prediction models simultaneously. Journal of Machine Learning Research, 20 0 (177): 0 1--81, 2019
2019
-
[19]
Three tutorial lectures on entropy and counting
David Galvin. Three tutorial lectures on entropy and counting. arXiv preprint arXiv:1406.7872, 2014
2014 arXiv
-
[20]
Geometric algorithms and combinatorial optimization, volume 2
Martin Gr \"o tschel, L \'a szl \'o Lov \'a sz, and Alexander Schrijver. Geometric algorithms and combinatorial optimization, volume 2. Springer Science & Business Media, 2012
2012
-
[21]
Flat minima
Sepp Hochreiter and J \"u rgen Schmidhuber. Flat minima. Neural Computation, 9 0 (1): 0 1--42, 1997
1997
-
[22]
On the complexity of linear prediction: Risk bounds, margin bounds, and regularization
Sham M Kakade, Karthik Sridharan, and Ambuj Tewari. On the complexity of linear prediction: Risk bounds, margin bounds, and regularization. In Advances in Neural Information Processing Systems, pages 793--800, 2009
2009
-
[23]
Random walks and an O ^*(n^5) volume algorithm for convex bodies
Ravi Kannan, L \'a szl \'o Lov \'a sz, and Mikl \'o s Simonovits. Random walks and an O ^*(n^5) volume algorithm for convex bodies. Random Structures & Algorithms, 11 0 (1): 0 1--50, 1997
1997
-
[24]
Algorithmic stability and sanity-check bounds for leave-one-out cross-validation
Michael Kearns and Dana Ron. Algorithmic stability and sanity-check bounds for leave-one-out cross-validation. Neural Computation, 11 0 (6): 0 1427--1453, 1999
1999
-
[25]
On large-batch training for deep learning: Generalization gap and sharp minima
Nitish Shirish Keskar, Dheevatsa Mudigere, Jorge Nocedal, Mikhail Smelyanskiy, and Ping Tak Peter Tang. On large-batch training for deep learning: Generalization gap and sharp minima. arXiv preprint arXiv:1609.04836, 2016
2016 arXiv
-
[26]
Empirical margin distributions and bounding the generalization error of combined classifiers
Vladimir Koltchinskii, Dmitry Panchenko, et al. Empirical margin distributions and bounding the generalization error of combined classifiers. The Annals of Statistics, 30 0 (1): 0 1--50, 2002
2002
-
[27]
Rashomon
Akira Kurosawa. Rashomon. Tokyo: Daiei, 1950
1950
-
[28]
PAC - B ayes & margins
John Langford and John Shawe-Taylor. PAC - B ayes & margins. In Advances in Neural Information Processing Systems, pages 439--446, 2003
2003
-
[29]
Interplay between concentration, complexity and geometry in learning theory with applications to high dimensional data analysis
Guillaume Lecu \'e . Interplay between concentration, complexity and geometry in learning theory with applications to high dimensional data analysis. PhD thesis, Universit \'e Paris-Est, 2011
2011
-
[30]
McCormick, and David Madigan
Benjamin Letham, Cynthia Rudin, Tyler H. McCormick, and David Madigan. Interpretable classifiers using rules and bayesian analysis: Building a better stroke prediction model. Annals of Applied Statistics, 9 0 (3): 0 1350--1371, 2015
2015
-
[31]
Letham, Cynthia Rudin, and Edward Browne
Benjamin Letham, Portia A. Letham, Cynthia Rudin, and Edward Browne. Prediction uncertainty and optimal experimental design for learning dynamical systems. Chaos, 26 0 (6), 2016
2016
-
[32]
Adaptive model selection using empirical complexities
G \'a bor Lugosi and Andrew B Nobel. Adaptive model selection using empirical complexities. The Annals of Statistics, 27 0 (6): 0 1830--1864, 1999
1999
-
[33]
Complexity regularization via localized random penalties
G \'a bor Lugosi and Marten Wegkamp. Complexity regularization via localized random penalties. The Annals of Statistics, 32 0 (4): 0 1679--1697, 2004
2004
-
[34]
The theory of error-correcting codes, volume 16
Florence Jessie MacWilliams and Neil James Alexander Sloane. The theory of error-correcting codes, volume 16. Elsevier, 1977
1977
-
[35]
Stability selection
Nicolai Meinshausen and Peter B \"u hlmann. Stability selection. Journal of the Royal Statistical Society: Series B (Statistical Methodology), 72 0 (4): 0 417--473, 2010
2010
-
[36]
A few notes on statistical learning theory
Shahar Mendelson. A few notes on statistical learning theory. In Advanced lectures on machine learning, pages 1--40. Springer, 2003
2003
-
[37]
Identifying a minimal class of models for high-dimensional data
Daniel Nevo and Ya'acov Ritov. Identifying a minimal class of models for high-dimensional data. The Journal of Machine Learning Research, 18 0 (1): 0 797--825, 2017
2017
-
[38]
Approximation of monomials by lower degree polynomials
DJ Newman and TJ Rivlin. Approximation of monomials by lower degree polynomials. Aequationes Mathematicae, 14 0 (3): 0 451--455, 1976
1976
-
[39]
On the degree of polynomials that approximate symmetric boolean functions (preliminary version)
Ramamohan Paturi. On the degree of polynomials that approximate symmetric boolean functions (preliminary version). In Proceedings of the Twenty-Fourth Annual ACM Symposium on Theory of Computing, pages 468--474. ACM, 1992
1992
-
[40]
Population-level prediction of type 2 diabetes from claims data and analysis of risk factors
Narges Razavian, Saul Blecker, Ann Marie Schmidt, Aaron Smith-McLallen, Somesh Nigam, and David Sontag. Population-level prediction of type 2 diabetes from claims data and analysis of risk factors. Big Data, 3 0 (4): 0 277--287, 2015
2015
-
[41]
A finite sample distribution-free performance bound for local discrimination rules
William H Rogers and Terry J Wagner. A finite sample distribution-free performance bound for local discrimination rules. The Annals of Statistics, pages 506--514, 1978
1978
-
[42]
The age of secrecy and unfairness in recidivism prediction
Cynthia Rudin, Caroline Wang, and Beau Coker. The age of secrecy and unfairness in recidivism prediction. Harvard Data Science Review, 2019. (accepted)
2019
-
[43]
Boosting the margin: A new explanation for the effectiveness of voting methods
Robert E Schapire, Yoav Freund, Peter Bartlett, Wee Sun Lee, et al. Boosting the margin: A new explanation for the effectiveness of voting methods. The Annals of Statistics, 26 0 (5): 0 1651--1686, 1998
1998
-
[44]
Structural risk minimization over data-dependent hierarchies
John Shawe-Taylor, Peter L Bartlett, Robert C Williamson, and Martin Anthony. Structural risk minimization over data-dependent hierarchies. IEEE Transactions on Information Theory, 44 0 (5): 0 1926--1940, 1998
1926
-
[45]
Smoothness, low noise and fast rates
Nathan Srebro, Karthik Sridharan, and Ambuj Tewari. Smoothness, low noise and fast rates. In Advances in Neural Information Processing Systems, pages 2199--2207, 2010
2010
-
[46]
van der Heijden
Nikolaj Tollenaar and P.G.M. van der Heijden . Which method predicts recidivism best?: a comparison of statistical, machine learning and data mining predictive models. Journal of the Royal Statistical Society: Series A (Statistics in Society), 176 0 (2): 0 565--584, 2013
2013
-
[47]
Machine learning with operational costs
Theja Tulabandhula and Cynthia Rudin. Machine learning with operational costs. The Journal of Machine Learning Research, 14 0 (1): 0 1989--2028, 2013
1989
-
[48]
On combining machine learning with decision making
Theja Tulabandhula and Cynthia Rudin. On combining machine learning with decision making. Machine Learning (ECML-PKDD journal track), 97 0 (1-2): 0 33--64, 2014 a
2014
-
[49]
Robust optimization using machine learning for uncertainty sets
Theja Tulabandhula and Cynthia Rudin. Robust optimization using machine learning for uncertainty sets. arXiv preprint arXiv:1407.1097, 2014 b
2014 arXiv
-
[50]
Supersparse Linear Integer Models for Optimized Medical Scoring Systems
Berk Ustun and Cynthia Rudin. Supersparse Linear Integer Models for Optimized Medical Scoring Systems . Machine Learning, 102 0 (3): 0 349--391, 2016
2016
-
[51]
The Nature of Statistical Learning Theory
Vladimir N Vapnik. The Nature of Statistical Learning Theory. Springer, 1995
1995
-
[52]
On the uniform convergence of relative frequencies of events to their probabilities
VN Vapnik and A Ya Chervonenkis. On the uniform convergence of relative frequencies of events to their probabilities. Theory of Probability and its Applications, 16 0 (2): 0 264, 1971
1971
-
[53]
An information measure for classification
Christopher S Wallace and David M Boulton. An information measure for classification. The Computer Journal, 11 0 (2): 0 185--194, 1968
1968
-
[54]
Interpretable classification models for recidivism prediction
Jiaming Zeng, Berk Ustun, and Cynthia Rudin. Interpretable classification models for recidivism prediction. Journal of the Royal Statistical Society: Series A (Statistics in Society) , 180 0 (3): 0 689--722, 2017
2017
-
[55]
The covering number in learning theory
Ding-Xuan Zhou. The covering number in learning theory. Journal of Complexity, 18 0 (3): 0 739--767, 2002
2002
-
[56]
1-norm support vector machines
Ji Zhu, Saharon Rosset, Robert Tibshirani, and Trevor J Hastie. 1-norm support vector machines. In Advances in Neural Information Processing Systems, pages 49--56, 2004
2004
Reviewed August 14, 2026 · model on record in the stance chip above.
Discussion (0). Continue with ORCID to comment.