REVIEW 4 major objections 4 minor 36 references
Detection, attribution, and modeling of climate change: key open issues
T0 review · 4 major / 4 minor · reviewed 2026-08-07 · deepseek-v4-flash
Pith's one-line read The paper argues that IPCC climate assessments overstate human-caused warming because the CMIP models underpinning them underrepresent natural solar and multidecadal variability, and that empirical models yield a lower climate sensitivity…
desk verdict A well-written review of real gaps in climate modeling that overreaches badly: the 20/50/30 attribution is not derived, it is an unidentifiable fit dressed as a result. read the letter →
The pith
A machine-rendered reading of the paper's core claim, the machinery that carries it, and where it could break.
The reading
What carries the argument
The load-bearing object is an empirical/semi-empirical family of models built on a zero-dimensional energy-balance equation with a single response time-constant, whose discretized form regresses temperature against anthropogenic, volcanic, and solar forcing plus a fast noise term. In one variant the solar component is replaced by thirteen astronomical harmonics, notably with periods of 60.95, 114.78, 129.95, 983.40, and 2318 years, fixed from astronomical considerations rather than freely fitted. What these models do is convert the same observed temperature record into an attribution split and an ECS estimate without depending on the cloud and water-vapor feedback parameterizations that drive the GCMs' high sensitivities. The mechanism that produces the low-ECS, high-solar result is a fitted sensitivity of climate to total solar irradiance that is four to six times larger than the sensitivity to greenhouse or volcanic forcing, which the paper attributes physically to solar-corpuscular and cosmic-ray–cloud modulation that the GCMs omit.
What would settle it
Track the predicted multidecadal phase: the empirical framework implies that the 1970–2000 warming was largely the warm phase of a quasi-60-year cycle, so global temperature should flatten or cool from the early 2000s through roughly 2030, so a sustained increase through 2035 matching the 1980–2000 trend would refute the natural-variability attribution. A second check is whether lower-troposphere satellite records continue to warm about 20–33% less than the homogenized surface records, since the paper's warm-bias hypothesis predicts that gap will persist or widen as urban-heat-island blending grows.
Extended reading notes
Core claim
The paper's central claim is that the near-100% anthropogenic attribution in the latest IPCC assessment is not empirically settled: the CMIP GCMs on which it rests systematically underproduce natural multidecadal and millennial variability, such as the quasi-60-year Atlantic oscillation, the Medieval Warm Period, and the Holocene Thermal Maximum; they use solar forcing functions with artificially low secular variability; and they are compared against surface temperature records that carry uncorrected warm biases. Reworking the same temperature history with empirical and semi-empirical models—a zero-dimensional energy-balance response to anthropogenic, volcanic, and solar forcings, plus an astronomically based harmonic component—yields a lower equilibrium climate sensitivity, as low as approximately \(1.1 \pm 0.4\,^{\circ}\text{C}\), a solar contribution up to about 50% of the reported warming since 1850, a non-climatic warm bias of roughly 20%, and a residual human contribution of roughly 30%. The paper concludes that 21st-century warming under the moderate SSP2-4.5 scenario would stay below about \(2\,^{\circ}\text{C}\), so Net-Zero policies would not be necessary to meet the Paris Agreement targets.
Load-bearing premise
The load-bearing premise is that the empirical models' fitted coefficients—the single response time of the climate system, the amplitudes and phases of the astronomical harmonics, and the regression parameters linking forcing to temperature—remain valid when extrapolated to 2100; the paper itself concedes that the harmonic model may perform well inside the calibration interval yet diverge substantially from reality outside it.
Editorial extensions
If this is right
- If the 20% warm-bias estimate holds, reported historical warming and land-temperature trends would need to be revised downward, shifting both detection baselines and adaptation planning.
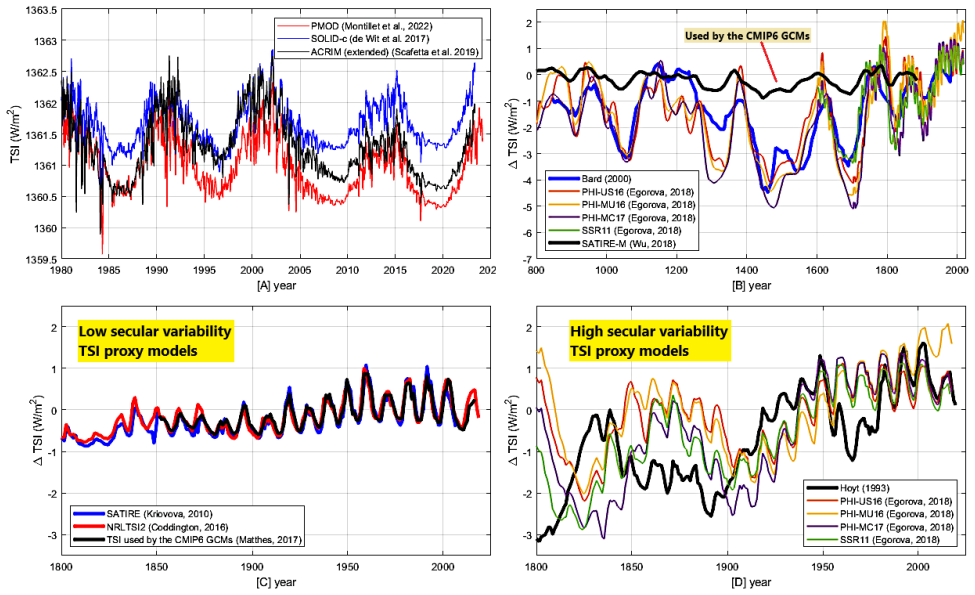
- If solar and astronomical contributions really account for up to half the observed warming, GCM attribution studies that assume a near-zero natural trend would need to be recalibrated, and solar forcing sets with larger secular variability would need to be adopted.
- If equilibrium climate sensitivity is near \(1.1\)–\(2.1\,^{\circ}\text{C}\) rather than the IPCC's \(2.5\)–\(4\,^{\circ}\text{C}\) central range, projected warming under SSP2-4.5 would stay moderate and the \(2\,^{\circ}\text{C}\) threshold would not be crossed this century.
- If the GCMs' failure to reproduce the Medieval Warm Period and the Holocene Thermal Maximum is real, paleoclimate validation would become a standard prerequisite for trusting GCM-based attribution claims.
- If the empirical projections are correct, the scientific justification for Net-Zero-by-2050 policies as a Paris-compliant strategy would be seriously weakened, and adaptive or lower-cost mitigation approaches would appear sufficient.
Reading between the lines
- The paper's attribution split of roughly 20% record bias, up to 50% solar, and 30% anthropogenic is a composite of several model variants rather than a single mechanistic estimate; a natural extension would be formal uncertainty propagation and out-of-sample hindcasts from 1850–1950 to 1950–2020.
- The quasi-60-year and quasi-millennial harmonics imply a testable near-term prediction: after the current warm phase, a relative flattening or cooling should appear within the next decade or two, which existing observing systems could verify directly.
- If the solar-corpuscular/cloud amplifier is real, a targeted causal test would compare cloud-cover anomalies from satellite data with cosmic-ray Forbush decreases and the 11-year solar cycle, moving beyond the correlations the paper presents.
- The claim that Net-Zero policies are unnecessary also depends on SSP2-4.5 being a realistic emissions path; the paper cites work labeling higher SSPs as unlikely, but readers should note that even moderate-emission scenarios could become unrepresentative if carbon-cycle feedbacks strengthen.
Editorial analysis
A structured set of objections, weighed in public.
Referee Report
Summary. This manuscript argues that the CMIP/IPCC assessment that nearly all post-1850 warming is anthropogenic is undermined by data biases, underestimated solar and astronomical variability, and model deficiencies. It reviews evidence on urban heat island effects, homogenization, satellite–surface discrepancies, total solar irradiance reconstruction, the Medieval Warm Period and Holocene conundrums, and then presents empirical models: a zero-dimensional energy-balance regression (Eq. 9), an astronomically based harmonic model (Eq. 10), and a synthetic solar-based climate model (Fig. 22). These yield an equilibrium climate sensitivity of about 1.1 ± 0.4 °C, a decomposition of observed warming into roughly 20% record bias, up to 50% solar contribution, and about 30% anthropogenic contribution, and a projection that 21st-century warming under SSP2-4.5 remains below 2 °C. The conclusion is that Net-Zero policies are not necessary to meet the Paris targets.
Significance. If the central claims were established, the manuscript would overturn the current detection and attribution consensus and would have immediate policy consequences, so the stakes are high. The paper has useful features: it assembles a broad and current literature, reproduces many source figures, provides data links, and explicitly concedes in Section 5.5 that empirical harmonic fits can diverge outside the calibration interval. However, the quantitative claims are conditional on unvalidated choices—high-variability TSI, αS ≠ αA, fixed harmonic periods, and assumed observational uncertainties—and, as documented below, the main results are not reproducible from the equations as written. The paper therefore does not provide a sound basis for its headline attribution or policy conclusion.
major comments (4)
- [§5.4, §5.6, §6] The paper's central attribution—roughly 50% solar, 30% anthropogenic, 20% record bias, and ECS ≈ 1.1 ± 0.4 °C—is a regression output, not a measurement. In Eq. (9), the coefficients αA, αV, αS, and β are fitted to observed temperature, and the headline scenario requires both a high-variability TSI forcing and the assumption αA = αV ≠ αS. Over 1850–2020, F_A and F_S are both smooth, slowly varying series, so the ratio αS/αA ≈ 5.1 is identified only by the shape and amplitude of the chosen F_S—the very quantity contested in Section 4.2.2. No independent physical constraint or out-of-sample test is offered for this ratio; the same model with equal sensitivities and the CMIP6 low-variability TSI gives ECS ≈ 2.1 ± 0.7 °C (Section 5.4). The 20/50/30 decomposition in the Conclusion therefore collapses if the contested TSI reconstruction is replaced.
- [§5.4, Eqs. (4)–(7)] The derivation of ECS is internally inconsistent as written. Immediately before Eq. (4), the text defines αA = kA/τ and β = 1/τ, but Eq. (4) asserts the equality kA F_A(t) = αA F_A(t), which requires αA = kA. Eq. (7) then defines ECS = 3.7 kA. Using the reported fitted values in Section 5.6 (αA = 0.083 °C m²/(W y), β = 0.303 y⁻¹), the two interpretations give different results: αA = kA/τ with τ = 1/β implies kA ≈ 0.274 °C/(W/m²) and ECS ≈ 1.0 °C, whereas αA = kA would give ECS ≈ 0.31 °C. A reader cannot reproduce the claimed ECS ≈ 1.1 ± 0.4 °C from the equations and definitions as stated.
- [§5.5, Eq. (10), Fig. 21] The 21st-century projection that warming stays below 2 °C under SSP2-4.5 rests on the harmonic model in Eq. (10), with periods 60.95, 114.78, 129.95, 983.40, and 2318 years and amplitudes estimated from the calibration period. The manuscript itself concedes that such fits 'may perform well within the calibration interval, and yet they could diverge substantially from reality outside the regression period.' No out-of-sample forecast validation is presented, and the astronomical justification for the periods does not rule out the possibility that the detected peaks are spectral artifacts of red noise. In the absence of a genuine forecast test, the policy conclusion drawn from Fig. 21 is not supported.
- [§4.2.2–§4.2.3 and §6] The argument for a dominant solar contribution is circular. Section 4.2.2 uses the paleoclimate correlation to argue for high-variability TSI models; that TSI series is then used in Eq. (2)/(9) to recover αS/αA ≈ 5.1 and ECS ≈ 1.1 °C (§5.6); Section 6 then presents this low ECS as evidence for 'hypersensitivity' and for speculative corpuscular and cloud mechanisms. The paper acknowledges in §4.2.3 that the CLOUD experiment found cosmic rays insufficient for nucleation, yet the conclusion does not resolve this conflict. The low-ECS result is therefore not an independent line of evidence; it is a restatement of the prior choice of TSI and sensitivity assumptions.
minor comments (4)
- [§4.1.2, Table 1] The uncertainty ranges for the UAH-MSU and NOAA-STAR satellite records are 'assumed here' rather than estimated from the data; this assumption and its influence on the 20–30% excess-warming percentages should be stated explicitly in the text.
- [§5.4, paragraph following Eq. (1)] 'Unlikely Eq. 1' should read 'Unlike Eq. 1.'
- [§5.5, Eq. (10)] The 13 harmonic amplitudes, frequencies, and phases are not listed in the paper but are only referenced to previous work, which makes the central projection impossible to reproduce from the manuscript alone.
- [General] There are several typographical errors: 'Inded' in §3.2, 'exgerate' in the Highlights, 'JJenkins' in the reference list, and a cross-reference to 'Section 3.3.1' in §4.1.2 where no such section exists (the hot-model discussion appears in §3.4.1).
Circularity Check
Low-ECS and 50%-solar attribution are partly fixed by construction: Eq. (10) halves the GCM response and the Section 5.6 parameters convert fitted regression coefficients into the reported ECS and solar share.
-
self definitional
[Section 5.5, Eq. (10); Section 6; Figure 21]
"Anthropogenic and volcanic contributions were derived from the ensemble mean of the CMIP6 GCM simulations, utilizing half the climate sensitivity estimated by these models, which means that the ECS was estimated to be about 1.5-2.0°C, to incorporate a natural variability described by the adopted harmonic constituent model."
Equation (10) hard-wires the future response as 0.5 × GCM(t). Because the CMIP6 SSP2-4.5 GCM pathway in Figure 3 warms well above 2°C, multiplying it by 0.5 and adding harmonics fitted to the historical record is what produces the Figure 21A 'below 2°C' projection. The paper itself concedes that such harmonic fits 'may perform well within the calibration interval, and yet they could diverge substantially from reality outside the regression period.' The moderate-warming conclusion is therefore an input of the equation, not an independent empirical output.
-
fitted input called prediction
[Section 5.4, Eq. (7); Section 5.6; Section 6]
"The ECM model (Eq. 2) used the following parameters, estimated by Scafetta (2023a) using a solar variability model and the HadSST4 record: αA = αV = 0.083 °Cm2/yW, αS = 0.427 °Cm2/yW, and β = 0.303 1/y. These values imply an ECS equal to 1 ± 0.3 °C, and an enhanced sensitivity to TSI forcing by a factor of 5.1 ± 1.5."
The reported ECS is not an independent climate measurement: with Eq. (7) and the fitted αA and β of Section 5.6, ECS = 3.7 × (αA/β) = 3.7 × (0.083/0.303) ≈ 1.0°C, so the low ECS is an algebraic restatement of coefficients obtained by regression on the HadSST4 temperature record. The 5.1-fold solar 'hypersensitivity' is likewise just the ratio αS/αA of the same fitted coefficients. The Section 6 attribution (about 20% warm bias, up to 50% solar, about 30% anthropogenic) is then the fitted decomposition relabeled as an empirical finding rather than a prediction with independent support.
full rationale
The paper's strongest conclusion — low ECS (~1.1±0.4°C), up to 50% solar attribution, and no need for Net-Zero — rests on two partially circular moves. First, Eq. (10) defines the empirical projection as 0.5 × GCM(t) plus harmonics fitted to historical temperature, so the 'moderate warming below 2°C under SSP2-4.5' result is fixed by the halving factor, and the paper's own text warns that the harmonic component may diverge outside the calibration interval. Second, the ECS and solar hypersensivity figures in Section 5.6 and the 20/50/30 attribution in Section 6 are deterministic functions of regression coefficients (αA, αS, β) fitted to the same temperature record being explained; they are not verified against independent future or paleoclimate targets within this paper. The rest of the paper — the 'hot model' comparisons, satellite-versus-surface discrepancies, and MWP/Holocene model-data mismatches — is an empirical critique of GCMs that stands apart from these fitted models and is not circular. Self-citations to Scafetta (2023a, 2024) are frequent, but per the review rules that alone would not raise the score; the decisive issue is the by-construction halving of the GCM response and the re-expression of fitted parameters as empirical predictions. Hence a partial-circularity score of 6 rather than a higher score.
Assumptions & free parameters
free parameters (5)
- alpha_A (anthropogenic sensitivity parameter) =
0.083 °Cm2/yW (from Scafetta 2023a)
- alpha_S (solar sensitivity parameter) =
0.427 °Cm2/yW (from Scafetta 2023a)
- beta (inverse of time constant tau) =
0.303 1/y
- Harmonic periods and amplitudes in Eq. 10 =
P1=60.95y, P2=114.78y, P3=129.95y, P4=983.40y, P5=2318y (periods from astronomical theory, amplitudes Ai fitted)
- Tmax/Tmin bias scaling and UHI adjustment =
15-25% warm bias estimate
assumptions (4)
- domain assumption The climate system can be approximated as a zero-dimensional energy balance with a single time constant (Eq. 3).
- domain assumption The high-variability TSI reconstructions (e.g., those in Fig. 18B/D) are more accurate than the low-variability models (Matthes et al. 2017) used in CMIP6.
- domain assumption The quasi-60-year and quasi-millennial cycles are real climate signals driven by solar/astronomical factors, and not artifacts or internally generated variability.
- domain assumption The regression parameters fitted over the calibration period remain stationary into the future (no structural change in feedbacks).
Cite this review
Pith. "Pith review of Detection, attribution, and modeling of climate change: key open issues." pith.science (2026). https://pith.science/paper/HDSYIUHQ
@misc{pith2026250613994,
  author       = {Pith},
  title        = {Pith review of: Detection, attribution, and modeling of climate change: key open issues},
  year         = {2026},
  howpublished = {\url{https://pith.science/paper/HDSYIUHQ}},
  note         = {Machine review of arXiv:2506.13994}
}
read the original abstract
The CMIP global climate models (GCMs) assess that nearly 100% of global surface warming observed between 1850-1900 and 2011-2020 is attributable to anthropogenic drivers like greenhouse gas emissions. These models also generate future climate projections based on shared socioeconomic pathways (SSPs), aiding in risk assessment and the development of costly Net-Zero climate mitigation strategies. Yet, the CMIP GCMs face significant scientific challenges in attributing and modeling climate change, particularly in capturing natural climate variability over multiple timescales throughout the Holocene. Other key concerns include the reliability of global surface temperature records, the accuracy of solar irradiance models, and the robustness of climate sensitivity estimates. Global warming estimates may be overstated due to uncorrected non-climatic biases, and the GCMs may significantly underestimate solar and astronomical influences on climate variations. The equilibrium climate sensitivity (ECS) to radiative forcing could be lower than commonly assumed; empirical findings suggest ECS values lower than 3 K and possibly even closer to 1.1 +/- 0.4 K. Empirical models incorporating natural variability suggest that the 21st-century global warming may remain moderate, even under SSP scenarios that do not necessitate Net-Zero emission policies. These findings raise important questions regarding the necessity and urgency of implementing aggressive climate mitigation strategies. While GCMs remain essential tools for climate research and policymaking, their scientific limitations underscore the need for more refined modeling approaches to ensure accurate future climate assessments. Addressing uncertainties related to climate change detection, natural variability, solar influences, and climate sensitivity to radiative forcing will enhance predictions and better inform sustainable climate strategies.
Figures


Figures from the paper (19 more)




Reference graph
Works this paper leans on
-
[5]
Available at https://www.thegwpf.org/content/uploads/2013/09/Montford-Consensus.pdf, accessed on April 10,
work page 2013
-
[6]
European Green Deal. Available at: https://commission.europa.eu/strategy-and- policy/priorities-2019-2024/european-green-deal_en, accessed on April 10,
work page 2019
-
[9]
The DOE E3SM coupled model version 1: Overview and evaluation at standard resolution. J. Adv. Model. Earth Syst., 11, 2089–2129. Gore, A.,
-
[12]
Available at: https://www.iea.org/reports/world-energy-outlook-2024 (accessed January 23, 2025)
International Energy Agency (IEA), Paris, France. Available at: https://www.iea.org/reports/world-energy-outlook-2024 (accessed January 23, 2025). IPCC,
work page 2024
-
[14]
Clim. Change 2007: Phys. Sci. Basis. Contribution of Working Group I to the Fourth Assessment Report. [S. Solomon, D. Qin, M. Manning, Z. Chen, et al. (eds.)]. Cambridge Univ. Press. IPCC,
work page 2007
-
[17]
Clim. Change 2023: Synth. Report. Contribution of Working Groups I, II & III. [Core Writing Team, H. Lee, J. Romero (eds.)]. IPCC, Geneva, Switzerland. JJenkins, S., Smith, C., Allen, M., Grainger, R.,
work page 2023
-
[19]
George Mason Univ., Center for Clim
A 2016 National Survey of American Meteorological Society Member Views on Climate Change: Initial Findings. George Mason Univ., Center for Clim. Change Commun. Manabe, S., Wetherald, R.T.,
work page 2016
-
[24]
Land surface air temperature vari- ations across the globe updated to 2019: the CRUTEM5 dataset. J. Geophys. Res. Atmos., 126, e2019JD032352. PAGES-2K Consortium,
work page 2019
Show all 36 references
-
[25]
Plausible 2005–2050 emissions scenarios project between 2°C and 3°C of warming by
2005
-
[29]
Remote Sens., 11(21),
Modeling quiet solar luminosity variability from TSI satellite measurements and proxy models during 1980–2018. Remote Sens., 11(21),
1980
-
[31]
Climate, 11,
The detection and attribution of Northern Hemisphere land surface warming (1850–2018) in terms of human and natural factors: Challenges of inadequate data. Climate, 11,
2018
-
[33]
The Global Warming Policy Foundation
Force Majeure: The Sun’s Role in Climate Change. The Global Warming Policy Foundation. ISBN 978-0993119095. Available at https://www.thegwpf.org/content/uploads/2019/03/SvensmarkSolar2019-1.pdf Svensmark, H.,
2019
-
[34]
Earth Syst
Volcanic stratospheric sulfur injections and aerosol optical depth from 500 BCE to 1900 CE. Earth Syst. Sci. Data, 9, 809–831. Undorf, S., Pulkkinen, K., Wikman-Svahn, P ., Bender, F.A.-M.,
1900
- [35]
-
[104]
doi:10.1029/2023eo230411
American Geophysical Union (AGU). doi:10.1029/2023eo230411. 62 Santer, B., Fyfe, J., Pallotta, G., Flato, G.M., Meehl, G.A., et al.,
-
[147]
Testing the CMIP6 GCM simulations versus surface temperature records from 1980–1990 to 2011–2021: High ECS is not supported
Scafetta, N., 2021c. Testing the CMIP6 GCM simulations versus surface temperature records from 1980–1990 to 2011–2021: High ECS is not supported. Climate, 9,
1980
-
[1967]
Flammarion, Paris (translated by B
Histoire du Climat depuis l’an mil. Flammarion, Paris (translated by B. Bray, Dou- bleday & Co., 1971). Lewis, N.,
1971
-
[1979]
Carbon dioxide and climate: A scientific assessment. Natl. Acad. Sci. Wash. DC. Available at: https://doi.org/10.17226/12181, accessed on April 10,
-
[1993]
A discussion of plausible solar irradiance variations, 1700–1992. J. Geophys. Res. Space Phys., 98(A11), 18895–18906. Hoyt, D.V ., Schatten, K.H.,
1992
-
[2001]
Change 2001: Sci
Clim. Change 2001: Sci. Basis. Contribution of Working Group I to the Third Assessment Report. [J.T. Houghton, Y. Ding, D.J. Griggs, M. Noguer, et al. (eds.)]. Cambridge Univ. Press. IPCC,
2001
-
[2003]
(1998) proxy database and Northern Hemi- spheric average temperature series
Corrections to the Mann et al. (1998) proxy database and Northern Hemi- spheric average temperature series. Energy Environ., 14(6), 751–771. McKitrick, R.R., Michaels, P .J.,
1998
-
[2004]
Solar turbulence in earth’s global and regional temperature anomalies. Phys. Rev. E 69, 026303. Scafetta, N., West, B.J., 2006a. Phenomenological solar contribution to the 1900–2000 global surface warming. Geophys. Res. Lett., 33, L05708. Scafetta, N., West, B.J., 2006b. Pheno...
1900
-
[2006]
Available at: https://www.epw.senate.gov/public/index.cfm/hearings?Id=BFE4D91D-802A-23AD-4306- B4121BF7ECED&Statement_id=361256C4-11DC-4E5D-8D1D-9FEDF082D081, accessed on April 10,
US Senate Hearing on Climate Change and the Media (December 6, 2006 09:30 AM). Available at: https://www.epw.senate.gov/public/index.cfm/hearings?Id=BFE4D91D-802A-23AD-4306- B4121BF7ECED&Statement_id=361256C4-11DC-4E5D-8D1D-9FEDF082D081, accessed on April 10,
2006
-
[2007]
Climate simulations for 1880–2003 with GISS modelE. Clim. Dyn., 29, 661–696. Harde, H.,
2003
-
[2010]
Empirical evidence for a celestial origin of the climate oscillations and its implications. J. Atmos. Sol.-Terr. Phys., 72, 951–970. Scafetta, N., 2012a. Testing an astronomically based decadal-scale empirical harmonic climate model versus the IPCC (2007) general circulation c...
2007
-
[2012]
Local climate zones for urban temperature studies. Bull. Am. Meteorol. Soc., 93, 1879–1900. Svensmark, H., Friis-Christensen, E.,
1900
-
[2013]
Change 2013: Phys
Clim. Change 2013: Phys. Sci. Basis. Contribution of Working Group I to the Fifth Assessment Report. [T.F. Stocker, D. Qin, G.-K. Plattner, M. Tignor, et al. (eds.)]. Cambridge Univ. Press. IPCC,
2013
-
[2014]
Reconstruction of total and spectral solar irradi- ance from 1974 to 2013 based on KPVT, SoHO/MDI and SDO/HMI observations. Astron. Astrophys., 570, A85. Yeo, K.L., Solanki, S.K., Krivova, N.A., Rempel, M., Anusha, L.S., et al.,
1974
-
[2016]
Overview of the coupled model in- tercomparison project phase 6 (CMIP6) experimental design and organization. Geosci. Model Dev., 9(5), 1937–1958. Fagan, B.,
1937
-
[2017]
Characteristics of temperature change in China over the last 2000 years and spatial patterns of dryness/wetness during cold and warm periods. Adv. Atmos. Sci., 34, 941–951. Gervais, F.,
2000
-
[2019]
Geosci., 9(3),
Northern hemi- sphere snow-cover trends (1967-2018): A comparison between climate models and observations. Geosci., 9(3),
1967
-
[2020]
Energies, 13(18),
Energy and climate policy — an evalu- ation of global climate change expenditure 2011–2018. Energies, 13(18),
2011
-
[2021]
Change 2021: Phys
Clim. Change 2021: Phys. Sci. Basis. Contribution of Working Group I to the Sixth Assessment Report. [V . Masson-Delmotte, P . Zhai, A. Pirani, S.L. Connors, et al. (eds.)]. Cambridge Univ. Press. IPCC,
2021
-
[2022]
In: Lehotský, M., Boltižiar, M
Climate in the Past and Present in the Slovak Landscapes—The Central European Context. In: Lehotský, M., Boltižiar, M. (eds.) Landscapes Landforms Slovakia, Springer, Cham. https://doi.org/10.1007/978-3-030-89293-7_3 Menne, M.J., Williams, C.N., Gleason, B.E., Rennie, J.J., La...
-
[2023]
Pollen-based reconstructions of Holocene climate trends in the eastern Mediterranean region. Clim. Past, 19, 2093–2108. Curry, J.,
-
[2024]
Astrophys
Multiple new or updated satellite total solar irradiance (TSI) composites (1978–2023). Astrophys. J., 975,
1978
Reviewed August 7, 2026 · model on record in the stance chip above.
Discussion (0). Continue with ORCID to comment.