REVIEW 5 major objections 6 minor 38 references
Social media usage reveals how regions recover after natural disaster
T0 review · 5 major / 6 minor · reviewed 2026-08-14 · deepseek-v4-flash
Pith's one-line read A region's post-disaster business downtime can be nowcast from aggregated Facebook posting rates alone, without reading any post contents.
desk verdict A plausible new proxy for business downtime from Facebook posting rates, but the real-time validation is circular and the proxy is not independently calibrated. read the letter →
The pith
A machine-rendered reading of the paper's core claim, the machinery that carries it, and where it could break.
The reading
What carries the argument
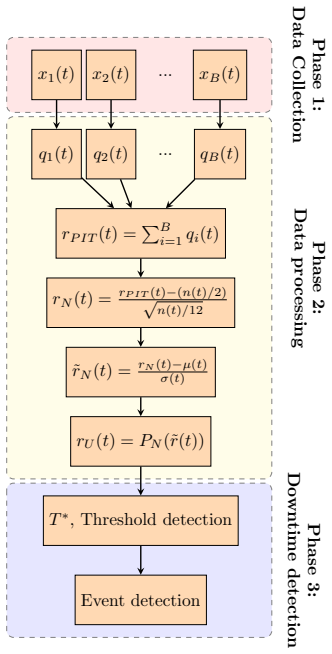
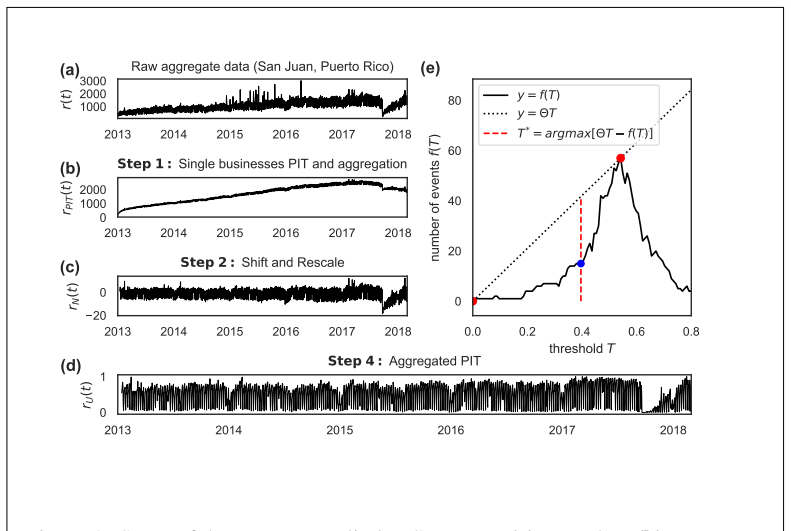
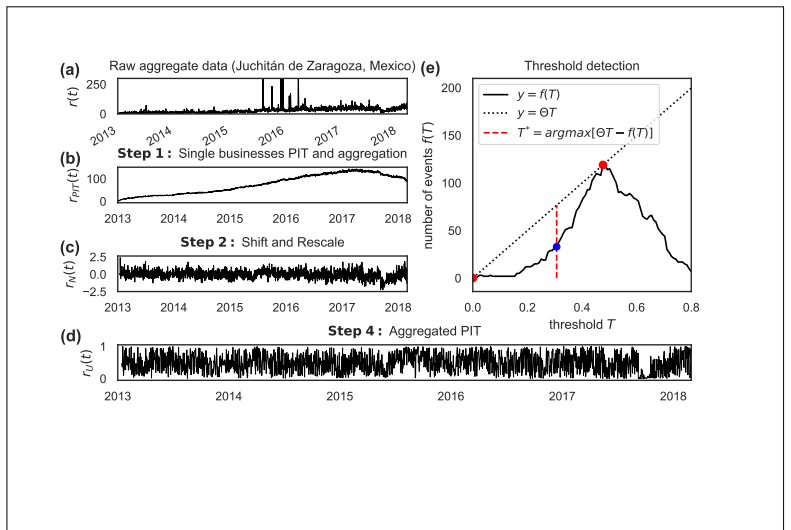
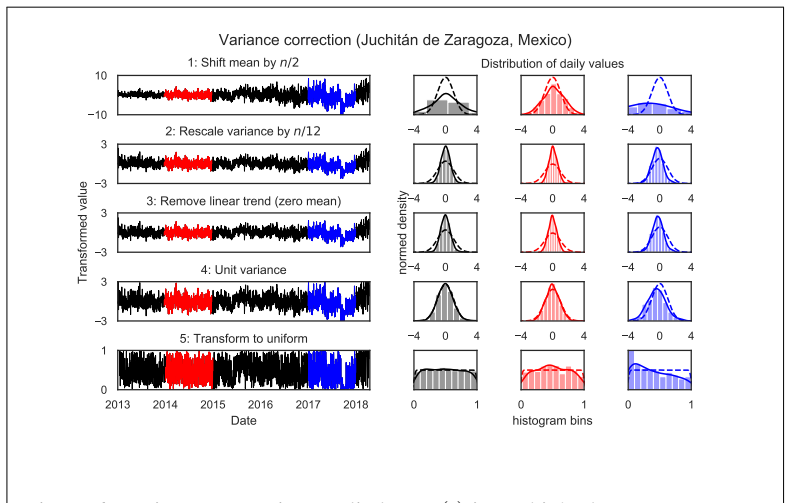
The load-bearing machinery is a four-step normalization that turns a messy, non-stationary count series into a stationary signal in which anomalous low-activity periods stand out uniformly. (1) Each business's daily post count is replaced by its mid-quantile within that calendar year — a per-business Probability Integral Transform — which makes businesses with very different posting rates comparable and suppresses outlier days. (2) The daily sum of these mid-quantiles is shifted and rescaled by the mean and standard deviation of the Irwin-Hall distribution (the distribution of a sum of independent Uniform(0,1) variables, $n(t)/2$ and $\sqrt{n(t)/12}$), so that under normal conditions the aggregated series is approximately standard Normal. (3) A linear trend is removed and the variance is rescaled to one, correcting for residual correlation among businesses and for errors in estimating how many businesses are active. (4) The standard Normal CDF maps the series to Uniform(0,1), giving $r_U(t)$. A downtime event is defined as a period longer than seven days where the weekly rolling mean of $r_U(t)$ lies below a threshold $T^*$, and $T^*$ is fixed by the 'elbow' of the curve counting how many events are detected at each threshold. This design is what lets the same pipeline work across languages, posting rates, and calendar cultures, and it is also what makes the method independent of post content.
What would settle it
Compare posting rates against a known-answer set of businesses with independently recorded open/closed dates in an area where connectivity was unaffected: if posting rates stay high while businesses are closed, or drop while businesses are open, the proxy fails.
Extended reading notes
Core claim
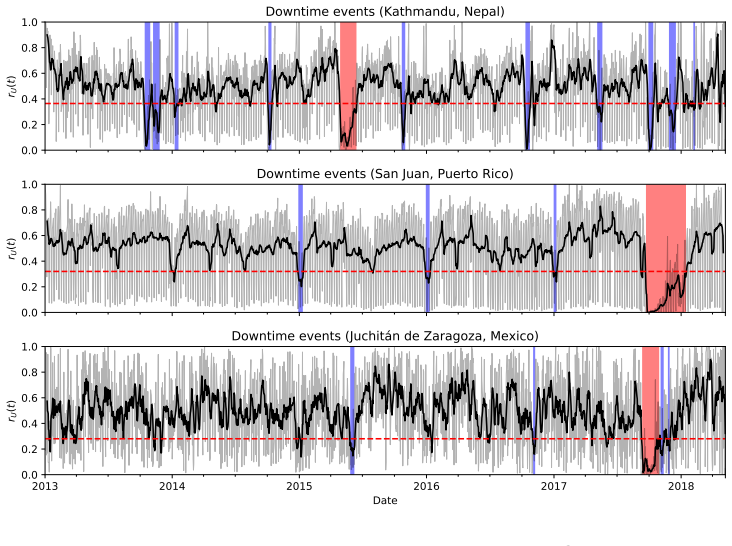
The central discovery is that the aggregate volume of Facebook posts by local businesses drops sharply after a natural disaster and remains depressed for a measurable period, and that this period matches independent estimates of when businesses were actually closed. By converting each business's daily post count into a mid-quantile of that business's own posting history within the calendar year, summing across businesses, and then shifting and rescaling the sum to the mean and variance expected for a sum of independent uniform variables, the authors obtain a detrended, normalized signal in which normal fluctuations are uniform on [0,1]. Sustained low values of the weekly rolling mean of this signal, below a threshold chosen by an 'elbow' rule, are counted as downtime events. The method reports 50 days for Kathmandu, 118 days for San Juan, and 52 days for Juchitán, and in a real-time simulation that uses only data available up to week t after the event, the estimates track the final downtime with root-mean-square errors of 2.75, 0.88, and 3.5 days respectively.
Load-bearing premise
The whole framework rests on the premise that businesses post more when they are open and less when they are closed, meaning the measured drop in posting activity is a proxy for closure rather than for loss of internet access, evacuation, or a shift to another platform.
Editorial extensions
If this is right
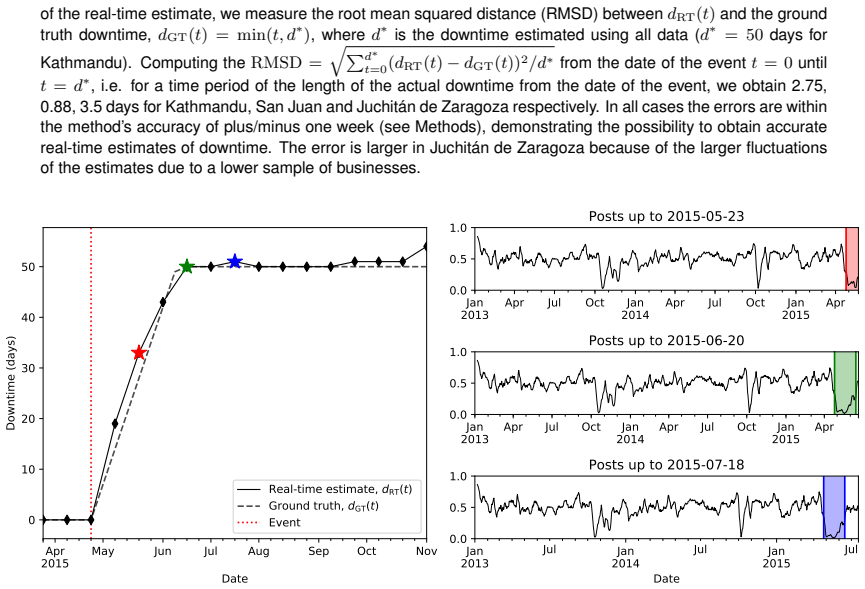
- Downtime can be nowcast during an unfolding disaster: using only posts published up to week $t$, the method tracks the final downtime with RMS errors of 2.75 days (Kathmandu), 0.88 days (San Juan), and 3.5 days (Juchitán), all within the stated plus/minus one week accuracy.
- The signal needs no text: timestamps alone carry the information, so the approach transfers across languages and does not require storing or reading post contents.
- The same anomaly-detection pipeline is explicitly general: any aggregated time series built from many individual components — mobile phone call volumes, web-page visits, perhaps foot-traffic counts — could in principle be processed the same way to expose anomalous low-activity periods.
- Downtime estimates remain stable when the number of businesses is large (thousands), and are still accurate with a few hundred businesses that post more than about once per week, though very small samples tend to underestimate the true downtime.
- Cultural closures appear in the same framework (Dashain in Nepal, Christmas–New Year in Puerto Rico, All Saints'/Revolution Day in Mexico), which both supports the method's validity and shows that disaster-related closures can be separated from calendar-driven ones by looking at the timing of the detected events.
Reading between the lines
- A natural next test is to apply the pipeline to non-disaster closures whose dates are known exactly (holiday shutdowns, strikes, renovations) to see whether the posting dip's length and timing reproduce those dates; if yes, the proxy is about operation, not trauma.
- The per-business quantile normalization is platform-agnostic in principle, so the same idea could be tried on Google Business profiles, Yelp check-ins, or Uber pick-up volumes, but the 'open means posting' correlation would have to be re-established for each new data source.
- In regions where disasters also knock out internet and mobile networks, the method may overestimate downtime because it cannot distinguish 'closed' from 'cannot post'; combining the posting signal with mobility or satellite data would let a user separate those two causes.
- A fully causal real-time deployment would need a threshold fixed before the disaster strikes, whereas the paper's real-time simulation still estimates the threshold from data cropped after the event; testing with a pre-specified threshold, or with a threshold updated only from pre-disaster data, is a direct next step.
Signed reviews
Editorial analysis
A structured set of objections, weighed in public.
Referee Report
Summary. The paper proposes a framework to estimate the post-disaster 'downtime' of small businesses by analyzing the aggregated Facebook posting activity of business pages in three affected regions: Kathmandu (2015 Gorkha earthquake), San Juan (2017 Hurricane Maria), and Juchitán de Zaragoza (2017 Chiapas earthquake). The method has three phases: data collection via the Facebook Graph API, data processing that transforms each business's daily post counts through a Probability Integral Transform, aggregation, shift/rescale to a standard normal, and a final PIT to a uniform series, and downtime detection using a rolling weekly mean below a threshold selected via an 'elbow method.' The authors report downtimes of 50, 118, and 52 days for the three events, validate against field surveys, tourism data, and a small Facebook survey, and provide a real-time simulation that crops data at successive weeks. The central claim is that downtime can be nowcast in real time from aggregated public posting rates without NLP.
Significance. If the method holds, it would offer a low-cost, scalable, and near-real-time indicator of post-disaster economic recovery, filling a gap in current practice where recovery is measured through slow and expensive surveys. The paper contributes a clearly specified, reproducible pipeline for turning raw Facebook timestamps into a normalized anomaly score, and it is commendable for collecting and processing large datasets (11,818 businesses in Kathmandu, 10,894 in San Juan, 1,728 in Juchitán) and for including sensitivity analyses on business subsets and posting-rate filters. The three-case-study design across different disaster types and socioeconomic contexts strengthens the plausibility that the method generalizes. However, the empirical support for the core proxy assumption—that posting activity equals business open/closed status—is indirect and confounded, and the real-time validation is internally circular, so the headline numerical claims should be treated with caution until stronger external validation is provided.
major comments (5)
- [Section 3.7, Figure 5e, Tables 2-4] The threshold T* used to define a downtime event is selected from the same data used for event detection, via an 'elbow method' whose statistical properties are not established. The detected event durations (50, 118, 52 days) are therefore conditional on a threshold that has no stated uncertainty or null-model justification. To make the central claim load-bearing, the authors should demonstrate on synthetic data with known downtime periods that the elbow method recovers the true threshold and duration with bounded error, and they should report a sensitivity analysis over a range of T values for the three case studies.
- [Section 1.5, Eq. for RMSD, Figures 4, 10, 11] The real-time validation is circular: the 'ground truth' d_GT(t) is defined as min(t, d*), where d* is the method's own final estimate using all data. The RMSD therefore measures how quickly the real-time estimate converges to the batch estimate, not how accurately it tracks actual business reopening. The authors should instead compare d_RT(t) against independent ground truth (e.g., the survey and tourism data used later) at each t, or at least report the range of d* consistent with those external anchors (e.g., 40-56 days for Kathmandu). Without such a comparison, the claim of 'accurate real-time estimates' is unsupported.
- [Section 2 and Section 3.1-3.3] The framework's foundational premise—that businesses post more when open and less when closed—is never independently calibrated at the business level. The paper's own context introduces major confounders: in Puerto Rico, 45% of islanders were without power for three months, and in Kathmandu, mobile-phone data show roughly 60 days of net population outflow. Both would suppress posting even for businesses that remain physically open, so the detected 'downtime' could measure digital silence or infrastructure loss rather than closure. The authors should provide a control test using non-business pages (or pages of businesses independently known to be open) in the same regions, or a per-business comparison of posted status against a small ground-truth survey, to disentangle the proxy from these confounders.
- [Section 3.3, Step 1] The single-business PIT uses the empirical CDF of the 'current year,' which includes days after the disaster. This means the transformation for post-event days is contaminated by the anomaly the method is designed to detect: a business that posts zero for many days will have those zeros mapped through a CDF inflated by the very absence of posts, biasing the mid-quantiles upward and potentially shortening the detected downtime. The authors should use a pre-event reference period (e.g., the previous calendar year) or a causal expanding-window CDF that excludes the evaluation window, and show that the reported downtimes are robust to this choice.
- [Section 3.8 (Facebook surveys) and Supplementary Table 1] The Juchitán validation rests on 16 survey responses out of 52 contacted, with no description of how the 52 were selected, no non-response analysis, and no confidence interval on the reported 63-day average closure time. Similarly, the Kathmandu survey means have very large standard deviations (e.g., Area A: mean 29, SD 44), so the claimed agreement between the method and surveys (e.g., 33 days vs. 28 days) is not statistically meaningful as reported. The authors should provide response-bias considerations, confidence intervals, and, if possible, a comparison at the business level rather than only at the regional level.
minor comments (6)
- [Abstract and Results] The abstract states the method estimates downtime 'in real time' but the real-time section simulates with cropped data rather than truly deploying in real time; consider clarifying this in the abstract and text.
- [Section 1.3 and Table 4] The paper reports 52 days for Juchitán while also mentioning 66 days if the 12-day All Saints' Day period is included; please state explicitly which number is the headline figure and how holidays contiguous with an event are treated in the method.
- [Section 3.5] The linear trend removal in Step 3 is ad hoc and will also remove any slow recovery trend in the signal; if reopening is gradual rather than abrupt, this step could truncate the estimated downtime. The authors should discuss this possibility and test with simulated gradual-recovery data.
- [Section 3.1 and Discussion] The statement that mobile-phone data show 'roughly 60 days of net population outflow' from Kathmandu is presented as a validation anchor, but population displacement is a different quantity than business closure; the text should clarify why this is an upper bound for downtime and not a direct validation.
- [Supplementary Tables 5-7] The sensitivity tables show that downtime estimates fluctuate with business filters (e.g., Juchitán drops to 10 days at 400 posts/rate 0), yet the main text claims results are 'not affected by the filtering.' Please reconcile these numbers and state conditions under which the estimate is stable.
- [Data availability] Since the raw data cannot be shared due to Facebook's Platform Policy, the authors should consider depositing the derived aggregate time series and the code used for the entire pipeline in a public repository to enable reproducibility; currently only 'available upon request' is offered.
Circularity Check
Real-time validation is self-referential: the 'ground truth' downtime is defined as the method's own final estimate; the San Juan benchmark is also produced by the same elbow detector.
-
self definitional
[Section 1.5, 'Downtime detection in real-time']
"To evaluate the accuracy of the real-time estimate, we measure the root mean squared distance (RMSD) between dRT(t) and the ground truth downtime, dGT(t) = min(t,d∗), where d∗ is the downtime estimated using all data (d∗ = 50 days for Kathmandu)."
The validation target d_GT(t) is defined as min(t,d*), where d* is the output of the same detection procedure applied to the full dataset. Thus the 'ground truth' for the real-time claim is not an independent measurement of business closure; it is the method's own final estimate. Since the real-time estimator is a truncated version of the same detector, it will converge to d* as t approaches d* by construction. The reported RMSD values therefore measure internal self-consistency, not agreement with externally observed reopening, so the claim of 'accurate real-time estimates' reduces to a definitional equivalence.
-
fitted input called prediction
[Section 1.2, 'San Juan, Puerto Rico']
"To determine the actual downtime in San Juan after Hurricane Maria, we took tourism data from the Puerto Rico Tourism company [26], listing the monthly number of cruise passengers in the port of Old San Juan (see Supplementary Materials). We apply the elbow method (see Section 3.7) to this data and estimate a downtime of 102 days."
The benchmark for San Juan is labelled 'actual downtime', but it is computed by applying the paper's own elbow threshold-detection method to a different proxy series. Both the Facebook-based estimate and the tourism-based estimate are therefore outputs of the same data-driven detector rather than independent observations of reopening times. The comparison shows that two activity proxies respond similarly to the hurricane, but it does not externally validate the downtime length; the 'actual' value is itself a model output, which makes the validation partially circular.
full rationale
The main detection chain is not circular: the per-business PIT transformation, aggregation, standardization, and final uniform transform are deterministic operations on the raw post timestamps, and the threshold is selected from the event-count curve in a data-driven but non-tautological way. The Kathmandu comparison to mobility data [22] and to prior survey fieldwork provides some independent anchoring, and the sensitivity analyses are genuine robustness checks. However, the real-time validation in Section 1.5 is explicitly self-referential: the 'ground truth' d_GT(t) is defined as min(t,d*), where d* is the same method's final estimate on the full dataset. This makes the claimed real-time accuracy an internal consistency test rather than a test against independent observations. Similarly, the San Juan 'actual downtime' is obtained by applying the paper's own elbow method to cruise-passenger data, so the benchmark is a second output of the same detector rather than an independent ground truth. These two issues warrant a moderate circularity score, but they do not collapse the entire derivation: the final downtime values are also checked against external survey and mobility ranges, and the preprocessing itself is not fitted to the reported downtime. Score 4 reflects partial circularity in validation while acknowledging independent content in the underlying methodology.
Assumptions & free parameters
free parameters (3)
- Threshold T* =
Not explicitly reported, region-specific; selected via elbow method (Section 3.7)
- Minimum event duration =
7 days
- Active-period extension =
2 days
assumptions (5)
- domain assumption Businesses post more when open and less when closed
- domain assumption Business posting activities are independent, with any correlation corrected by a linear rescaling
- ad hoc to paper The empirical CDF of the current year is a valid normalization
- ad hoc to paper The elbow method separates normal from anomalous fluctuations
- domain assumption Businesses remain active between first and last post date plus two days
Cite this review
Pith. "Pith review of Social media usage reveals how regions recover after natural disaster." pith.science (2026). https://pith.science/paper/HFN6CDSK
@misc{pith2026190807384,
  author       = {Pith},
  title        = {Pith review of: Social media usage reveals how regions recover after natural disaster},
  year         = {2026},
  howpublished = {\url{https://pith.science/paper/HFN6CDSK}},
  note         = {Machine review of arXiv:1908.07384}
}
read the original abstract
The challenge of nowcasting and forecasting the effect of natural disasters (e.g. earthquakes, floods, hurricanes) on assets, people and society is of primary importance for assessing the ability of such systems to recover from extreme events. Traditional disaster recovery estimates, such as surveys and interviews, are usually costly, time consuming and do not scale. Here we present a methodology to indirectly estimate the post-emergency recovery status ('downtime') of small businesses in urban areas looking at their online posting activity on social media. Analysing the time series of posts before and after an event, we quantify the downtime of small businesses for three natural disasters occurred in Nepal, Puerto Rico and Mexico. A convenient and reliable method for nowcasting the post-emergency recovery status of economic activities could help local governments and decision makers to better target their interventions and distribute the available resources more effectively.
Figures

Figures from the paper (14 more)






Reference graph
Works this paper leans on
-
[1]
D. M. Neal, ``Reconsidering the phases of disasters,'' International Journal of Mass Emergencies and Disasters , vol. 15, no. 2, pp. 239--264, 1997
work page 1997
-
[2]
D. E. Alexander, Principles of emergency planning and management . Oxford University Press on Demand, 2002
work page 2002
-
[3]
R. B. Olshansky, L. D. Hopkins, and L. A. Johnson, ``Disaster and recovery: Processes compressed in time,'' Natural Hazards Review , vol. 13, pp. 173--178, aug 2012
work page 2012
- [4]
-
[5]
M. C. Comerio, ``Estimating downtime in loss modeling,'' Earthquake Spectra , vol. 22, pp. 349--365, may 2006
work page 2006
-
[6]
S. E. Chang, ``Urban disaster recovery: a measurement framework and its application to the 1995 kobe earthquake,'' Disasters , vol. 34, p. 303–327, Mar 2010
work page 1995
-
[7]
A. Harding and F. Powell, ``Variations in pedestrian traffic count in christchurch due to the september 2010 darfield (canterbury) earthquake,'' in Proceedings of the Ninth Pacific Conference on Earthquake Engineering: Building an Earthquake-Resilient Society , pp. 14--16, 2011
work page 2010
-
[8]
Campanella, ``Street survey of business reopenings in post-katrina new orleans,'' 2007
R. Campanella, ``Street survey of business reopenings in post-katrina new orleans,'' 2007
work page 2007
Show all 38 references
-
[9]
M. Hino, S. T. Belanger, C. B. Field, A. R. Davies, and K. J. Mach, ``High-tide flooding disrupts local economic activity,'' Science advances , vol. 5, no. 2, p. eaau2736, 2019
2019
-
[10]
Booth, K
E. Booth, K. Saito, R. Spence, G. Madabhushi, and R. T. Eguchi, ``Validating assessments of seismic damage made from remote sensing,'' Earthquake Spectra , vol. 27, p. S157–S177, Oct 2011
2011
-
[11]
De Luca , D
F. De Luca , D. Aldamen, J. Kurton, M. Wray, R. Mohan Pokhrel , and M. Werner, ``Traffic data as proxy of business downtime after natural disasters: The case of kathmandu,'' in 11th National Conference on Earthquake Engineering , 6 2018
2018
-
[12]
Murthy and A
D. Murthy and A. J. Gross, ``Social media processes in disasters: Implications of emergent technology use,'' Social Science Research , vol. 63, p. 356–370, Mar 2017
2017
-
[13]
Preis, H
T. Preis, H. S. Moat, S. R. Bishop, P. Treleaven, and H. E. Stanley, ``Quantifying the digital traces of hurricane sandy on flickr,'' Scientific Reports , vol. 3, Nov 2013
2013
-
[14]
Tkachenko, S
N. Tkachenko, S. Jarvis, and R. Procter, ``Predicting floods with flickr tags,'' PLOS ONE , vol. 12, p. e0172870, Feb 2017
2017
-
[15]
L. Zou, N. S. N. Lam, H. Cai, and Y. Qiang, ``Mining twitter data for improved understanding of disaster resilience,'' Annals of the American Association of Geographers , vol. 108, p. 1422–1441, Mar 2018
2018
-
[16]
P. S. Earle, D. C. Bowden, and M. Guy, ``Twitter earthquake detection: earthquake monitoring in a social world,'' Annals of Geophysics , vol. 54, no. 6, 2012
2012
-
[17]
Vieweg, A
S. Vieweg, A. L. Hughes, K. Starbird, and L. Palen, ``Microblogging during two natural hazards events,'' Proceedings of the 28th international conference on Human factors in computing systems - CHI '10 , 2010
2010
-
[18]
Sutton, E
J. Sutton, E. S. Spiro, B. Johnson, S. Fitzhugh, B. Gibson, and C. T. Butts, ``Warning tweets: Serial transmission of messages during the warning phase of a disaster event,'' Information, Communication & Society , vol. 17, no. 6, pp. 765--787, 2014
2014
-
[19]
Kryvasheyeu, H
Y. Kryvasheyeu, H. Chen, N. Obradovich, E. Moro, P. Van Hentenryck, J. Fowler, and M. Cebrian, ``Rapid assessment of disaster damage using social media activity,'' Science Advances , vol. 2, p. e1500779, Mar 2016
2016
-
[20]
J. P. Bagrow, D. Wang, and A.-L. Barabási, ``Collective response of human populations to large-scale emergencies,'' PLoS ONE , vol. 6, p. e17680, Mar 2011
2011
-
[21]
Deville, C
P. Deville, C. Linard, S. Martin, M. Gilbert, F. R. Stevens, A. E. Gaughan, V. D. Blondel, and A. J. Tatem, ``Dynamic population mapping using mobile phone data,'' Proceedings of the National Academy of Sciences , vol. 111, p. 15888–15893, Oct 2014
2014
-
[22]
Wilson, E
R. Wilson, E. zu Erbach-Schoenberg, M. Albert, D. Power, S. Tudge, M. Gonzalez, S. Guthrie, H. Chamberlain, C. Brooks, C. Hughes, and et al., ``Rapid and near real-time assessments of population displacement using mobile phone data following disasters: The 2015 nepal earthquak...
2015
-
[23]
X. Lu, L. Bengtsson, and P. Holme, ``Predictability of population displacement after the 2010 haiti earthquake,'' Proceedings of the National Academy of Sciences , vol. 109, p. 11576–11581, Jun 2012
2010
-
[24]
OpenStreetMap contributors , `` Planet dump retrieved from https://planet.osm.org .'' https://www.openstreetmap.org , 2018
2018
-
[25]
Boeing, ``Osmnx: New methods for acquiring, constructing, analyzing, and visualizing complex street networks,'' Computers, Environment and Urban Systems , vol
G. Boeing, ``Osmnx: New methods for acquiring, constructing, analyzing, and visualizing complex street networks,'' Computers, Environment and Urban Systems , vol. 65, p. 126–139, Sep 2017
2017
-
[26]
Accessed: 2019-02-11
`` Estadísticas.PR : Instituto de estadísticas de pr.'' https://www.estadisticas.pr. Accessed: 2019-02-11
2019
-
[27]
Office of the Resident Coordinator , `` Nepal : Earthquake 2015 ,'' vol. 05, no. 05, pp. 1--9, 2015
2015
-
[28]
International Monetary Fund , ``World economic outlook database,'' World Econ Financ Surv , 2018
2018
-
[29]
K. Goda, T. Kiyota, R. M. Pokhrel, G. Chiaro, T. Katagiri, K. Sharma, and S. Wilkinson, ``The 2015 gorkha nepal earthquake: Insights from earthquake damage survey,'' Frontiers in Built Environment , vol. 1, jun 2015
2015
-
[30]
September, pp
ACAPS, `` MEXICO AND GUATEMALA Earthquake Epicentre: Pacific Ocean, 8km southwest of Pijijiapan, Chiapas state in Mexico Magnitude in Mexico: 8.1 Magnitude in Guatemala: 7.6 Crisis overview ,'' no. September, pp. 1--6, 2017
2017
-
[31]
1 , Mexico Population Exposure in Mexico - Population Exposure Analysis ,'' vol
UNITAR-UNOSAT, `` Pijijiapan earthquake M w 8 . 1 , Mexico Population Exposure in Mexico - Population Exposure Analysis ,'' vol. 4020, no. September, 2017
2017
-
[32]
UNICEF, `` Mexico Humanitarian Situation Report No.6 ,'' no. 6, pp. 1--4, 2017
2017
-
[33]
rep., 2017
United States Department of Energy, Infrastructure Security and Energy Restoration , `` Hurricanes Maria, Irma, and Harvey September 20 Event Summary (Report \# 39) ,'' tech. rep., 2017
2017
-
[34]
FEMA, `` 2017 Hurricane Season FEMA After-Action Report ,'' 2018
2017
-
[35]
J. Shermeyer, ``Assessment of electrical and infrastructure recovery in puerto rico following hurricane maria using a multisource time series of satellite imagery,'' in Earth Resources and Environmental Remote Sensing/GIS Applications IX , vol. 10790, p. 1079010, International...
2018
-
[36]
``Quick facts: Hurricane maria's effect on puerto rico january 19, 2018,'' 2018
2018
-
[37]
Facebook, ``Helping small businesses succeed in a mobile world.'' Accessed: 2018-07-24
2018
-
[38]
J. E. Angus, ``The probability integral transform and related results,'' SIAM Review , vol. 36, p. 652–654, Dec 1994
1994
Reviewed August 14, 2026 · model on record in the stance chip above.
Discussion (0). Continue with ORCID to comment.