Trading Frictions in Dynamic Cap-and-Trade Markets
Pith reviewed 2026-06-28 07:29 UTC · model grok-4.3
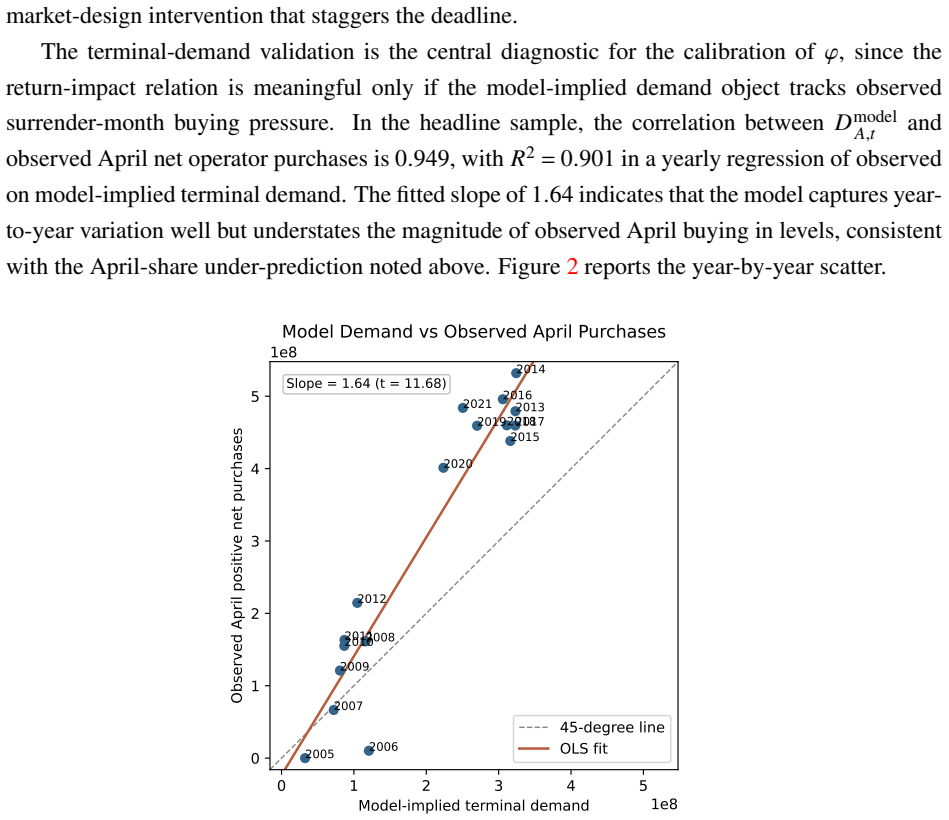
The pith
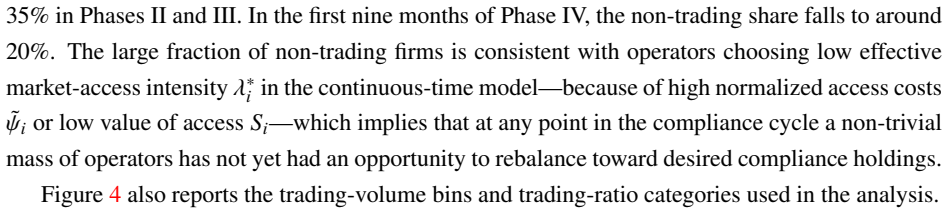
Costly market access in cap-and-trade systems creates a feedback loop with intermediary constraints that determines how trading frictions shape equilibrium prices.
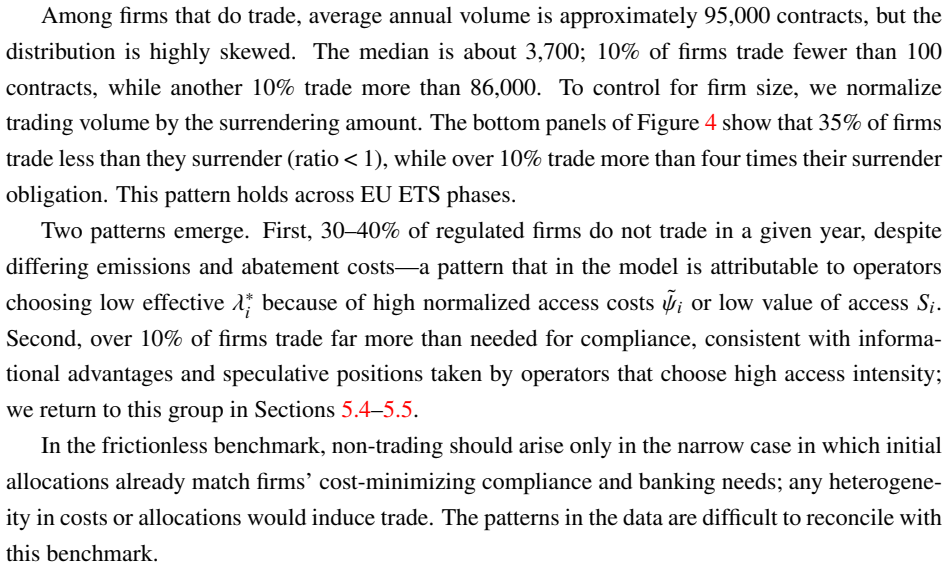
A machine-rendered reading of the paper's core claim, the machinery that carries it, and where it could break.
Core claim
Agents choose costly market access, access determines residual compliance demand, intermediary constraints translate residual demand into a surrender-month premium, and the premium feeds back into access incentives. These interactions shape how effectively the market corrects the externality. Access choices are characterized in closed form, the equilibrium premium is unique, endogenous access dampens the response to each friction in isolation, while the interaction of multiple frictions is non-additive and can amplify the price response.
What carries the argument
The feedback loop between endogenous costly market access and the surrender-month premium created by intermediary constraints on residual compliance demand.
If this is right
- Access choices admit a closed-form characterization.
- The equilibrium premium is unique.
- Any single friction produces a smaller price response once access can adjust.
- Combinations of frictions can generate larger price responses than the sum of their isolated effects.
- Operator trading flows contain information that predicts future returns.
Where Pith is reading between the lines
- Markets with high access costs may show more stable prices after isolated shocks but larger swings when shocks arrive together.
- Improving intermediation capacity or lowering access costs could reduce the amplifying effect of multiple frictions.
- Compliance and trading data from regulated firms could be used to forecast price movements beyond what aggregate supply and demand reveal.
Load-bearing premise
Intermediary constraints convert leftover compliance needs into a surrender-month price premium that in turn influences firms' decisions to pay for market access.
What would settle it
Observe whether the surrender-month premium changes when market-access costs are lowered or removed, or whether firms' access decisions respond to observed premiums.
Figures

read the original abstract
We develop a dynamic stochastic model of markets with an externality and multiple trading frictions, and cap-and-trade as the leading application. Slow participation, limited intermediation, and heterogeneous information interact in equilibrium: agents choose costly market access, access determines residual compliance demand, intermediary constraints translate residual demand into a surrender-month premium, and the premium feeds back into access incentives. These interactions shape how effectively the market corrects the externality. We characterize access choices in closed form, prove that the equilibrium premium is unique, and show that endogenous access dampens the response to each friction in isolation, while the interaction of multiple frictions is non-additive and can amplify the price response. We quantify the model using 2.7 million EU ETS registry transactions and compliance records from 2005-2021. About 40% of operators do not trade annually, purchases concentrate in April when returns are systematically high, and operator flow predicts future returns.
Editorial analysis
A structured set of objections, weighed in public.
Referee Report
Summary. The paper develops a dynamic stochastic model of cap-and-trade markets incorporating trading frictions (slow participation, limited intermediation, heterogeneous information). Agents endogenously choose costly market access; access shapes residual compliance demand; intermediary constraints map this demand into a surrender-month premium that feeds back into access incentives. The authors claim closed-form characterization of access choices, uniqueness of the equilibrium premium, dampening of isolated friction effects by endogenous access, and non-additive amplification from friction interactions. They quantify the model on 2.7 million EU ETS registry transactions and compliance records (2005-2021), documenting that ~40% of operators do not trade annually, April purchases concentrate when returns are high, and operator flows predict future returns.
Significance. If the central claims hold, the work supplies a tractable framework for how multiple frictions interact to shape price responses and externality correction in permit markets, with direct policy relevance for cap-and-trade design. Strengths include the stated closed-form access characterizations, the uniqueness proof, and the use of comprehensive registry data rather than reduced-form fitting. The non-additive interaction result, if secured, would be a notable contribution beyond single-friction models.
major comments (3)
- [Model setup and equilibrium construction] The equilibrium mechanism rests on the mapping from residual compliance demand to a time-varying surrender-month premium via intermediary constraints; this mapping is invoked as the core link between participation and prices but is presented without an explicit functional form, derivation, or uniqueness argument from the demand side (see model description and equilibrium definition).
- [Theoretical results section] The abstract asserts closed-form access choices and a uniqueness proof for the premium, yet the manuscript supplies no derivation steps, intermediate equations, or verification for these characterizations, which are load-bearing for all subsequent comparative-statics and quantitative claims.
- [Empirical quantification] Empirical quantification of friction interactions and price responses relies on the 2.7 million transactions, but the text reports no standard errors, robustness checks to sample restrictions, or exclusion criteria for the registry data, undermining attribution of observed patterns (April concentration, predictive flows) to the model's mechanisms.
minor comments (2)
- [Notation and timing] Notation for the premium and access cost parameters should be introduced with explicit timing subscripts to clarify the dynamic feedback.
- [Empirical results] The claim that 'operator flow predicts future returns' would benefit from a precise definition of the flow measure and the horizon over which predictability is tested.
Simulated Author's Rebuttal
We thank the referee for the thoughtful comments, which help improve the clarity of our model and empirical analysis. We respond to each major comment below and plan to revise the manuscript to address the points raised.
read point-by-point responses
-
Referee: The equilibrium mechanism rests on the mapping from residual compliance demand to a time-varying surrender-month premium via intermediary constraints; this mapping is invoked as the core link between participation and prices but is presented without an explicit functional form, derivation, or uniqueness argument from the demand side (see model description and equilibrium definition).
Authors: We agree that the mapping requires more explicit treatment. In the revised manuscript, we will derive the functional form of the premium from the intermediary's constrained optimization problem, provide the uniqueness argument from the demand side, and integrate these into the model description and equilibrium definition. revision: yes
-
Referee: The abstract asserts closed-form access choices and a uniqueness proof for the premium, yet the manuscript supplies no derivation steps, intermediate equations, or verification for these characterizations, which are load-bearing for all subsequent comparative-statics and quantitative claims.
Authors: The current draft presents the results without the full derivation steps. We will revise the theoretical results section to include the intermediate equations and verification steps for the closed-form access choices and the uniqueness proof of the equilibrium premium. revision: yes
-
Referee: Empirical quantification of friction interactions and price responses relies on the 2.7 million transactions, but the text reports no standard errors, robustness checks to sample restrictions, or exclusion criteria for the registry data, undermining attribution of observed patterns (April concentration, predictive flows) to the model's mechanisms.
Authors: We will add standard errors to the reported empirical patterns, include robustness checks under alternative sample restrictions, and specify the exclusion criteria applied to the registry data in the revised empirical section. revision: yes
Circularity Check
No significant circularity: model assumptions and proofs are self-contained; empirical work uses external data
full rationale
The paper sets up a dynamic model with stated frictions and an equilibrium mechanism linking access, residual demand, and premium via intermediary constraints. It explicitly claims closed-form characterizations of access choices and a proof of unique equilibrium premium. These are presented as derived results rather than tautological re-statements of inputs. Quantification relies on 2.7 million external EU ETS registry transactions (2005-2021), not on refitting model parameters to generate the reported patterns. No load-bearing step reduces by construction to a fitted input, self-citation chain, or renamed ansatz; the derivation chain remains independent of the target claims.
Axiom & Free-Parameter Ledger
axioms (2)
- domain assumption Agents choose costly market access that determines residual compliance demand
- domain assumption Intermediary constraints translate residual demand into a surrender-month premium
Reference graph
Works this paper leans on
-
[1]
Limits to arbitrage and hedging: Evidence from commodity markets,
Working paper. Acharya, Viral V , Lars A Lochstoer, and Tarun Ramadorai, “Limits to arbitrage and hedging: Evidence from commodity markets,”Journal of Financial Economics, 2013,109(2), 441–465. Barrage, Lint, “Optimal Dynamic Carbon Taxes in a Climate–Economy Model with Distortionary Fiscal Policy,”The Review of Economic Studies, 2020,87(1), 1–39. and Wil...
2013
-
[2]
Global Pricing of Carbon-Transition Risk,
Working Paper. Bolton, Patrick and Marcin Kacperczyk, “Global Pricing of Carbon-Transition Risk,”Journal of Finance, 2023,78(6), 3677–3754. Brunnermeier, Markus K. and Lasse Heje Pedersen, “Market Liquidity and Funding Liquidity,” Review of Financial Studies, 2009,22(6), 2201–2238. Cantillon, Estelle and Aurélie Slechten, “Market design for the environmen...
2023
-
[3]
Does Pricing Car- bon Mitigate Climate Change? Firm-Level Evidence from the European Union Emissions Trad- ing System,
Colmer, Jonathan, Ralf Martin, Mirabelle Muûls, and Ulrich J. Wagner, “Does Pricing Car- bon Mitigate Climate Change? Firm-Level Evidence from the European Union Emissions Trad- ing System,”Review of Economic Studies, 2025,92(3), 1625–1660. Croce, Mariano Max Massimiliano, Nicolas Guinez, Alejandra Inzunza Méndez, Thien T. Nguyen, and Claudio Tebaldi, “Gr...
2025
-
[4]
Presidential Address: Asset Price Dynamics with Slow-Moving Capital,
42 Duffie, Darrell, “Presidential Address: Asset Price Dynamics with Slow-Moving Capital,”Jour- nal of Finance, 2010,65(4), 1237–1267. , Nicolae Gârleanu, and Lasse Heje Pedersen, “Valuation in Over-the-Counter Markets,”Re- view of Financial Studies, 2007,20(6), 1865–1900. Engle, Robert F., Stefano Giglio, Bryan Kelly, Heebum Lee, and Johannes Stroebel, “...
2010
-
[5]
Incomplete Financial Markets, the Social Cost of Carbon and Constrained Efficient Carbon Pricing,
43 Kübler, Felix, “Incomplete Financial Markets, the Social Cost of Carbon and Constrained Efficient Carbon Pricing,”Journal of Economic Theory, 2025,230, 106105. Kyle, Albert S., “Continuous Auctions and Insider Trading,”Econometrica, 1985,53(6), 1315–
2025
-
[6]
The General Theory of Second Best,
Lipsey, R. G. and Kelvin Lancaster, “The General Theory of Second Best,”Review of Economic Studies, 1956,24(1), 11–32. Montgomery, W David, “Markets in licenses and efficient pollution control programs,”Journal of Economic Theory, 1972,5(3), 395–418. Newey, Whitney and Kenneth West, “A simple, positive semi-definite, heteroskedasticity and autocorrelation...
1956
-
[7]
The system covers more than 13,000 facilities spanning diverse industrial sectors
44 A Online Appendix A.1 Market Overview The EU ETS is the first large carbon market in the world. The system covers more than 13,000 facilities spanning diverse industrial sectors. Functioning as a cap-and-trade system, the EU ETS allocates emission permits, commonly known as European Union Allowances (EUAs), to regulated companies. Regulated companies a...
2005
-
[8]
The second trading phase (Phase II) goes from 2008 to
This is a pilot phase that lays the groundwork for subsequent phases by establishing trading rules and procedures. The second trading phase (Phase II) goes from 2008 to
2008
-
[9]
The third phase (Phase III) goes from 2013 to 2020, while the current phase (Phase IV) started in 2021 and will end in
Building upon Phase I, the EU ETS expanded its scope and refined its mechanisms, including efforts to standardize the allocation rules and improve the pricing and functionality of the trading system. The third phase (Phase III) goes from 2013 to 2020, while the current phase (Phase IV) started in 2021 and will end in
2013
-
[10]
In particular, each year operators must submit an emission report
During our sample period, the EU ETS has a fixed verifying and surrendering schedule each year. In particular, each year operators must submit an emission report. The emissions data for a given year must be verified by an accredited verifier by the end of March of each year. Then, operators must surrender the equivalent number of allowances to match the i...
2023
-
[11]
In contrast, the number of operator holding accounts has been increasing, starting at 3,755 at the onset of the EU ETS, reaching a peak of 7,758 in 2013, and stabilizing around 6,198 in
2013
-
[12]
Data is from February 2005 to September
3 Figure A.1: EUA Buy and Sell Transactions by Holding Type This figure presents the evolution in the total euro amount (top panels) and transaction counts (bottom panel) of EUA sold and purchased by holding type. Data is from February 2005 to September
2005
-
[13]
Panel A reports the average numbers of sales, buys, and total trades as well as the fractions of sales, buys, and total trades with other operators
Phase 1 Phase 2 Phase 3 Phase 4 0 100 200 300 400 500 600 700 800T otal Value (euro bn) T otal EUAs sold by holding type person holding account operator holding account Phase 1 Phase 2 Phase 3 Phase 4 0 100 200 300 400 500 600 700T otal Value (euro bn) T otal EUAs purchased by holding type Phase 1 Phase 2 Phase 3 Phase 4 0 50 100 150 200 250 300 350Transa...
2003
-
[14]
Sample harmonization Table A.2 reports operator-year counts (one observation per operator and compliance cycle) for the headline 2005–2021 sample and for two robustness samples: one excluding the non-bankable Phase I pilot and one restricted to mature-market Phase III years. 15 Table A.2: Sample harmonization for the quantitative analysis Sample Years N o...
2005
discussion (0)
Sign in with ORCID, Apple, or X to comment. Anyone can read and Pith papers without signing in.